EVALUATION OF COST OF QUALITY USING
ACTIVITY BASED COSTING: A CASE STUDY
Aneesh M.
1, Ajith P. M.
21
P.G. Scholar, Associate Professor, Department of Mechanical Engineering, RIT Kottayam, (India)
ABSTRACT
This paper was aimed at developing a Quality Costing System for manufacturing industry, and to show that
such a system could provide a basis for analysing quality costs and developing and evaluating the quality
improvement process. Current quality cost measurement systems were limited by their inability to trace quality
costs to their source; quality was manageable only if it could be measured; quality cost did not easily fit into the
traditional cost accounting structure; traditional accounting systems were unlikely to change radically to
accommodate proper quality costing. Activity Based Costing tools with the theory of quality costing to provide a
system that can deliver valuable information is implemented as an effective CoQ (Cost of Quality) analysing
tool. The CoQ of the agricultural machine manufacturing industry situated in Kerala, was evaluated using ABC
terminology.
Keywords
-
Activity based costing, Cost of Quality, PAF, Productivity, Poor quality
I.
INTRODUCTION
Nowadays, a clear understanding of the economics of quality and the use of a quality cost system in the management of quality and of quality improvement efforts may make the difference between maintaining current levels of profitability and outperforming the competition.
II.
LITERATURE REVIEW
Poor quality of products and processes has direct impact on the finance of the company in both the company’s top line (revenues) and its bottom line (profits). During development, i.e., the design and manufacturing phase , poor quality causes late delivery, added test time, added development time to correct problems found, and additional people being added to try to overcome the problems encountered. This adds significantly to development costs, reducing the bottom line. Once poor quality products are delivered to customers, word of that poor quality quickly spreads, and results in reduced sales, from some who will return products they are not satisfied with, and from others who will never buy a poor quality product in the first place.[2] This reduces ongoing revenues, often significantly, thus impacting both the top and bottom lines. With poor quality product in the field, customer support issues will quickly grow, and this will in turn require additional engineering support people to be assigned. These added support and engineering costs would add to development costs, often for prolonged periods of time, further reducing the bottom line[3]. Poor quality products also imply a poor quality company, affecting the reputation of the company. For avoiding the poor quality issues the company have to focus on cos of quality analysis. The cost of quality model is specified in Fig 1.
Figure 1 Quality cost model
III. CASE STUDY
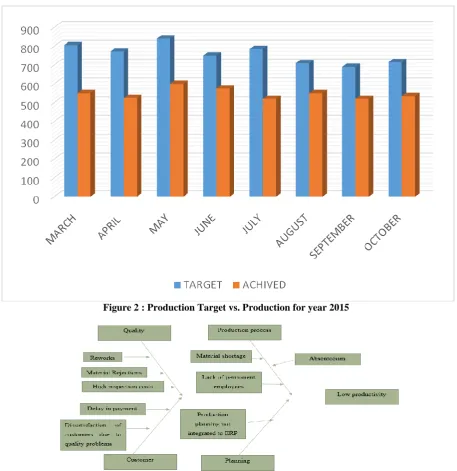
Figure 2 : Production Target vs. Production for year 2015
Figure 3: Fish-bone Diagram
IV.
DATA COLLECTION AND ANALYSIS
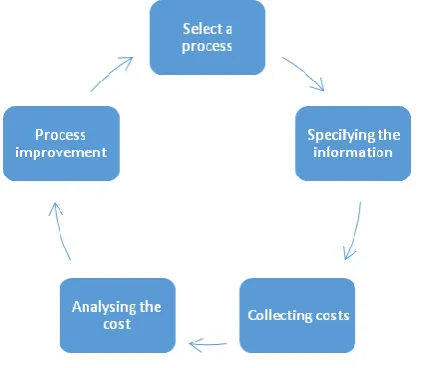
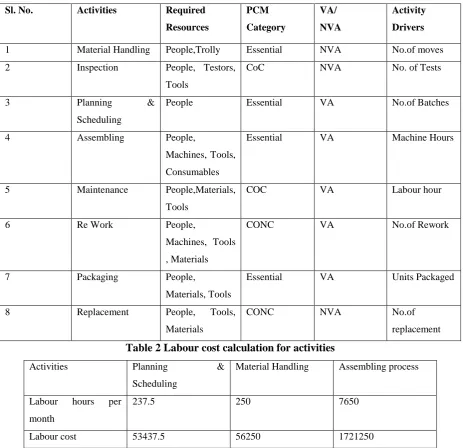
listing out of all activities in the process, tracing resources costs to activities using resource drivers and tracing activity costs to cost objects using activity drivers were done. Machine hours, number of reworks, number of tests carried out, units taken for packaging, number of loaded batches, maintenance hours etc are the activity drivers used for activity cost assignment to cost objects.Table 1 represents the results of activities identified, resources required, resource drivers and Table 2 represents tracing the labour costs of each activity . Table 3Machine costs for corresponding activitiesand Table 4 represents the results of tracing the activity costs to cost objects using activity drivers.
Table 1 List of activities
Sl. No. Activities Required
Resources PCM Category VA/ NVA Activity Drivers
1 Material Handling People,Trolly Essential NVA No.of moves
2 Inspection People, Testors,
Tools
CoC NVA No. of Tests
3 Planning &
Scheduling
People Essential VA No.of Batches
4 Assembling People,
Machines, Tools, Consumables
Essential VA Machine Hours
5 Maintenance People,Materials,
Tools
COC VA Labour hour
6 Re Work People,
Machines, Tools , Materials
CONC VA No.of Rework
7 Packaging People,
Materials, Tools
Essential VA Units Packaged
8 Replacement People, Tools,
Materials
CONC NVA No.of
replacement
Table 2 Labour cost calculation for activities
Activities Planning &
Scheduling
Material Handling Assembling process
Labour hours per month
237.5 250 7650
Labour cost 53437.5 56250 1721250
Table 3 Machine cost for activities
Sl.
No .
Activities Activity
code
Engine Asembly Transmission Assembly Total
machine Hours
Total
machine cost Hours/Day No.of.
Days Total per month Hours/D ay No.of. Days
Total per
month
Material
Handling
MH 001 0 0 0 0 0 0 0 0
Inspection INS001 1.5 25 37.5 1.7 25 42.5 80 4304
Planning &
Scheduling
PS 001 0 0 0 0 0 0 0 0
Assembling AS001 3.8 25 95 3.9 25 97.5 192.5 10356.5
Maintenance MN001 0.7 25 17.5 0.6 25 15 32.5 1748.5
Re Work RWK
001
1.3 25 32.5 1.5 25 37.5 70 3766
Packaging PK001 0 0 0 0 0 0 0 0
Replacement RP001 0 0 0 0 0 0 0 0
Planning and scheduling, Material handling cost and Machine cost are essential Non-Value added costs. Even though they are not adding any values they cannot be eliminated. Machining and packaging are essential value added costs. Inspection and maintenance are cost of conformance, out of which inspection is Non-value added and Maintenance Value added.Rework, Warranty repairs and Replacements are cost of non-conform Rework, Warranty repairs and Replacements are cost of non-conformance which are non-value added costs. Further analysis made on these costs to identify the root cause.
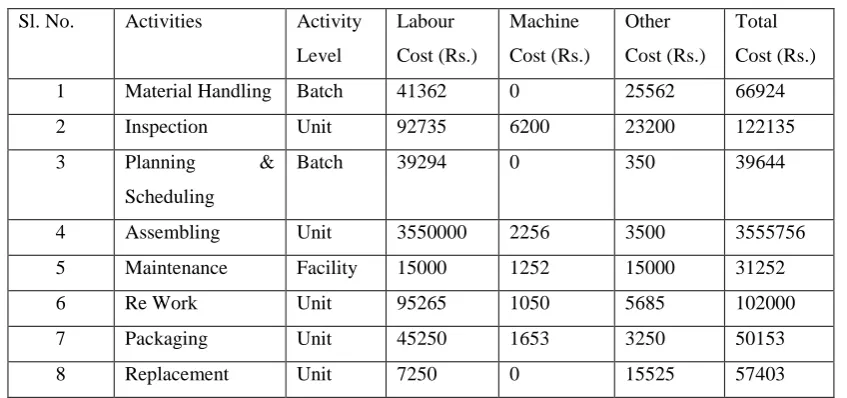
Table 4 Activity cost assignment
Sl. No. Activities Activity Level Labour Cost (Rs.) Machine Cost (Rs.) Other Cost (Rs.) Total Cost (Rs.)
1 Material Handling Batch 41362 0 25562 66924
2 Inspection Unit 92735 6200 23200 122135
3 Planning & Scheduling
Batch 39294 0 350 39644
4 Assembling Unit 3550000 2256 3500 3555756
5 Maintenance Facility 15000 1252 15000 31252
6 Re Work Unit 95265 1050 5685 102000
7 Packaging Unit 45250 1653 3250 50153
8 Replacement Unit 7250 0 15525 57403
areas were identified in this analysis. Costs traced are grouped to COQ related and COQ –unrelated costs to cost objects. In the COQ related costs, further analysis made to identify the Cost of Conformance and Cost of Non Conformance.
Total Activity cost = Labour cost + machine cost + other cost = 3973880Rs.
Total product cost= Total activity cost + Direct material cost = 3973880 + 30657388= 34631268 Rs.
Percentage of direct material cost to product cost = direct material cost /Total product cost = 88.5%
Percentage of total activity cost to product cost = Total activity cost /Total product cost = 11.5%
Unit product cost= Total product cost/Production quantity = 34631268/350 = 98946.48Rs. Table 5 Total CoQ cost analysis.
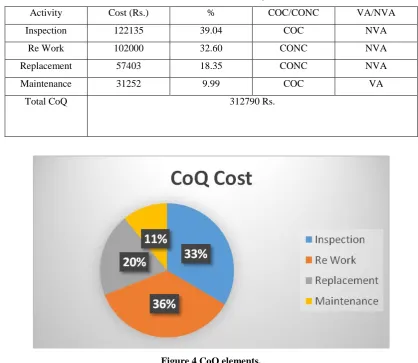
Activity Cost (Rs.) % COC/CONC VA/NVA
Inspection 122135 39.04 COC NVA
Re Work 102000 32.60 CONC NVA
Replacement 57403 18.35 CONC NVA
Maintenance 31252 9.99 COC VA
Total CoQ 312790 Rs.
Figure 4 CoQ elements.
V. RESULTS AND FINDINGS
The cost of the inspection, re- work and warranty repairs arefound as the major contributors of Cost of Quality. Inspection cost is the activity bearing highest COQ with a contribution of 39% of the total COQ; Reworkcost is next highest.
Idle capacity costs are also identified in this analysis, which gives an insight to the authorities to deploy the unused resources.
This integrated model enables resources and other associated costs to be more accurately attributed to the products and the customers and identifies where high (and low) costs are being incurred. The reason for the same can also be traced out.
The analysis shows that CO Q can be more effectively calculated in the ABM system than the traditional PAF model, since it tracks all the resource costs to the activities including the costs of indirect labour and indirect machine which are not appropriately assessed in the PAF model.
VI. CONCLUSION
Many research papers on CoQ propose quality cost models, methods and techniques, and provide abundant information on the topic. The literature review of the practical use of CoQ suggests that even though quality is considered to be an important issue, the CoQ approach is not fully appreciated by organizations and only a minority of them use a formal quality costing method. Nevertheless, companies usually do have quality systems and continuous improvement programs, but approach quality improvement and cost containment in many other ways. Thus, although not using CoQ as a method to drive quality costs down, they achieve the required result with different techniques.
In this paper an attempt is made in this study to analyse the drawbacks of traditional methods of Cost of Quality, advantages of Activity Based Costing methods over the traditional method and also the strengths of Activity Based Cost of Quality system model. It is explicit that ABC oriented COQ system is an alternative to overcome the limitations of traditional mode, such as inappropriate resource allocation, difficulty in tracing COQ to its cost objects. Further a detailed case study on implementation of COQ with ABC model has been conducted. This study points out the requirement of an integrated data capturing system.
REFERENCES
[1] Dale, B.G. and Plunkett, J.J., Quality Costing, 3rd ed., Gower Press, Aldershot, 1999
[2] Dale, B.G. and Wan, G.M. , “Setting up a quality costing system. an evaluation of the keyissues”, Business Process Management Journal, Vol. 8 No. 2, p. 104, 2002
[3] Ross, P. "Cost of Quality Reporting Practices by Australian Manufacturing Firms." CPA 68(4): 54-56,1998 [4] Williams, A., et al.. "Quality costing: a management review." International Journal of Management
Reviews 1(4): 441-460,1999
[5] Shah, K.K.R. and FitzRoy, P.T. (1998), “A review of quality cost surveys”, Total Quality Management, Vol. 9 No. 6, p. 479.
[7] Sorqvist, L. , “Difficulties in measuring the cost of poor quality”, European Quality, Vol. 4 No. 2, p. 40,1997
[8] Tatikonda, L.U. and Tatikonda, R.J., “Measuring and reporting the cost of quality”, Production & Inventory Management Journal, Vol. 37, p. 1, 1996
[9] Israeli, A. and Fisher, B., “Cutting quality costs”, Quality Progress, January, p. 46, 1991
[10] Gupta, M. and Campbell, V.S., “The cost of quality”, Production & Inventory Management Journal, Vol. 36 No. 3, p. 43, 1995
[11] Burgess, T.F. , “Modeling quality-cost dynamics”, International Journal of Quality & Reliability Management, Vol. 13 No. 3, p. 8, 1996
[12] Dawes, E.W., “Quality costs – new concepts and methods, quality costs: ideas & applications”, Vol.2, ASQC Quality Press, Milwaukee, WI, p. 440, 1989
[13] Suminsky, L.T. Jr , “Measuring cost of quality”, Quality Digest, Vol. 14 No. 3, p. 26, 1994
[14] Denton, D.K. and Kowalski, T.P. , “Measuring nonconforming costs reduced manufacturer’s cost of quality in product by $200 000”, Industrial Engineering, Vol. 20, p. 36, 1988
[15] Sandoval-Chavez, D.A. and Beruvides, M.G., “Using opportunity costs to determine the cost of quality: a case study in a continuous-process industry”, Engineering Economist, Vol. 43, p. 107, 1998
[16] Modarres, B. and Ansari, A. , “Two new dimensions in the cost of quality”, International Journal of Quality & Reliability Management, Vol. 4 No. 4, p. 9, 1987
[17] Carr, L.P., “Applying cost of quality to a service business”, Sloan Management Reviews, Summer, p. 72, 1992
[18] Malchi, G. and McGurk, H., “Increasing value through the measurement of the cost of quality (CoQ) – a practical approach”, Pharmaceutical Engineering, Vol. 21 No. 3, p. 92, 2001
[19] Ross, D.T., “Structured analysis (SA): a language for communicating ideas”, IEEE Transactions on Software Engineering, Vol. SE-3 No. 1, p. 16, 1977
[20] Marsh, J., “Process modeling for quality improvement”, Proceedings of the Second International Conference on Total Quality Management, p. 111, 1989
[21] Cooper, R. , “The rise of activity-based costing – Part I: what is an activity-based cost system?”, Journal of Cost Management, Vol. 2 No. 2, p. 45., 1988
[22] Tsai, W.H., “Quality cost measurement under activity-based costing”, International Journal of Quality & Reliability Management, Vol. 15 No. 7, p. 719, 1998
[23] Hester, W.F. , “True quality cost with activity based costing”, ASQC Annual Quality Congress Transactions, p. 446, 1993