Irrigation water for vegetation establishment
R.E. RIES, F.M. SANDOVAL, AND J.F. POWERThis research project was conducted to’ evaluate tbe use of irrigation water to supplement predpitation during establishment of perennhi for8ge plant communities on surf8ce mined hnds in the northern Great Plains. Tbe treatments included precipitation and 9 combinations of various quantities of medium and low quality water applied to 8 ci8y loam topsoii repi8ced over 8 loam minespoil. We measured the response to the added water of a seeded forage species mixture, volunteer weeds, and cb8nges in salinity and sodicity of the soil/spoil profile. All levels of irrigation, regardless of water quality, increased seeded species production, but decreased weed dry matter. One season of irrigation with medium or low qurlity water produced minimal changes in soil saiinity and sodicity. Someincrease in soil salinity and sodicity was observed when low quality water was added during the second season. Therefore, low quality water can be used beneficially to supplement precipitation for 1 or 2 seasons during the establisb- ment of perennial plant communities on moderntely permeable soil/spoil 8reas.
Key Words: irrigation, grass/legume, sodicity, salinity, revegeta- tion, reclaomtion, perennhl for8ges
Prompt reestablishment of vegetation on disturbed lands is important to protect replaced soil materials from excessive soil erosion. Successful revegetation in the semiarid and arid West (Ries and Day 1978) is dependent on amount and distribution of precipitation. Irrigation to supplement natura1 precipitation dur- ing stand establishment of perennial plant communities is often beneficial, especially when precipitation is limited (Ries 1980).
Within the lignite fields of North Dakota, most ground waters (Croft 1974) and surface impounded waters (Gilley et al. 1976) are of marginal quality for irrigation. Because these waters usually have to be disposed of during mining, there has been interest in using them for irrigation during perennial plant community estab- lishment. Recent studies have shown the usability of poor quality water, even sea water, for crop production with carefully managed irrigation practices (Epstein and Norlyn 1977, Thomas et al. I98 1). Other research using blowdown water (a highly saline water result- ing from power plant cooling towers) has shown similar usability (Zartman et al. 1980, Jury et al. 1980).
The research reported in this paper was conducted to evaluate
Authors arc range scientist and soil scientists, respectively, USDA-ARS, Northern Great Plains Research Laboratory, P.O. Box459, Mandan, ND 58554. J.F. Power is now with the USDA-AR& Soil and Water Conservation Research Unit, University of Nebraska, Lincoln 68583. F.M. Sandoval, retired, 4685 Clearview Rd., Belgrade, Mont. 59714.
The authors wish to thank Knife River Coal Mining Company and their personnel for help throughout this study.
Manuscript accepted 21 December 1987.
210
the use of marginal quality water to supplement precipitation during establishment of perennial forage plant communities on surface mined lands. Results could also be applied to grass estab- lishment on undisturbed lands.
Study Area and Methoda
This research was conducted in southwestern North Dakota, near Gascoyne about 46”N, 103’W, on land that had been surface mined for lignite. Soil in the area before mining was Shambo loam (fine-loamy, mixed Typic Ifaploboroll) on nearly level to gentle slopes. Climate is continental, with frequent and rapid temperature changes throughout the year. Average annual temperature is 6.1“ C and the highly variable precipitation averages 380 mm annually. Seventy percent of the long-term average precipitation falls from May through September with June being the wettest month (almost 100 mm). Droughts are common and may last fot months or years. Potential evapotranspiration is about twice average precipitation.
After mining, mine spoils were leveled to less than 1% grade, disked, and an average thickness of 210 mm of topsoil spread over the plot area. The plot area was fertilized with 18 kg N and 35 kg P/ha, disked and harrowed. A total of 30 plots, I20 by I80 cm, were established on the plot area in 3 blocks.
Soil and spoil samples were taken from each plot in June of 1977, prior to seeding, to characterize soil and spoil on the plot area. Topsoil was sampled in depth increments of 0 to 100 to 210 mm. Spoil was sampled in 1%mm increments from 210 through 810 mm, and in 300-mm increments from 810 to 1,710 mm. Each sample was composed of 2 separate cores, 36 mm diameter, com- posited by depth increment. Laboratory procedures are described in Handbook 60 (USDA 1954) and Handbook 525 (Sandoval and Power 1977). The soil and spoil pH was determined on a saturation paste and electrical conductivity (EC) on paste extract. Atomic absorption spectrophotometry was used to determine calcium, magnesium, and sodium concentrations in the saturation extract. Sodium adsorption ratio (SAR) was calculated for each soil and spoil sample to evaluate sodicity. Texture (% sand, silt and clay) was determined by the hydrometer method. The same procedures for sampling and analysis of the soil and spoil were repeated each fall after harvest in 1977, 1978, and 1979.
Calcium carbonate and gypsum concentrations were determined because some acid pH values were encountered in lower depths of the spoil. The low pH was probably caused by an excess of hydro- gen ions from the lignite contained in the spoil materials. However, low pH should be a transitory condition because of the high levels of calcium reserve in these materials. Soil and spoil characteristics on the research plots at the start of the study are given in Table 1.
Each plot was broadcast seeded June 30, 1977, at a rate of 13.4 Precipitation was measured on site during each growing season kg/ha pure live seed (~1s) of a grass-legume mixture [23% western with a standard recording rain gauge. Pan evaporation, air wheatgrass (Agropyron smirhii Rydb.); 11% slender wheatgrass temperatures, and wind speed were measured with standard U.S. [A. truchycuulum (Link) Malte.]; 17% green needlegrass (Sfipo Weather Bureau equipment (Table 2 and 3).
viridula Trin.); 42% annual rye (Secule cereale L.); and 7% yellow sweetclover (Melilorus officinalis (L.) Lam.)]. The plots were raked
Medium and low quality waters were used in this study to
by hand to cover the seed.
supplement precipitation. The medium quality water came from the Missouri River and a well near the Gascoyne mine. The low
T8bic 1. Soil 8nd spoil ch8ncteristics.
Depth PH
Caco3
Equiv. Gypsum Sand Silt Clay Texture’ EC* SAR’
(mm) Topsoil O-100
100-210 Spoil 210-360 360-510 51o-660 660810 810-1110 1110-1410 1410-1710
7.44 8.3 0.8 36 36 28 CL 4.9 5.5
7.4 7.8 0.5 36 36 28 CL 5.5 7.2
6.3 4.2 2.7 35 41 24 L 6.2 4.5
6.1 2.9 3.3 35 41 24 L 5.7 3.6
6.0 2.4 3.7 35 41 24 L 5.7 3.6
5.9 2.5 3.6 36 41 23 L 5.7 3.6
5.8 2.8 2.6 36 41 23 L 5.8 3.7
5.9 3.0 2.8 39 40 21 L 5.9 3.7
5.6 2.4 2.3 39 40 21 L 5.4 3.5
M moi/ kg-’ ----__- _--y_---___ dS m-l
‘CL, clay loam; L, loam.
%alinity as measured by electrical conductivity (EC).
‘Sodium adsorption ration = SAR = Na/[(Ca + Mg)/2]rR soluble cation concentrations expressed in meq./L for calculation. ‘Each value represents the means of 30 samples.
T8bic 2. PrecipiWion 8nd free w8ter ev8pontion d8t8 collected 8t Knife Rives Mine neu Clscoyne, North D8kot8.
Month 1977
Precipitation
1978 1979 LTA’ 1977
Evaporation
1978 1979
June July August September Growing season Total
---mm--_________-- ---_---mm---
I08 78 51 97 326 284 287
41 85 77 56 351 314 276
74 38 80 45 280 242 275
133 67 31 35 162 208 234
356 268 239 233
‘Long term average (301 years) from U.S. Weather Bureau records. Bowman, ND.. 22 km W. of mine.
T8bie 3. Temperature 8nd wind speed d8t8 coiiected 8t Knife River Mine nar G8scoyne. North D8kot8.
Month 1977
Average Temperature
1978 1979 LTA’ 1977
Average Wind
1978 1979
_____________oC__--- __________ms~l_---
June 19.7 17.4 19.3 16.6 3.4 2.8 3.6
July 21.6 20.9 20.6 21.1 3.6 2.4 2.5
August 17.8 20.7 19.3 20.5 2.8 2.1 2.7
September is.1 16.1 17.4 14.0 3.3 2.4 2.7
‘Long term average (30+ years) from U.S. Weather Bureau records, Bowman, ND., 22 km W. of mine
T8bie 4. Qu8iity p8r8meten of w8ter used for irrigation.
Hazard’
Water Year EC’ Tconc.2 SAR’ Class
dS m-’ meq./ 1.
Medium Quality5 1977 1.0 14.5 6.5 C3-S2
Low Quality 1977 3.2 36.4 il.6 c4-s3
1978 3.8 43.8 18.2 c4-s4
‘Salinity as measured by electrical conductivity (EC). Tconc. = total concentration
?%dium adsoprtion ratio = SAR = Na/[(Ca+Mg)/Z]‘“; concentration of cations used in calculation are expressed in meq./ L. ‘(U.S. Salinity Laboratory Staff 1954) p. 80.
Y%sdium” and “low” are relative terms arbitrarily chosen and do not imply water classification.
Salinity Sodicity
quality water was ground water intercepted by mining and pumped from the pit. Samples of both waters were analyzed for EC, cal- cium, magnesium, and sodium concentrations and SAR was calcu- lated (Table 4).
Table 6. Available soil water at the start of season.
from the pit. Samples of both waters were analyze; for EC, cal- cium, magnesium, and sodium concentrations and SAR was calcu- lated (Table 4).
Water Treatments
Ten water treatments were evaluated. These treatments are listed in Table 5 along with actual amounts of water applied during the study. Besides the precipitation control plots, there were 3 levels of total water applied (precipitation plus irrigation) per season for each water quality (medium and low). Level 1 received 193 mm of water during the season (about 75% expected average precipita- tion). Level 2 approximated mean free water evaporation of 628 mm during the 3-month season. Level 3 was arbitrarily set at 915 mm during the season.
Water treatments were randomly assigned to each of the 10 plots in each block. Water was applied to each plot by dripping through a 120 by 180 cm galvanized pan with 0.8 mm holes in the bottom, at the rate of about 25 mm per hour. Each plot had a soil border (76 mm high) around it to prevent runon and runoff. Irrigation to supplement natural precipitation was applied during the months of July, August, and September of 1977 and 1978. Medium quality water was applied for one year and low quality water (worst case) was applied for 2 years. The total water required per season was divided by the number of weeks irrigation was applied to obtain weekly application amounts. Any precipitation received was sub- tracted from the weekly application amounts. If water was needed above precipitation, it was applied to the appropriate plot. Because precipitation occasionally exceeded the weekly rate, actual quanti- ties of water received (Table 5) were slightly higher than planned. No irrigation was applied during the 1979 growing season.
mm HsO/910mm Soil/Spoil 1. Natural Pptn.* I 48 4 2. Pptn. + MQW3
193 mm; I yr. 4 11 11 3. Pptn. + MQW
628 mm; 1 yr. 8 69 14 4. Pptn. + MQW
915 mm; 1 yr. 8 100 34 5. Pptn. + LQW4
193 mm; I yr. 4 18 11 6. Pptn + LQW
628 mm; 1 yr. 0 14 14 7. Pptn. + LQW
915 mm; 1 yr. 0 104 9 8. Pptn. + LQW
193 mm; 2 yr. 0 24 3 9. Pptn. + LQW
628 mm; 2 yr. 4 75 21 10. Pptn. + LQW
915 mm; 2 yr. 1 79 44
1Available soil water = Total soil water minus I.5 MPa soil water. 2P tn. = Precipitation
3 id QW = Medium Quality Water ‘LQW = Low Quality Water
into seeded forage species and weeds, oven-dried at 60’ C for 48 h, and weighed.
Soil water in each plot was measured periodically with a neutron meter by 300-mm increments to a depth of 2,400 mm. Available soil water (total soil water minus 1.5 MPa soil water) is shown at the beginning of the study in June of 1977 and in May of both 1978 and 1979 in Table 6.
Data were analyzed as a randomized complete block analysis of variance. The significance of differences between means for vegeta- tion yield was determined by a Fisher’s protected least significant difference (LSD) test at PI.05 (Steel and Torrie 1980). The rela- tionships of total yield of seeded and weed species to total water applied by irrigation were evaluated by correlation analysis.
Vegetation yield, used as an indirect measure of establishment, was measured in late summer each year by clipping at ground level, two 929-cm2 areas from each plot. The vegetation was separated
Table 5. Precipitation and water dded by irrigation to 10 water treatmenti during the 3 year period.
Mean changes in soil/ spoil salinity and sodicity were calculated by subtracting the ending (Fall 1979) EC and SAR from the baseline (Spring 1977) EC and SAR level by each soil depth. Comparisons of the quantity of change under the various water
Available Soil Water’
Jun 77 May 78 May 79
Water Treatments
1. Natural Pptn.1 2. Pptn. + MQW2
193 mm; I yr. 3. Pptn. + MQW 628 mm; 1 yr. 4. Pptn. + MQW 915 mm; 1 yr. 5. Pptn. + LQW’
193 mm; 1 yr. 6. Pptn. + LQW 628 mm; 1 yr. 7. Pptn. + LQW 915 mm; I yr. 8. Pptn. + LQW 193mm;Zyr. 9. Pptn. + LQW
628 mm; 2 yr. 10. Pptn. + LQW 915 mm; 2 yr.
IP tn. = Precipitation * hf QW q Medium Quality Water
‘LQW = Low Quality Water
Precip. 248 248 248 248 248 248 248 248 248 248 1977 Irr. 0 47 382 697 47 382 697 47 382 697
Precipitation, Water Added by Irrigation (Jul - Sep)
Total Added
1978 by Irrigation 1979 Total Precip. Irr. Total 1977-78 Precip.
z-m
248 190 0 190 0 188
295 190 0 190 47 188
630 190 0 190 382 188
945 190 0 190 697 188
295 190 0 190 47 188
630 190 0 190 382 188
945 190 0 190 697 188
295 190 34 224 81 188
630 190 391 581 773 188
945 190 728 918 1425 188
Table 7. Yield of seeded forage ape&s.
I
Seeded Forage Yield (g rnma) Years Total Water Treatment 1977 1978 1979 1977-79
LSD .05 Years q 85
1. Pptn.’ 4 302 51 357
2. Pptn. + MQW2
193 nun; 1 yr. 7 268 59 334
3. Pptn. + MQW
628 mm; 1 yr. 130 425 65 620
4. Pptn. + MQW
915 nun; 1 yr. 192 495 96 783
5. PPtn. + LQWr
193 nun; I yr. I2 373 69 454
6. Pptn. + LQW
628 mm; 1 yr. 125 522 127 774
7. Pptn. + LQW
915 nun; 1 yr. 199 557 108 864 8. Pptn. + LQW
193 mm; 2 yr. I2 400 61 413
9. Pptn. + LQW
628 mm; 2 yr. I50 663 , 163 976 10. Pptn. + LQW
915 mm; 2 yr 136 701 212 1049
LSD .05 101 246 66 321
$tn. =_Precipitation QW - Medium Quality Water lLQW = Law Quality Water
treatments was accomplished by a Fisher’s protected LSD test at PI.05 (Steel and Tot-tie 1980).
Results and Discussion Vegetation Yield
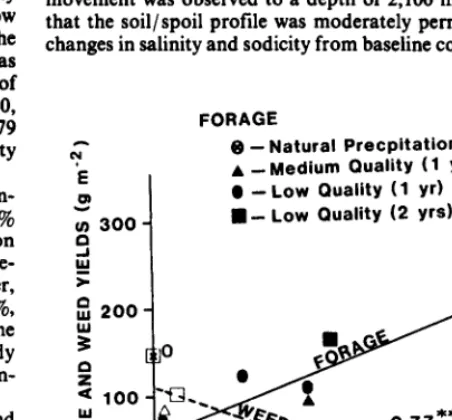
In 1977, forage yields were greater than the control on plots that received 382 or 697 mm of irrigation (water treatments 3,6,9 and 4, 7, 10, respectively, Table 7). No significant (pI.05) effect of water quality was observed (treatments 3 vs 6 and 9, and 4 vs 7 and 10). Vegetation yield was greatest for the year 1978. In 1978, yield was greater on plots that received 697 mm (treatment 7) of low quality water during 1977 and 391 and 728 mm (treatments 9 and 10) of low quality water during 1978 compared to the control. In 1979, the growing season when no irrigation was applied, forage yield was greater than the control on plots that received 773 and 1,425 mm of low quality irrigation water for 2 years (treatments 9 and 10, respectively). Forage yield was also greater than the control in 1979 on plots that had received 382 mm (treatment 6) of low quality water during 1977.
In 1977, stand composition, based on dry matter weight, con- sisted of 27% wheatgrasses, a trace of green needlegrass, 49% annual rye, 21% clover, and 3% weedy species. Composition changed in favor of the wheatgrasses (72%) in 1978. Green needle- grass was still present in trace amounts, while annual rye, clover, and weedy species were present at compositions of 5,3, and 20%, respectively. By 1979, no green needlegrass was present in the stands. Wheatgrasses composed 5% of the stands, while weedy species composed 41 TO. Kochia (Kochiu scoparia L.) was the dom- inant weed, making up 97% of the weedy species composition.
Total forage yield for 1977-79 was correlated with the 1977 and 1978 irrigation water applied. Yield differences between plots receiving the same quantity of medium and low quality water for one season were not significant (pS.05, Table 7). Figure 1 shows the relationship of total forage yield to total irrigation water added (r=O.93, significant ap1.01). This is important because the more
water added resulted in better stand establishment as shown by increased production of seeded forage species.
0 375 750 1125 1500
TOTAL WATER ADDED BY IRRIGATION (mm)
** Significant Ps.01
Fig. 1. Relationship of total seededforage yield (1977-79) to total woter added by irrigation during 1977 ond 1978.
seeded forage species and weed yields were significantly related to total water added by irrigation (~0.9 1 and r=O.77 @E.Ol, respec- tively). The relationship was positive for the forage species and negative for the weeds. Therefore, during 1979, both forage and weed yields still reflected water added above natural precipitation during 1977 and 1978. Stands receiving added water increased in yield of forage species and had fewer weeds. These data further show that the seeded forage species established more competitive stands when supplied with irrigation water, regardless of water quality. The annual weedy species were unable to compete with these more vigorous perennial forage species and thus showed a decrease in dry matter with increased irrigation water.
Ml/Spoil Changes
Water penetration on the precipitation only treatment was observed to a depth of 1,800 mm while on irrigated plots soil water movement was observed to a depth of 2,100 mm. This indicates that the soil/spoil profile was moderately permeable. Soil/spoil changes in salinity and sodicity from baseline conditions (Table 1,
FORAGE WEEDS
Q -Natural Precpitation -@I A -Medium Quality (1 yd- A 0 - Low Quality (1 yr) - 0 n - LOW Quality (2 yrs) -lJ
3;5 7io 1125 1500
TOTAL WATER ADDED BY IRRIGATION (mm)
**Significant Pn.01
The relationship of 1979 forage and weed yields with total water
DEPTH (mm)
O-100
100-210
210-360
360-510
510-600
DEPTH (mm)
O-100
100-2 10
2 10-360
360-S 10
510-060
TRT 1
(control)~
TRT 2EC;ctt
rf
TRT 4 TRT 5
TUT 6 TRT 7 TRT 8 TRT 9
-o+
-o+
TRT 10t9?1,1??1
f9?1,1?81
43Pl
-o+
lP?f f8?1 l?Sf 45?lJqP?4
wo+
_
+
Jk
.
TOPSOIL'\*
‘IY
\1
SPOIL 1 \
i i
i
r
I/
Rofor to Tablo I for water troatmontr.Y Bar Indlcatod LSD .OS for comparkonr botwoon troatmonta at oath depth.
Fig. 3. Changes in salinity (EC) level of soil/spoilprofiles from beginning of study (Spring 1977) to end of study (Fall 1979).
DEPTH (mm)
O-100
100-210
2 1 O-360
360-5 10
510-660
II
SODIUM ADSORPTION RATIOTRT 1 (conto TRT 2+ TRT 3+ TRT 4 TRT 5
+
-
+
6439348643
OQ4994?
o?46Fi4?“?4664?oQ46
2/
X \
‘\\
x\ X \
\ \
TOPSOIL”, \
\ /____________ 3( _ ____ _ ____ ;___ ____ ____* \ _.__________
\ , % SPOIL -q
+_ ______ _
.
TRT 6 TRT
+ - 7+ TRT 6 + - TRT 9 TRT 10
DEPTH ‘j
4 ? 044994p
(mm)
o-100- x\ X X X
\ \
100-2 10 _ ___A*; _________+_ _
-.
2 1 O-360 - ‘X
,’
360-510- X’
I
5 1 O-660 1 : r
i/Refer to Table 5 for water treatments.
‘Bar indicated LSD .OB for comparisons between treatments at each depth.
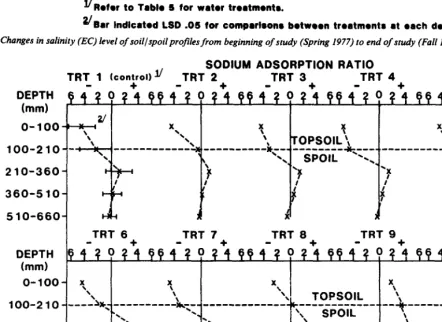
Fig. 4. Change in sodium adsorption ratio PAR) of the s&/spoil profile from beginning of St&y (Spring 1977) to end of study (Fall 1979).
Spring 1977) to the end of the study (Fall 1979) were used to assess the salinity and sodicity effect of different qualities and quantities of irrigation water. Significant changes (pI.05) in salinity and sodicity during the study were observed only to a depth of 660 mm. Compared to the control treatment, significant (pI.05) decreases in EC were observed at the 100 to 210 mm depth in plots receiving 697 mm (treatment 4 and 7) of either medium or low quality water added during 1977, but a significant (pI.05) increase in EC was observed at the 510 to 660 mm depth when 382 mm low quality water (treatment 6) was added during 1977 (Fig. 3). With a total of 773 mm low quality water (treatment 9) added in 1977 and 1978, a significant (PZ.05) increase in EC over the control plots was observed at the 210 to 360and 510 to 660mmdepths (Fig. 3). When 1,425 mm low quality water (treatment 10) were added in 1977 and 1978, a significant (pI.05) increase in EC was observed at the 210 to 360 mm depth (Fig. 3).
Compared to the control, SAR increased at the 210 to 360 mm depth from 382 mm low quality water (treatment 6) added in 1977 (Fig. 4). Increases in SAR were observed when low quality water was applied for 2 years. The plots that received 8 1 mm (treatment 8) showed decreased SAR at the 0 to 100 mm depth, and plots receiving 773 mm (treatment 9) showed increased SAR in the 0 to 360 mm soil/spoil zone (Fig. 4). The 1,425 mm low quality water (treatment 10) added in 1977 and 1978 increased SAR throughout the whole 0 to 660 mm soil/ spoil profile (Fig. 4).
The findings are consistent with those reported by Zartman et al. (1980) and Jury et al. (1980) from the use of blowdown water for irrigation. Changes in EC in our study are considered slight. The SAR increase was more pronounced than salinity increase and appeared to be primarily related to the low quality water applied in
1978.
Conclusion
Irrigation with low quality water improved perennial plant establishment as measured by production. In the growing season after irrigation was terminated, seeded forage yield was increased and weed dry matter decreased within stands established with supplemental irrigation compared to the stand established with precipitation only. Water quality had no effect on forage yield.
When low quality water was used for 1 year to supplement precipitation, changes in salinity and sodicity, evaluated by EC and SAR, were minor. When a total of at least 773 mm of low quality water was added over 2 growing seasons, EC increases were observed at the 210 to 360 mm depth and SAR increases at the 0 to 360 mm zone. Sodicity increased in the zone of 0 to 660 mm when
1,425 mm of low quality water were added over 2 years.
Results from this study indicate that, in well-drained spoils, low quality irrigation can be used to supplement precipitation for 1 to 2 seasons to establish forage stands. This appears to be an acceptable revegetation technique for disturbed areas of medium textures with moderately permeable soil profiles.
Literature Cited
Croft, M.C. 1974. Ground-water basic data for Adams and Bowman Counties, North Dakota. Bull 65-Part II. U.S. Geol. Surv. Bismarck, N.Dak..
Epstein, E., end J.D. Norlyn. 1977. Seawater-based crop production: a feasibility study. Science 197:249-25 1.
Gilley, J.E., C.W. Gee, and A. Bauer. 1976. Water quality of impound- ments on surface-mined sites. North Dakota Agr. Exp. Sta. Res. 3437-39.
Jury, W.A., H.J. Vaux, Jr., and L.H. Stolxy. 1980. Reuse of power plant cooling water for irrigation. Water Resour. Bull. 16830-836.
I&s, R.E. end A.D. Dey. 1978. Use of irrigation in reclamation in dry regions. p. 505-520. F.W. Schaller and Paul Sutton (ed.). In: Reclama- tion of Drastically Disturbed Lands. Amer. Sot. Agron., Madison, Wis. I&s, BE. 1980. Supplemental water for the establishment of perennial vegetation on strip-mined lands. North Dakota Agr. Exp. Sta. Res. 37:21-23.
Sandoval, F.M. end J.F. Power. 1977. Laboratory methods recommended for chemical analysis of mined-land spoils and overburden in western United States. Agr. Handb. 525, USDA. Washington, DC.
Strl, R.G.D. end J.H. To&e. 1980. Principles and procedures of statistics. McGraw-Hill Book Co. New York.
Thomas, J.R., F.G. Salioas, and G.F. Oerther. 1981. Use of saline water for
supplemental irrigation of sugarcane. Agron. J. 73:1011-1017. U.S. Salinity Laboratory Staff. 1954. Diagnosis and improvement of saline
and alkali soils. Agr. Handb. 60, USDA, Washington, D.C.