THE EFFECT OF DISRUPTIVE AND STABILIZING SELECTION
ON
THE EXPRESSION
OF
A CUBITUS INTERRUPTUS MUTANT IN DROSOPHILAW. SCHARLOO
Genetisch Laboratoriun der Rijksuniuersiteit, Leiden, The Netherlands
Received April 21, 1964
ISRUPTIVE and stabilizing selection are thought to play a n important role Din the organization of genetic variability in natural populations. Stabilizing selection (selection towards the optimal mean value of a measurable character) was supposed to be responsible for the relatively uniform appearance of the wild phenotype. However, different mechanisms were proposed by different authors. MATHER (1941, 1943) suggested that selection for an optimal mean value in a population would generate balanced combinations of polygenes in which plus and minus genes would alternate. SCHMALHAUSEN (1949) and WADDINGTON
(1942, 1957) stressed the advantage of a stabilized course of development, buffered against the normally occurring differences in genotype and environ- ment. On the other hand, disruptive selection (selection for different optimal values in one population) was supposed to be responsible for maintenance or increase of genetic and phenotypic variability, and even for polymorphism
(MATHER 1955). In experiments of KAMSHILOW (1939), RENDEL and SHELDON (1959) and WADDINGTON (1960) it was shown that selection against variation of mutant expression by environmental factors can change the effect of environ- mental differences.
THODAY ( 1959) demonstrated in experiments on sternopleural chaetae number that stabilizing and disruptive selection cause change in genetic variability. But in these experiments rather special kinds of selection pressure were used. Selection directly against change by the environment was practiced in KAMSHILOW’S and WADDINGTON’S experiments on mutant expression, and sophisticated breeding systems with separate high and low female and male lines were used in THODAY’S experiments on disruptive selection. Therefore, it seemed worthwhile to use what can be called simple disruptive selection and stabilizing selection on a mutant character. Simple disruptive selection means here that high and low individuals selected as parents of the next generation are mated together in one vial.
MATERIALS A N D METHODS
In these experiments the mutant cubitus interruptus dominant of Gloor (cia-G; SCHARLOO 1953) was used. It causes, like the original ci”, a terminal gap of the fourth wing vein, but it has a less extreme expression and an earlier temperature sensitive period. Moreover, while in ci’
there is a marked nonlinear relation between factors that change expression (SCHARLOO 1962) and expression. This relation is approximately linear i n ciD-0 (SCHARLOO 1964).
554 W. SCHARLOO
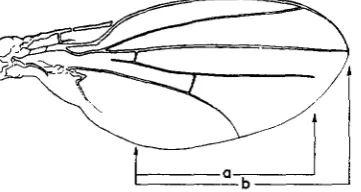
The expression of ciD-G can be measured as the percentage ratio of the part of the fourth vein present and the length of the third vein, both measured from the first cross-vein (Figure 1). Both wings of each individual were measured and the sum of the expression ratios of the two wings was used as the character selected for. This sum value is used as phenotypic value through- out this paper and the phenotypic variance and its components are the variances of this value. The mutant was introduced into the background of the Pacific wild population. This popu- lation was derived from a large number of wild flies and run for several years as a cage popu- lation (see ROBERTSON 1960). The mutant was introduced with the help of suitable marked stocks so that only one 4th chromosome with the mutants c i D - G and spapot (sparkling-poliert; STURTEVANT 1961) was introduced.
Because ciD-G is a recessive lethal it was held in heterozygous condition over a normal fourth chromosome. So wild-type individuals were segregating each generation.
Two selection lines were started. From four bottle cultures samples of 20 females and 20
males were measured. A stabilizing line was founded b y selecting from each sample the four animals with values nearest the mean value of their sample as parents of the next generation. For the disruptive line the two animals with the lowest values and the two animals with the highest values were selected from each sample. High and low females were placed together with high and low males in a single bottle so that random mating could occur. A circular mating system was used in both lines.
I n Generation 4, when the experiment was transferred from Edinburgh to Leiden, samples of 15 females and 15 males only were measured. After Generation 10 (G 10) the lines were maintained with three cultures and in the stabilizing line samples of ten were measured. The selected flies were allowed to lay eggs during 3 or 4 days in liter bottles in G 0 to G 4 and in % liter creamers from G 5 onwards.
FIGURE 1.-The expression of c P - G is measured as the percentage ratio of the length of the fourth vein (a) to the length of the third vein (b), both measured from the first cross-vein.
RESULTS
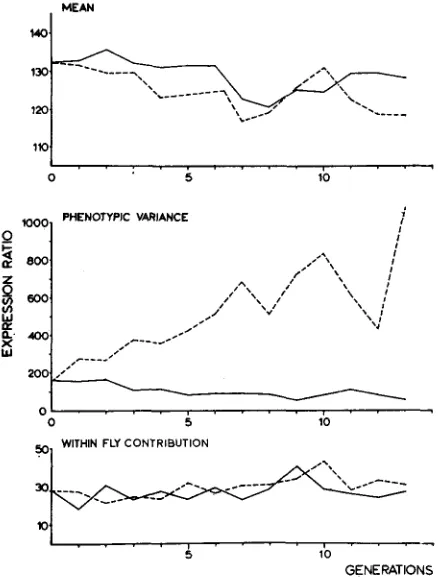
Mean ualues: In the top graph of Figure 2 mean values of both lines are shown
in the course of generations. Although the disruptive line shows a tendency to lower values than the stabilizing line, there is no systematic change, and the difference is, of course, negligible when compared with the differences obtained by the same number of generations of directional selection.
Phenotypic variance: In terms of phenotypic variance (middle graph Figure 2)
S E L E C T I O N A N D G E N E EXPRESSION
555
MEAN
4
lmom
5 10; PHENOTYPIC VARIANCE
I
2W/'
0 - ,
. .
. 9 . . ,.
1 1 .0 3 10
WITHIN FLY CONTRIBUTION
"
-
3 loGENE RATIONS
FIGURE 2.-Mean expression ratio, phenotypic variance, and the within-fly variance contribu- tion in the course of generations. Broken lines represent the disruptive line, and full lines the stabilizing selection.
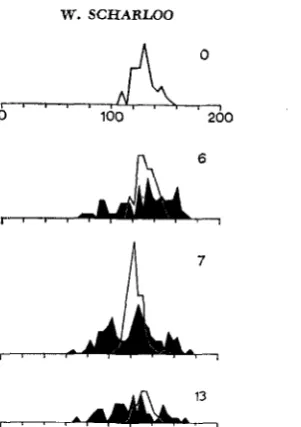
I n the stabilizing line there is not much further progress; in the last generation of selection (G13) the variance is about 1/3 the variance of the base population. In Figure 3, frequency distributions of the base population, and of both selec- tion lines at G6, G7 and G13 are shown. In the disruptive line, the range of the base population is increased at both sides of the mean, and in the stabilizing line there is a contraction of the range at both sides.
I t is relevant to mention here that the value of the phenotypic variance of c P G
expression in the Pacific background was reproduced with good accuracy on several occasions. At the start of the experiment (summer 1962) a phenotypic variance of 157.4 ( n = 160) was found, later independent introductions revealed values of 142.4 ( n = 120; coinciding with GlO), and of 156.7 and 147.1 in 1964
( n = 120 in both cases, results of MISS A. TER KUYLE).
Within-fiy variance: The contribution of the within-fly variance (independent
556 W. SCHARLOO
FIGURE 3.-Frequency distributions of females in the base population (80 females measured), and the seIection lines in G6 (in both lines 80 females measured), G7 (1 00 females in each line), and G13 (disruptive line 60 females, stabilizing line 30 females).
that the level of the within-fly contribution does not change throughout the experiment
.
Heritability and composition of the phenotypic variance: With the purpose of
obtaining more insight into the causes of the change in phenotypic variance a progeny test was performed on the base population, and on the stabilizing and disruptive selection lines in G6. At such an early stage in the selection experi- ment the effects of selection are probably not yet disturbed by inbreeding.
The progeny test was performed with positive assortive mating as recom- mended by REEVE (1953). From the progeny of each pair at least four females and four males were measured. The number of pair matings was 30, 31 and 37
for the base population, the stabilizing line and the disruptive line respectively. Heritabilities were computed as the regression of the mean values of progenies on the midparent values.
The results of the progeny tests and a separation of phenotypic variability into its components is given in Table 1. I n addition the values of total variability and the within-fly contribution at the end of the experiment are shown.
The second line in the table shows the heritability values. For the base popu- lation an additional estimate is available from an experiment with divergent directional selection during four generations. In this case the heritability (value in brackets), was computed as the regression of advance on the cumulated selec- tion differential (FALCONER 1954). Both estimates are in good agreement. I n the analysis of phenotypic variability only the first estimate was used because it was obtained by the same method as used for the disruptive and stabilizing line.
TABLE 1
Phenotypic variances and their composition in the base population ( B ) , and in the disruptive ( D ) and stabilizing ( S ) selection lines
B D D S S
GO Gb G13 GG G13
Phenotypic variance 157.4 510.9 1099.9 91.2 57.0
Heritability 0.58 t 0.11 0.88 t 0.06 0.50 +- 0.06
Additive genetic variance 91.3 449.6 45.6
Within-fly contribution 28.2 26.8 30.7 29.7 27.1
Residual variance 37.9 34.5 15.9
(0.62 k 0.04)
contribution from the phenotypic variance, a residual component is obtained. This residual variance sets a maximal value for the environmental variance. From these figures it will be obvious that the gross increase in phenotypic vari- ance in the disruptive line must be explained by the fivefold increase of the additive genetic variance. Both the within-fly variance and the residual variance are not changed compared with the values of the base population.
In the stabilizing line, the genetic variance is only half the original value. This is responsible for the larger part of the decrease in phenotypic variance. But while the within-fly variance did not change here either, the residual variance has decreased to half its original value. This suggests a decreased sensitivity to environmental differences.
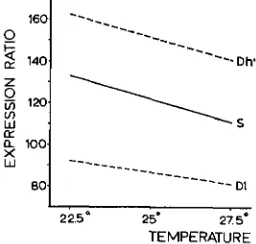
Temperature experiments: The stabilizing line was compared with the dis- ruptive line and the base population respectively, in separate tests. At G7 the stabilizing line and the disruptive line were compared at temperatures of 22.5" and 27.5"C (Figure
4).
For this purpose the disruptive line was divided in a high and a low part by mating high and low individuals separately. This procedure should decrease the within-culture variance and show possible differences in temperature reaction between high and low animals. At each temperature two bottle cultures were reared and 20 females from each bottle were measured.1
I ,
22.5' 25' 27.5'
TEMPERATURE
558 W. SCHARLOO
-3
160
t
150 -
0 140-
I- 4
[L
2 1m-
s
2
120-1:
110- [L a20' 225' 25' 225'
TEMPERATURE
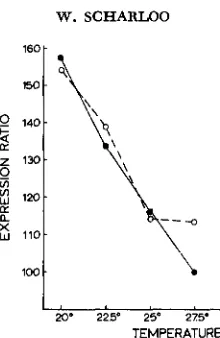
FIGURE 5.-Temperature reactions of the base population (broken line) and the stabilizing line (full line) in Generation 13. Each point is based on measurement of 60 females. Further explanation in text.
This experiment shows similar temperature reactions in all groups of flies and no indication for a smaller sensitivity for temperature differences in the stabiliz- ing line.
A
larger test comparing the stabilizing line with the base population was done at the end of the selection (Figure 5 ) . Vial cultures with a constant population density of 60 larvae were reared at temperatures of 20°, 22.5", 25" and 27.5"C. I n this test the stabilizing line does not show a smaller sensitivity either.Genetic analysis: As a first step in the analysis of the differences in the dis- ruptive line, reciprocal crosses were made between high and low lines obtained from the disruptive line by one generation of directional selection from G12. In Table 2 it is shown that there are no significant differences between the reciprocal crosses, which could indicate cytoplasmic differences or differences located on the
X
chromosome.For the second and third chromosome a crude localization was tried by crossing high females and low females respectively (from G8) with a stock containing dominant markers, and backcrossing the F, males with individuals (from G9) of the same phenotype as the female parents. The results of the introduction of the
TABLE 2
Reciprocal crosses between high and low lines obtained b y one generation of
divergent directional selection from GI2 of the disruptive line
Females Males
Disruptive H 160.7 160.1
Disruptive L 90.5 87.3
Disruptive L x Disruptive H
Disruptive H x Disruptive L
110.2 f 1.4 117.6 f 3.6
105.6
*
1.5107.3 t 2.1
SELECTION A N D G E N E EXPRESSION
TABLE 3
Introduction of marked second chromosomes (with Plum, Pm) and third chromosomes (with Stubble; Sb) in extreme high and extreme
low genotypes of the disruptiue selection line
+
Pm Sb Pm; SbDisruptive L 98.3 114.1 100.8 113.1 Disruptive H 158.5 137.7 160.1 141.1
Edch figure is based on measurement of 40 individuals ohtained from four cultures.
marked chromosomes are shown in Table 3. They are consistent for both the low and high animals in that substitution of a marked 3rd chromosome does not affect expression. But in both cases there are marked influences of the second-chromo- some introduction. Although only recessive effects can be shown by this method, this result suggests that genetic differences on w e chromosome only are respon- sible for the increased variance in the disruptive line.
DISCUSSION
From this experiment it is clear that disruptive and stabilizing selection on this mutant character cause rapid change in variances. The increase in the dis- ruptive line is a consequence of an increase in additive genetic variance. This can be caused by bringing the frequencies of the genes to the 50 percent point, by recombination of plus and minus genes in repulsion linkage as suggested by MATHER (1941) or by an increase of the segregation effect of heterozygous pairs of alleles by changing the genetic background (ROBERTSON and REEVE 1952).
The analysis presented here does not permit a conclusion on this point, but sug- gests a rather simple genetic situation behind the differences in the disruptive line.
Increase in additive genetic variance by disruptive selection is also reported by
THODAY
(1959) and by MILLICENT andTHODAY
(1961) for sternopleural chaeta number. However, the intricate breeding systems with “migration” of selectedindividuals from the high to the low part of his lines and vice versa, the low heritability (h2=0.15) in his base population and the small population size makes evaluation of the significance of THODAY’S results difficult.
560 W. SCHARLOO
Although the kind of selection practised in our experiments would favour tendencies to mating preference, no indication for incipient isolation between the high and low animals of the disruptive line is found in our experiments. The reciprocal crosses did not meet any difficulties and in the frequency distributions of the disruptive line no deficit of intermediate individuals can be seen. But this is not surprising in view of the small number of generations in our experiment and the long time necessary to build up mating preferences in experiments especially designed for this purpose (WALLACE 1954; KNIGHT, ROBERTSON and WADDINGTON 1956).
A
decrease in phenotypic variance of stabilizing lines as a consequence of a decrease in additive genetic variance is reported by THODAY (1959) for sterno- pleural chaeta number, and by PROUT (1962) for duration of development. This result could be obtained by several mechanisms, e.g. increase in homozygosity (ROBERTSON 1956), building of repulsion linkages ( MATHER 1941 ) and a decrease of the effect of segregating heterozygous loci by a change of the genetic back- ground (ROBERTSON and REEVE 1952).I n our experiments, in addition to the decrease of the additive genetic variance there was a decrease of the residual variance suggesting a smaller sensitivity to environmental differences occurring in the culture bottles. But this is not a consequence of an increased general buffering ability because sensitivity to temperature differences has not changed.
I t is relevant to mention here that the increase in environmental variance found by
PROUT
(1963) in his disruptive line also did not go along with increased sensitivity to temperature. This seems to contradict results of RENDEL and SHELDON (1959) where selection against variability in the scute mutant caused a decrease of both the within-culture variability of scute and its temperature sensitivity. But in this case selection was performed against variability within progenies of one pair and is not strictly comparable with our experiments.THODAY (1959) and MILLICENT and
THODAY
(1961) obtained an increase in asymmetry of sternopleural chaeta number by disruptive selection and conclude that this kind of selection can pick out “developmental unstable” genotypes. In our experiments, which involve a smaller number of generations, asymmetry is virtually constant. Although the within-fly variance contributes an appreciable part to the phenotypic variance, its constancy is not surprising in view of the results of MISS A. TER KUYLE, who showed that selection for asymmetry does not have an immediate effect on the within-fly variance.I t was mentioned in the introduction that in the experiments of KAMSHILOW (1939) and WADDINGTON (1960) selection practised directly against the effect of environmental differences on mutant expression was effective.
561
nance of uniformity of the normal phenotype and the preservation of genetic variability behind this uniformity.
This work was started during the tenure of a N.A.T.O. Science Fellowship awarded to the author by the Netherlands Organisation for the Advancement of Pure Research (Z.W.O.). I wish to thank PROFESSOR C. H. WADDINGTON (Edinburgh) for hospitality in his Institute, and DR.
F. W. ROBERTSON (Edinburgh) and PROFESSOR R. C. LEWONTIN (Rochester) for useful discussion. Further, thanks are due to DR. K. BAKKER (Leiden) for a critical reading of the manuscript, to MISS CHOUW LANG CHUNG and MISS MARIJKE TILSTRA for technical assistance, and to MR. C. ELZENGA and MR. J. SIMONS, for preparing the figures.
SUMMARY
Disruptive and stabilizing selection were practised on the expression of the mutant cubitus interruptus dominant of Gloor (ci""). The increase of the pheno- typic variance in the disruptive line was caused by an increase of the additive genetic variance, while the environmental variance and the within-fly variance did not change. The decrease of the phenotypic variance in the stabilizing line was caused by a decrease of the genetic variance and the environmental variance. The decrease of the environmental variance was not a consequence of a n increase in a general buffering ability as the sensitivity of ciD-O expression to temperature did not change. The difference between extreme high and low individuals of the disruptive line is, at least predominantly, located on the second chromosome.
L I T E R A T U R E C I T E D
FALCONER, D. S., 1954 Asymmetrical response in selection experiments. Symp. Genet. Popu- lation Struct. (Pavia) pp. 17-41. - 1960 Introduction to Quantitatiue Genetics.
Oliver and Boyd, Edinburgh.
Selection as a factor alternating the dependence of a character on variations in environmental conditions. Compt. Rend. (Dokl.) Acad. Sci. U.R.S.S. N.S., 23: 326-365.
Selection for sexual isolation KAMSHILOW, M. M., 1939
KNIGHT, G. R., A. ROBERTSON, and C. H. WADDINGTON, 1956
MATHER, K., 1941
within a species. Evolution 10: 14-22.
Variation and selection of polygenic characters. J. Genet. 41: 159-193.
- 1943 Polygenic inheritance and natural selection. Biol. Rev. 18: 32-64.
-
1955 Polymorphism as an outcome of disruptive selection. Evolution 9: 52-61.Effects of disruptive selection. IV. Gene flow and divergence. Heredity 16: 199-21 7.
The effects of stabilizing selection on the time of development in Drosophila melanogaster. Genet. Res. 3: 364-382.
-
1963 The effects of a history of stabilizing selection on sensitivity to foreign environments. (Abstr.) Proc. 11 th Intern. Congr. Genet.1: 165.
R.EEVE, E. C. R., 1953 Studies in quantitative inheritance. 111. Heritability and genetic correla- tion in progeny tests using different mating systems. J. Genet. 51 : 520-541.
REEVE, E. C. R., and F. W. ROBERTSON 1954 Analysis of environmental variability in quantita- tive inheritance. Nature. 171 : 874.
RENDEL, J. M., and B. L. SHELDON, 1959 Selection for canalization of the scute genotype in MILLICENT, E., and J. M. THODAY, 1961
PROUT, T., 1962
5
62 W. SCHARLOOROBERTSON, A., 1956 The effect of selection against extreme deviants based on deviation or on
homozygosis. J. Genet. 54 : 236-248.
The ecological genetics of growth in Drosophila. I. Body size and developmental time on different diets. Genet. Res. 1 : 228-304.
Studies in quantitative inheritance. I. The effects of selection on wing and thorax length in Drosophila melanogaster. J. Genet. 50: 414-448.
The effect of selection and temperature on a mutant character (ci') in Drosophila. Arch. Neerl. Zool. 14: 433-511. - 1963 ci'-", cubitus interruptus dominant of Gloor. Drosophila Inform. Serv. 38: 32. ~ 19M Mutant expression and
canalization. Nature (in press). ROBERTSON, F. W., 1960
ROBERTSON, F. W., and E. C. R. REEVE, 1952
SCHARLOO, W., 1962
SCHMALHAUSEN, I. I., 1949 STURTEVANT, A. H., 1961 THODAY, J. M., 1959
THODAY, J. M., and J. B. GIBSON, 1962 WADDINGTON, C. H., 1942
Factors of Euolution. Blakiston, Philadelphia.
spapol, sparkling poliert. Drosophila Inform. Serv. 35: 47.
Effects of disruptive selection. I. Genetic flexibility. Heredity 13: 187-218.
Isolation by disruptive selection. Nature 193: 1164-1166. Canalization of development and the inheritance of acquired char- acters. Nature 150: 563-565. - 1957 The Strategy of the Genes. Allen and Unwin. London. - 1960 Experiments on canalizing selection. Genet. Res. 1 : 1M-150.
Genetic divergence of isolated populations of Drosophila melanogaster. Proc. 9th Intern. Congr. Genet. (Caryologia Suppl. Vol.) 761-764.