STUDIES ON THE FREQUENCIES OF CHROMATID ABERRATIONS INDUCED BY X RAYS AT DIFFERENT TIMES OF THE
CELL CYCLE OF VICIA FABA
J. GRANT BREWEN
Biology Diuision, Oak Ridge National Laboratory,l Oak Ridge, Tennessee
Received February 13, 1964
T has been known for some time that there are differences in the radiation-
I
induced chromosomal aberrations observed at metaphase, according to the stage of the cell cycle the cells were in at the time of irradiation (SWANSON 1957). The observed differences are not only quantitative (changes in frequency per cell), but are also qualitative in that, depending on the stage and the chromosomal stmc- tural unit involved, three different classes of aberrations can be induced. In the pre-DNA-synthesis stage (GI) of interphase, chromosome aberrations are induced. These involve the single, pre-split chromosome. During the DNA-synthesis (S)and post-DNA-synthesis (G,) periods of interphase, chromatid aberrations are induced. These aberrations involve the double, post-split chromosomes. During prophase subchromatid aberrations that presumably involve half-chromatids are formed. I n addition to these, two different groups of aberrations (one-break and two-break) are observed; these vary with respect to the kinetics of their induction. With sparsely ionizing radiations, one-break aberrations result from single ioniz- ing clusters and show a linear increase with dose, whereas two-break aberrations involve the interaction of breaks that are produced by two independent ioniza- tions (or clusters) and increase approximately as the square of the dose (see reviews by WOLFF 1961; EVANS 1962).
In the GI cells the chromosome has been found to exhibit constant sensitivity to radiation-induced breakage (see SAX 1938), whereas as the cell approaches metaphase the sensitivity changes and the frequency of chromatid aberrations increases (see SWANSON and SCHWARTZ 1953). Very close to metaphase the sensitivity drops (WOLFF and LUIPPOLD 1960). EVANS and SAVAGE (1963) and EVANS and SCOTT (1964) have attempted to find the relationship between the changes in sensitivity that occur when chromatid aberrations are induced and the stage of the cell cycle. They have shown that at the onset of S the sensitivity of the chromosome to breakage doubles and then increases slightly through S
until G,, when another increase in sensitivity is observed. Since the aberrations induced during S and subsequently scored at metaphase are chromatid aberra- tions, they have suggested that the apparent gradual increase in sensitivity through S is probably caused by an increase in the number of doubled chromo- somes produced as S progresses, and not to an actual increase in the sensitivity of the chromosome material during this period.
1 Operated by Union Carbide Corporation for the United States Atomic Energy Commission
In regard to the apparent increase in sensitivity that occurs between GI and S, WOLFF (1961 ) has pointed out that this may only be a reflection of the method used to score aberrations. When chromosomal aberrations induced in GI are scored, only asymmetrical exchanges (dicentrics) and rings are scored as two-hit aberrations; this is because the symmetrical exchanges are impossible to score accurately. When chromatid aberrations induced in S and G, are scored, how- ever, both asymmetrical and symmetrical exchanges can be scored accurately because sister-strand attraction makes it possible to classify each type unequivo- cally. In addition, many breaks that are induced in pre-split chromosomes nor- mally restitute and so do not form visible aberrations. When induced in post-split chromosomes, however, these breaks are able to undergo sister-chromatid rejoin- ing and form scorable isochromatid aberrations ( WOLFF 1961 ) .
Although the above changes can contribute to the difference between cells irradiated in G, and S, the increase in the frequency of aberrations from S to G,
as observed by EVANS and SAVAGE (1963) and EVANS and SCOTT (1964) cannot be attributed simply to such a bias in scoring, in that chromatid aberrations are induced in both stages. I t seemed probable that such an increase would be expli- cable on the site hypothesis of WOLFF and ATWOOD (see WOLFF, ATWOOD, RAN- DOLPH~ and LUIPPOLD 1958; WOLFF 1959). They have suggested that in the
nucleus there is a limited number of sites available within which the broken ends of chromosomes can interact to form exchanges. GARCIA-BENITEZ and WOLFF
(1962) have found that the number of sites appears to increase in G,.
The present experiments were designed to determine if the change in yield of aberrations induced as the cell proceeds from S to G, is actually caused by a change in the sensitivity of the chromosomes to ionizing radiation or a change in the probability of the interaction of broken ends to form aberrations observable at metaphase, as would be expected on the site hypothesis.
MATERIALS A N D METHODS
Seeds of Vicia faba were soaked in tap water for 24 hours, the seed coats peeled, and the beans grown according to the method of GRAY and SCHOLES (1951). When the primary roots attained a length of 3 to 4 cm, the meristem was cut off and the beans were skewered on a stick and grown with their roots immersed in continuously aerated spring water. Lateral roots appeared within 3 to 4 days and were allowed to grow until they reached a length of about 1 cm. At this point the roots were placed in a solution of 5-amino uracil (5-AU) at a concentration of 750 ppm. SMITH, FUSSEL and KUGELMAN (1963) have shown that if the beans are left in 5-AU for 24 hours the mitotic index falls to zero. If the roots are then removed and washed thoroughly, the mitotic index will rise from zero to a peak in which approximately 40 to 50 percent of the cells are observed in metaphase. They believe the synchronization is caused by a 5-AU induced block of DNA synthesis (S). The cells in G,, G,, and mitosis are thought to continue through the cell cycle until they reach S. The cells are, therefore, all more or less in the same stage of the cell cycle and so upon removal of the 5-AU will proceed fairly synchronously to metaphase.
X-RAY-INDUCED CHROMATID ABERRATIONS 103
ated with Wr of X rays at 50r/min from a General Electric Maxitron X-ray machine operated at 250 kvp and 30 ma with 3 mm aluminum filtration added (Hvl = 0.46 mm CU).
After irradiation lateral roots were tested periodically to determine when the majority of the cells in the meristem were entering prophase. This was done by heating a root tip in nine drops
of aceto-carmine and one drop of normal HC1 and then making a temporary aceto-carmine squash preparation. Nine and one-half hours after removal from 5-AU the test showed that the cells were entering prophase, and at this point the remainder of the lateral roots were placed in a solution of 0.2 percent colchicine for 2 hr to accumulate metaphases. The root tips were then fixed and stained according to the method of C. E. FORD, i.e., fixed with a modification of Flem- ming’s fixative, bleached in ammonium oxylate and hydrogen peroxide, hydrolyzed in 1 N HC1, and stained with Feulgen (see WOLFF 1963, for details).
Autoradiographs were prepared by dipping several slides of both the irradiated roots and the unirradiated control roots from each interval in Kodak Nuclear Track Emulsion, Type NTB. These slides were dried, exposed for 10 days, developed in Kodak D-19 Developer for 2 min, washed, fixed in Kodak Acid Fixer and then made permanent by passing through an alcohol series to 100 percent alcohol and mounting with euparal. These slides were scored only for the presence or absence of label in the metaphase chromosomes. On the other slides from the same intervals, terminal deletions, isochromatid deletions, and chromatid exchanges were scored as aberrations. Achromatic lesions, or “gaps,” were not scored.
RESULTS
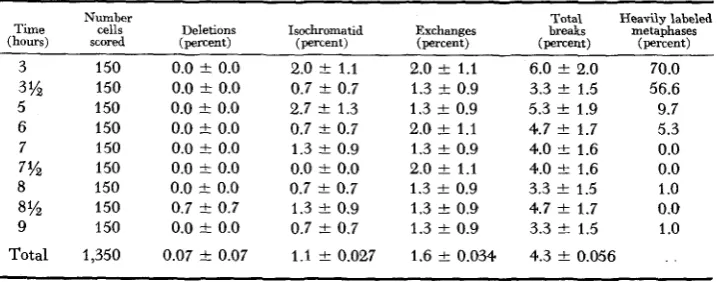
Tables 1 and 2 summarize the results obtained in the irradiated roots and the control roots. It may be seen that when cells are treated 3 hours after removal from 5-AU, the subsequent peak of mitosis contains more than 70 percent of heavily labeled cells. This indicates that at 3 hours the majority of the cells that would appear in the peak were in S. The frequency of labeled mitoses falls stead- ily with increasing time between removal from 5-AU and exposure to tritiated thymidine. This indicates that over the time span represented in the tables the cells progress from S to mitosis. By 7 hours only an occasional cell was labeled, showing that all the cells to be observed in the peak were in G,. The major part of the transition occurred between 3.5 and
5
hours.It should be noted that although only 70 percent of the cells observed at 3 hours
TABLE 1
Control chromatid aberrations at various times after remoual from 5-amino uracil
Time (hours) Number cells scored 3 3% 5 6 7 8 9 7% 8% Total 150 150 150 150 150 150 150 150 150 1,350
0.0 f 0.0 0.0 f 0.0 0.0 f 0.0 0.0 f 0.0 0.0 F 0.0 0.0 F 0.0
0.0 f 0.0 0.7 5 0.7
0.0 f 0.0
0.07 f 0.07
2.0 t 1.1
0.7 t 0.7 2.7 t 1.3 0.7 t 0.7 1.3 f 0.9 0.0 f 0.0 0.7 f 0.7 1.3 f 0.9 0.7 f 0.7 1.1 f 0.027
Exchanges (percent)
2.0 f 1.1 1.3 f 0.9 1.3 f 0.9 2.0 f 1.1 1.3 f 0.9 2.0 f 1.1 1.3 f 0.9 1.3
*
0.9 1.3 f 0.9 1.6 f 0.034Total breaks (penent)
6.0 t 2.0
3.3 t 1.5 5.3
*
1.9 4.7 f 1.7 4.0 +- 1.6 4.0 f 1.6 3.3 f 1.5 4.7 f 1.7 3.3 -+ 1.54.3 f 0.056
TABLE 2
Irradiation-induced chrcnrnatid aberrations at uarious times after removal from 5-0mino uracil
Time (hours)
Number cells
scored Deletions (percent) Isochromatid (percent) Exchanges (percent)
3 3% 5 6 7 7% 8 8% 9 300 200 300 300 300 300 300 300 250
1.0 t 0.6 1.0 t 0.7 1.7 i 0.7 0.3 t 0.3 3.0 i 1.0 4.7 t 1.2 3.0 t 1.0 3.7
*
1.1 1.6 i 0.85.3 t 1.3 4.0 & 1.4 5.7 t 1.4 5.3 & 1.3 5.0 -C 1.3 3.3 I 1.1 6.0 I 1.4 4.7 I 1.2 2.4 i- 1.0
2.0 i 0.8 4.0 t 1.4 7.3 t 1.6 9.7 i 1.8 8.0 & 1.6 8.3 F 1.7 8.7 F 1.7 11.0 t 1.9 5.6 i 1.5
One bit (percent)
6.3 t 1.5 5.0 t 1.6 7.3 +- 1.6 5.7 t 1.4 8.0 i 1.6 8.0 & 1.6 9.0 t 1.7 8.3 i 1.7 4.0 t 1.3
Heavily labeled Breaks metaphases (percent) (percent)
10.3 t 1.9 71.0 13.0 & 2.6 58.0 22.0 i 2.7 11.7 25.0 F 2.9 6.0 24.0 t 2.8 24.7 i 2.9 0.3 26.3 & 3.0 0.0 30.3 I 3.2 0.0 15.2 f 2.5 1.0
are heavily labeled when they reach metaphase, probably considerably more than 70 percent of the cells were in S at this time. The reasons for this are: (1 ) In addition to the 70 percent of heavily labeled cells, some 15 to 20 percent were very lightly labeled. i.e., had less than 10 grains/nucleus and were scored as un- labeled; and (2) those cells in late S at the time of treatment would not be ex- pected to pick up enough label to give a positive autoradiograph under the present experimental conditions.
On the other hand, the peak should not consist entirely of cells from the S
period. WOLFF and LUIPPOLD (personal communication) have found that 5-AU blocks not only S, but also early G,. At the time of removal from 5-AU, therefore, there would be some cells from G, in the roots. In addition, it would be expected that cells which were in late S at the time of the addition of 5-AU would move from late S into G, during the course of the 3 hours between the removal of the roots from 5-AU and the first treatment.
Since the labeling pattern in the control cells (Table 1 ) is the same as in the irradiated cells (Table 2)
,
it may be concluded that if the cells are given a low dose of 25r and the metaphases are accumulated in the peak by treating the beans with colchicine, there is no mitotic delay that changes the relative number of cells from the various parts of the cell cycle in the peak.X-RAY-INDUCED CHROMATID ABERRATIONS 105
DISCUSSION
The data show that as the cell progresses from S to G, the frequency of observed aberrations increases by a factor greater than two. Although in the present data this increase takes place over a period of from 1 to 2 hours, it is possible that the shift is a sudden one. This is because the cells scored in these experiments were collected by colchicine over a 2-hr period, and therefore at the 3.5 and 5-hr inter- vals cells that were in both S and G, at the time of irradiation were scored at the subsequent metaphase. Unfortunately, uncolchicined metaphases of Vicia faba
are impossible to score accurately because the chromosomes are not well con- tracted and there is considerable overlapping. Similarly, visibly labeled cells from autoradiographs are also difficult to score accurately because of the overly- ing silver grains. Therefore aberrations and labeling patterns were obtained from separate slides.
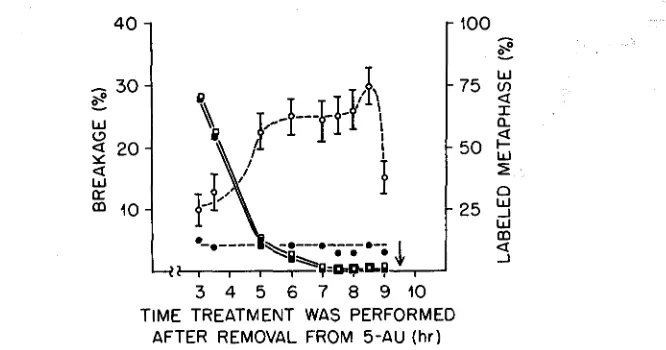
The duration of G,, as estimated from the time between the disappearance of labeled metaphases and the onset of prophase (Figure l ) , is found to be 4.5 to 5 hours. This agrees well with EVANS and SCOTT’S determination (1964) in the primary roots of Vicia faba. The sudden decrease in observed aberrations as the cell leaves G, and enters mitosis also agrees with the results of EVANS and SAVAGE
(1963), EVANS and SCOTT (1964), and WOLFF (1960).
If the observed increase in aberration production as the cells progress from S
to G, were a result of increased sensitivity of the chromosome strand to the X rays, then the frequency of all types of aberrations would increase. It is observed, how- ever, that this is not the case. The frequency of one-break aberrations remains relatively constant, with only minor fluctuations, from S through G,, whereas
40
1
r
loo2
~ - 7 5
-50
5
2i
0
- 2 5
?
W
m a
-I
I a
3 4 5 6 7 8 9 10 TIME TREATMENT WAS PERFORMED
AFTER REMOVAL FROM 5-AU (hr)
FIGURE 1.-The relation bstween frequency of aberrations and time of cell cycle the treatment was given is shown here. 0 - - - 0 aberrations observed after 24 hours of 5-AU, Ha-thymidine, and 25r of X rays; - - - aberrations observed after 24 hours of 5-AU and H3-thymidine; 0-0 labeled metaphases after 24 hours of 5-AU, H3-thymidine, and 25r of X rays; B-¤
the frequency of two-break aberrations increases by a factor greater than four. While the frequency of terminal deletions is higher in G,, the increase is not significant because of the small numbers observed. Therefore, it appears that the observed increase in aberration production in G, can be explained by an increase in the number of sites for exchange. Such an increase in site number in G, cells as compared to G, cells was found by GARCIA-BENITEZ and WOLFF (1962) to occur in Vicia faba.
WOLFF
(1961) has hypothesized that the increased yield in aberrations observed after the chromosomes split, i.e., the increase in yield from GI to S, comes from an increased number of places where chromosomal strands are within the rejoining distance of one another. The main increase would come from sister chromatids that, if broken, could rejoin to form isochromatid deletions. After the chromosomes are already split, however, any increase that now occurs in site number is expected to affect exchanges and not isochromatid deletions. EVANS and SAVAGE (1963) and EVANS and SCOTT (1964) have noted that the yield of exchanges in G, cells is higher than that in S cells, indicating that the number of exchange sites can increase as the cell proceeds from S to G,. The present data show just such a relationship and support the view that the increased yield of aberrations observed in cells irradiated in G, are a result of an increase in the number of sites at which an exchange can be formed. [The similarity between the present data and that of EVANS and SAVAGE (1963) and EVANS and SCOTT (1964) indicates that the 5-AU is not modifying the results.]Figure 1 shows that there is a slight increase in the number of aberrations observed at the 8.5 hr interval after removal from 5-AU. Although the slight in- crease observed at the end of G, (8.5 hr point) is not significantly higher than any other point in G,, the possibility exists that the increase is real and reflects another change in site number as the chromosomes contract and spiralize. The decrease in aberration production at the time the cell enters mitosis (9-hr point) occurs for all types of aberrations, although the number of one-break aberrations is not significantly different from the number at 8.5 hours. From these observa- tions it can be postulated that there is probably a decrease in the site number as the cell enters mitosis. PARKER (1963) has noticed such a decrease in sites in Drosophila oocytes when the synapsed chromosomes of stage 7 oocytes separate and proceed to diakinesis (stage 14). The present evidence is not critical enough, however, to distinguish between the possibility of a decrease in site number and a possible decrease in the chromosome’s sensitivity to X rays.
SUMMARY
X-RAY-INDUCED CHROMATID ABERRATIONS 107
tions, the frequency of one-break aberrations remaining constant from S through
G,. It is concluded from these data that the increase in aberration yield as the cells go from S to G, is the result of an increase in the number of sites within which an exchange can occur, and not of an increase of the sensitivity of the chromosome strands to X rays. In very late G, or early prophase a sudden de- crease in aberration yield occurs. This is interpreted as a decrease in the number of sites and also a possible decrease in the sensitivity of the chromosome strand to
X
rays, since both one- and two-break aberrations decrease in frequency,L I T E R A T U R E CITED
EVANS, H. J., 1962 Chromosome aberrations induced by ionizing radiation. Intern. Rev. Cytol.
EVANS, H. J., and J . R. K. SAVAGE, 1963 The relation between DNA synthesis and chroniosome structure as resolved by X-ray damage. J. Cell Biol., 18: 525-544.
EVANS, H. J., and D. SCOTT, 1964 Influence of DNA synthesis on the production of chromatid aberrations by X rays and maleic hydrazide i n Viciu faba. Genetics 49: 17-38.
GARCIA-BENITEZ, C., and S. WOLFF, 1962 On the increase of sites for chromosome exchange formation after chromosome duplication. Science 135 : 438-439.
GRAY, L. H., and M. SCHOLES, 1951 The effect of ionizing radiations on the broad bean root. Brit. J. Radiol. 24: 348-352.
PARKER, D. R., 1963 On the nature of sensitivity changes in oocytes of Drosophila melanogaster.
pp. 11-31. Repair from Genetic and Radiation Damage and Differential Radiosensitivity in Germ Cells. Edited by F. H. SOBELS. Fergamon Press, London.
Induction by X-rays of chromosome aberrations in Tradescantia microspores. Genetics 23: 484-516.
Partial synchronization of nuclear divisions i n root meristems with 5-aminouracil. Science 142 : 595-596.
13: 221-321.
SAX, K., 1938
SMITH, H. H., C. P. FUSSEL, and B. H. KUGELMAN, 1963
SWANSON, C. P., 1957
SWANSON, C. P., and D. SCHWARTZ, 1953
WOLFF, S., 1959
Cytology and Cytogenetics. Prentice Hall, Englewood Cliffs, N.J. Effect of X-rays on chromatid aberrations in air and in nitrogen. Proc. Natl. Acad. Sci. U.S. 39: 1241-1250.
Interpretation of induced chromosome breakage and rejoining. Radiation Res. Supp. I, 453-462. __ 1961 Radiation genetics. pp. 419-475. Mechanisms in Radio- biology, Vol. I. Edited by M. ERRERA, and A. FORSSBERG. Academic Press, New York. -
1961 Some postirradiation phenomena that affect the induction of chromosome aberrations. J. Cell. Comp. Physiol. 58 Suppl. 1: 151-162. __ (In press) Handling of root tips.
Mechanisms of Cell Physiology. Edited by D. M. PRESCOTT. Academic Press, New York.
Factors limiting the number of radiation-induced chromosome exchanges. I. Distance: Evidence from non-inter- action of X-ray- and neutron-induced breaks. J. Biophys. Biochem. Cytol. 4: 365-372.
On the apparent synergistic effect of far-red and X r a y in the production of chromatid aberrations. pp. 457-460. Progress in Photobiology, Edited by B. C. CHRISTENSEN, and B. BUCHMANN. Elsevier, Amsterdam.
WOLFF, S., K. C. ATWOOD, M. L. RANDOLPH, and H. E. LUIPPOLD, 1958