Building on traditional technology acceptance and human-robot interaction (HRI) research, this research sought to investigate operational HRI factors affecting robot use within the context of a high-risk environment. Technology acceptance models have previously focused on perceived usefulness and ease of use, but have tended to ignore barriers or external factors associated with technology adoption. The present studies investigate the role of barriers such as operational risk and lack of HRI trust in determining acceptance of robots. Experiment 1 empirically refined the experimental methodology used in Experiment 2 to investigate factors affecting robot use. Overall, the results highlighted the influence of HRI trust and
operational risk on the likelihood of robot use; in addition, they shed light on the importance of the configuration of the robot capabilities needed for task completion. With the
proposition that these relationships were moderated by the robot configuration, HRI trust was shown to increase the overall likelihood of robot use and only slight variations were
by
Rosemarie Elaine Yagoda
A dissertation submitted to the Graduate Faculty of North Carolina State University
in partial fulfillment of the requirements for the degree of
Doctor of Philosophy
Psychology
Raleigh, North Carolina 2013
APPROVED BY:
_______________________________ ______________________________
Dr. Douglas Gillan Dr. Lori Foster Thompson
Committee Chair
________________________________ ________________________________
BIOGRAPHY
Rosemarie E. Yagoda completed her undergraduate studies in May of 2008 at the University of South Florida in Tampa, Florida. She attained a Bachelor of Science degree in
Psychology with University and Departmental Honors. After graduation she moved to Raleigh, North Carolina, where she began her graduate studies within the Psychology Department at North Carolina State University in the Fall of 2008. There she earned her M.S in Human Factors and Ergonomics Program in 2011 and her Ph.D. in the same discipline in 2013 while working as a Scientist, specializing in Human-Robot Interaction, for the U.S. Navy.
TABLE OF CONTENTS
LIST OF TABLES ... iv
LIST OF FIGURES ... v
INTRODUCTION... 1
Experiment 1 ... 8
Method ... 9
Results ... 11
Discussion ... 16
Experiment 2 ... 17
Method ... 18
Results ... 21
Discussion ... 32
General Discussion ... 34
REFERENCES ... 38
APPENDICES ... 42
Appendix A ... 43
A.1 Dragon Runner ... 44
A.2 510 Packbot ... 45
A.3 Armadillo ... 46
A.4 FirstLook ... 47
A.5 ReconScout ... 48
LIST OF TABLES
Table 1. Factor Loadings for Exploratory Factor Analysis with Varimax Rotation of
Capability-based Robot Evaluation Items ... 22 Table 2. Multiple Regression Analysis Predicting Robot Use from HRI Trust and
LIST OF FIGURES
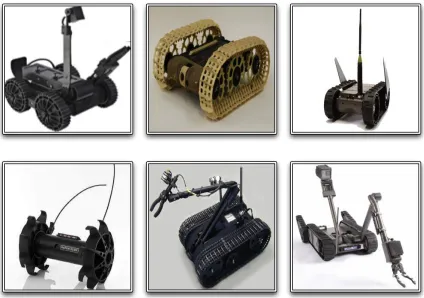
Figure 1. Unmanned Ground Vehicles (UGVs) evaluated during Experiment 1. ... 10 Figure 2. Risk Assessment Matrix (RAM) used to assess the level of operational risk ... 11 Figure 3. Risk assessment results for the thirty-six tasks evaluated during Experiment 1. ... 13 Figure 4. HRI trust (left) and operational risk (right) manipulations integrated into the Robot
Profiles used during Experiment 2. ... 19 Figure 5. The impact of HRI trust on the likelihood of robot use. The results presented have
been separated between robots properly configured and not properly configured. ... 24 Figure 6. The impact of operational risk on the likelihood of robot use. The results presented
have been separated between robots properly configured and not properly configured. 26 Figure 7. The overall interaction between HRI trust and operational risk on the likelihood of
robot use. The results presented have been separated between robots properly
configured and not properly configured. ... 28 Figure 8. The likelihood of robot use across operational risk conditions when HRI trust is
High. The results presented have been separated between robots properly configured and not properly configured. ... 29 Figure 9. The likelihood of robot use across operational risk conditions when HRI trust is
Low. The results presented have been separated between robots properly configured and not properly configured. ... 30 Figure 10. The likelihood of using a robot properly configured with Low HRI trust
compared to using a robot not properly configured with High HRI trust across
INTRODUCTION
“At the time I was supporting a Route Clearance Platoon in Baquba,
Iraq. IEDs were located at almost every intersection. Some had been buried for months, and the ground was as hard packed as if concrete. A request for EOD support came in for a possible IED located inside of a house where personnel had already been walking around inside. I was located nearby and could see the house from my location. After clearing 3 IEDs nearby I drove to the location and spoke with the platoon leader. He gave me a location of the possible IED. I entered the building. The ground was littered with garbage and broken cinder blocks. I identified a suspicious pile underneath the stairwell. There were 2 pipe bombs connected with red detonating cord. I performed a quick 360-degree survey of the area. Just as I turned to walk out of the stairwell, the IED detonated.” – SCPO Timothy “Timmy” Johns, USN
Over the past decade unmanned systems have proven to have a significant impact on warfare worldwide. Unmanned systems have afforded the warfighter the capability to conduct high-risk operations at a distance; which clearly reduces the risk to human life
Due to the demands of conflict and urgent combat needs, unmanned systems have been rapidly deployed while still in a developmental capacity which has created many operational challenges. Since the primary focus has been mainly on autonomous platform and sensor research, development and deployment (R&DD), only little attention was paid to the actual “human-in-the-loop.” As a result, the concept of operations (CONOPS) and corresponding training were immature, leaving the “human-in-the-loop” unprepared and
unable to appropriately use the unmanned systems provided to them (Defense Science Board, 2012). Such a technology-centered R&DD emphasis on the design of autonomous
capabilities, rather than on the operational needs and performance expectations, has created difficult human-robot interaction (HRI) challenges with respect to situational awareness (SA), perception and performance, and workload (McDermott, Gillan, Riley, & Allender, 2009). Unfortunately, these challenges have resulted in many unmanned systems that have been deployed, but never fully adopted. In order to gain a better understanding of this lack of adoption, the underlying mechanisms behind the initial acceptance of new technology needed is first explored.
whereas TPB expands the TRA by adding an additional construct of perceived behavioral control as a determinant of behavioral intent (Ajzen & Madden, 1986).
Building upon TRA, the Technology Acceptance Model (TAM) was next proposed to further explain underlying behavioral intentions (Davis, Bagozzi, & Warshaw, 1989; Davis, 1989). Multiple extensions of the TAM have been developed based on two core constructs: perceived usefulness (PU) and perceived ease of use (PEU; Venkatesh & Bala, 2008;
Venkatesh & Davis, 2000; Venkatesh et al., 2003). PU is the extent to which a person
believes that using the system will enhance their job performance; whereas, PEU is the extent to which a person believes that using a system will be free of effort (Venkatesh & Davis, 2000). TAM and its derivatives are the most widely used models to understand why people use technology (King & He, 2006). Overall, the core constructs have demonstrated high reliability and validity towards assessing user acceptance in a variety of domains (Chin, Johnson, & Schwarz, 2008).
TAM2 (Venkatesh & Davis, 2000) incorporates additional theoretical constructs ranging from social influence processes (subjective norm, voluntariness, and image) to cognitive instrumental processes (job relevance, output quality, result demonstrability, and perceived ease of use). Overall, TAM2 has been shown having a 17% prediction accuracy of technology acceptance (Venkatesh et al., 2003). Legris, Ingham, & Collerette (2003)
conducted a meta-analysis revealing that both the original TAM and TAM2 are useful models; however, both only account for at best 40% of the variance associated with
Theory of Acceptance and Use of Technology Model (UTAUT) was developed by Venkatesh, Morris, Davis, & Davis (2003). UTAUT has condensed the 32 variables into four main effects and four moderating factors yet only resulted in an effective use prediction rate of 42%. Following, TAM3 was developed based on TAM2 and theorized determinates of PEU (Venkatesh & Bala, 2008). The purpose of this integrated model was to predict and enhance the potential adoption and use of technology at an individual level based on
experience. Yet, TAM3 resulted in an effective use prediction rate of 7% lower than UTAUT, comparatively speaking.
A recognized limitation of the original TAM is that it does not account for any barriers or external factors associated with technology adoption (Pijpers, Bemelmans, Heemstra, & Van Montfort, 2001; Straub & Limayem, 1995; Taylor & Todd, 1995). As such, research has sought to extend the TAM by incorporating external variables to explain the additional variance in use intentions. Some of these extensions are particularly
complementary to HRI research regarding initial unmanned system acceptance and adoption. In fact, unmanned systems not properly designed to meet the operational needs and
performance expectations of the mission will not be adopted and fully utilized for their intended benefit during dangerous operations (Defense Science Board, 2012).
Failure to acknowledge operational HRI requirements within the bounds of the mission, often leads to unexpected system failures due to design oversight (Roth, Bennett, & Woods, 1987). Thus, underestimating the complexity of the task or overestimating
accomplish the mission (Ghazizadeh, Lee, & Boyle, 2012). When an unmanned system is not properly configured, the core technology acceptance constructs (i.e., PEU and PU), that have demonstrated high reliability and validity, have essentially been disregarded. In turn, these design failures lead to ineffective human-robot collaborations (Chen, Haas,
Pillalamarri, & Jacobson, 2006). In order to enhance the initial acceptance of unmanned systems, effective HRI is needed. Thus, better HRI design configurations are needed to not only increase trust in the reliability of the system, which would improve overall mission performance, but to ultimately accelerate robot adoption.
As new unmanned systems are being released into the field, their operational
The evolution of HRI trust can be described based on function, performance, and semantics within five overall areas: team configuration, team process, context, task, and system (Yagoda & Gillan, 2012). Trust can affect an operator’s willingness to functionally allocate tasks, disseminate information, and collaborate with the robot during the mission (Freedy, DeVisser, Weltman, & Coeyman, 2007); thus, poorly calibrated trust hinders both team performance and mission effectiveness (Chen & Barnes, 2012; Lee & See, 2004; Parasuraman, Sheridan, & Wickens, 2000).
A meta-analysis conducted by Hancock et al. (2011) concluded that robot
performance-based factors were highly associated with trust such as: behavior, dependability, reliability, predictability, and level of automation. Given the dynamic unstructured nature of HRI, there is a high likelihood of encountering situations of uncertainty regarding the
reliability of robot performance. In such circumstances, task performance expectancies could severely impact human-robot collaboration, and potentially lead to hazardous situations (Kaniarasu, Steinfeld, Desai, Yanco, & Lowell, 2012). Trust is especially critical in
situations characterized by risk, vulnerability, uncertainty, and the need for interdependence (Adams, Bruyn, Chung-yan, & Mccann, 2004). Essentially, there needs to be a balance between moment-to-moment changes and an operator’s ability to dynamically respond in various situations (Inagaki, 2003; Rouse, 1988; Scerbo, 1996). Thus, effective HRI requires a delegation of control to support timely operational decisions, which requires trust.
environment. The following two experiments were designed in an iterative fashion where the content of the second experiment was derived from the results of the first. The intent was to examine the following hypotheses:
Hypothesis 1: HRI trust will have a positive main effect on the likelihood of robot use.
Hypothesis 2: Operational risk will have a negative main effect on the likelihood of robot use.
Hypothesis 3: Operational risk is expected to moderate the effect that HRI trust has on the probability of robot use. Based on previous findings discussed, the effect of HRI trust was expected to be more pronounced as the operational risk increases.
When SCPO Johns was asked why he went into the building instead of using the robot, SCPO Johns responded: “The robot was not utilized due to the fact that personnel had been walking in and around the area and the robot reliability was sporadic inside
Experiment 1
The purpose of Experiment 1 was to refine the experimental methodology to be used in the Experiment 2. This experimental method was intended to achieve two objectives: (1) assess the perceived risk associated with various tasks for which robots would typically be used; (2) identify which of the thirty-six tasks for which each robot would likely be used. Experiment 1 focuses on high-risk applications in which robots are employed for conducting dangerous operations at a distance, in order to improve the likelihood of survivability. In doing so, each task was intended to be not only operationally relevant, but also to simulate real world instances in which an unmanned ground vehicle (UGV) would be used.
During this experiment, participants were to rate the probability of mishap occurrence and severity of mishap effects for thirty-six tasks associated with either EOD or ISR
operations ranging from “Disable an improvised explosive device in a highly populated hostile environment” to “Remove 30lbs of small rocks off of a person.” Participants were
Method
Participants. 50 participants (Males = 29; Females = 21), between the ages of 18 and 67 (M = 34 years old), were recruited using a crowdsourcing web service, Amazon, Inc. Mechanical Turk (http://www.mturk.com). All participants resided in the United States and had an acceptance rate (i.e., successful completion of previous Human Intelligence Tasks or “HITs”) greater than 95%. The average completion time for the study was 33 minutes and
participants were compensated $0.80 resulting in an effective hourly rate of $1.46.
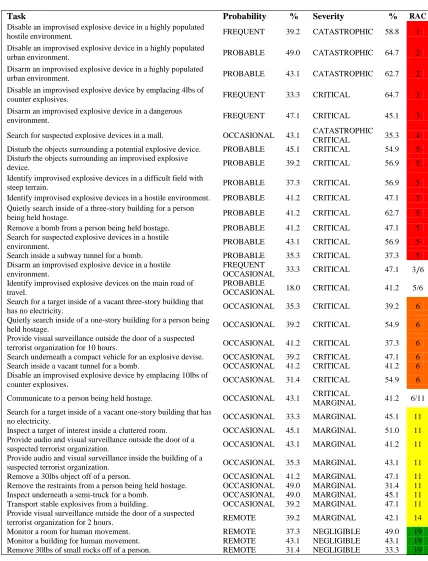
Materials and Procedure. After signing an informed consent, thirty-six tasks (see Figure 3. Risk assessment results for the thirty-six tasks evaluated during Experiment 1.
) were first evaluated in terms of operational risk. In doing so, participants were to assess the probability of mishap occurrence (Frequent to Improbable) and severity of the mishap effects (Catastrophic to Negligible); referencing the MIL-STD-882E (Department of Defense, 2012) definition of a Mishap: “An unplanned event or series of events resulting in death, injury, occupational illness, damage to or loss of equipment or property, or damage to the environment,” for additional clarification and response consistency. Task presentation
order was randomized for each administration.
After operational risk evaluations were completed, participants were instructed to rate the likelihood of robot use for each of the thirty-six tasks. In order to facilitate these
Figure 1. Unmanned Ground Vehicles (UGVs) evaluated during Experiment 1.
Results
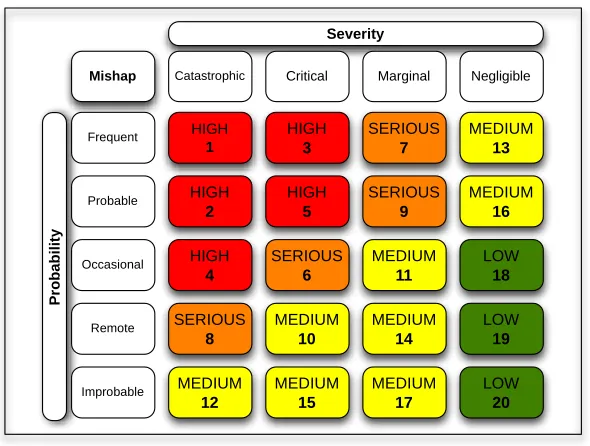
In order to assess operational risk, probability of mishap occurrence (Frequent to Improbable) and severity of the mishap effects (Catastrophic to Negligible) responses were used to classify each task within the Risk Assessment Matrix (RAM) framework. This risk classification procedure is constant with the Department of Defense Standard Practice for System Safety (MIL-STD-882E; Department of Defense, 2012). Assessed risks are expressed as a Risk Assessment Code (RAC); which is combination of one severity category and one probability level that generates a numerical classification value between 1 and 20. This method ultimately allows an analyst to decompose risk into four general categories: High, Serious, Medium, Low.The RAC values are presented within RAM framework in Figure 2 below.
Figure 2. Risk Assessment Matrix (RAM) used to assess the level of operational risk Frequent HIGH 1 HIGH 3 SERIOUS 7 MEDIUM 13 Probable HIGH 2 HIGH 5 SERIOUS 9 MEDIUM 16 Occasional HIGH 4 SERIOUS 6 MEDIUM 11 LOW 18 Remote SERIOUS 8 MEDIUM 10 MEDIUM 14 LOW 19 Improbable MEDIUM 12 MEDIUM 15 MEDIUM 17 LOW 20 Catastrophic Critical Marginal Negligible
RAC values were determined based on the response rate consensus. These
Task Probability % Severity % RAC Disable an improvised explosive device in a highly populated
hostile environment. FREQUENT 39.2 CATASTROPHIC 58.8 1 Disable an improvised explosive device in a highly populated
urban environment. PROBABLE 49.0 CATASTROPHIC 64.7 2 Disarm an improvised explosive device in a highly populated
urban environment. PROBABLE 43.1 CATASTROPHIC 62.7 2 Disable an improvised explosive device by emplacing 4lbs of
counter explosives. FREQUENT 33.3 CRITICAL 64.7 3 Disarm an improvised explosive device in a dangerous
environment. FREQUENT 47.1 CRITICAL 45.1 3
Search for suspected explosive devices in a mall. OCCASIONAL 43.1 CATASTROPHIC
CRITICAL 35.3 4 Disturb the objects surrounding a potential explosive device. PROBABLE 45.1 CRITICAL 54.9 5 Disturb the objects surrounding an improvised explosive
device. PROBABLE 39.2 CRITICAL 56.9 5
Identify improvised explosive devices in a difficult field with
steep terrain. PROBABLE 37.3 CRITICAL 56.9 5
Identify improvised explosive devices in a hostile environment. PROBABLE 41.2 CRITICAL 47.1 5 Quietly search inside of a three-story building for a person
being held hostage. PROBABLE 41.2 CRITICAL 62.7 5 Remove a bomb from a person being held hostage. PROBABLE 41.2 CRITICAL 47.1 5 Search for suspected explosive devices in a hostile
environment. PROBABLE 43.1 CRITICAL 56.9 5
Search inside a subway tunnel for a bomb. PROBABLE 35.3 CRITICAL 37.3 5 Disarm an improvised explosive device in a hostile
environment.
FREQUENT
OCCASIONAL 33.3 CRITICAL 47.1 3/6 Identify improvised explosive devices on the main road of
travel.
PROBABLE
OCCASIONAL 18.0 CRITICAL 41.2 5/6 Search for a target inside of a vacant three-story building that
has no electricity. OCCASIONAL 35.3 CRITICAL 39.2 6
Quietly search inside of a one-story building for a person being
held hostage. OCCASIONAL 39.2 CRITICAL 54.9 6
Provide visual surveillance outside the door of a suspected
terrorist organization for 10 hours. OCCASIONAL 41.2 CRITICAL 37.3 6 Search underneath a compact vehicle for an explosive devise. OCCASIONAL 39.2 CRITICAL 47.1 6 Search inside a vacant tunnel for a bomb. OCCASIONAL 41.2 CRITICAL 41.2 6 Disable an improvised explosive device by emplacing 10lbs of
counter explosives. OCCASIONAL 31.4 CRITICAL 54.9 6
Communicate to a person being held hostage. OCCASIONAL 43.1 CRITICAL
MARGINAL 41.2 6/11 Search for a target inside of a vacant one-story building that has
no electricity. OCCASIONAL 33.3 MARGINAL 45.1 11
Inspect a target of interest inside a cluttered room. OCCASIONAL 45.1 MARGINAL 51.0 11 Provide audio and visual surveillance outside the door of a
suspected terrorist organization. OCCASIONAL 43.1 MARGINAL 41.2 11 Provide audio and visual surveillance inside the building of a
suspected terrorist organization. OCCASIONAL 35.3 MARGINAL 43.1 11 Remove a 30lbs object off of a person. OCCASIONAL 41.2 MARGINAL 47.1 11 Remove the restraints from a person being held hostage. OCCASIONAL 49.0 MARGINAL 31.4 11 Inspect underneath a semi-truck for a bomb. OCCASIONAL 49.0 MARGINAL 45.1 11 Transport stable explosives from a building. OCCASIONAL 39.2 MARGINAL 47.1 11 Provide visual surveillance outside the door of a suspected
terrorist organization for 2 hours. REMOTE 39.2 MARGINAL 42.1 14 Monitor a room for human movement. REMOTE 37.3 NEGLIGIBLE 49.0 19 Monitor a building for human movement. REMOTE 43.1 NEGLIGIBLE 43.1 19 Remove 30lbs of small rocks off of a person. REMOTE 31.4 NEGLIGIBLE 33.3 19
In addition to assessing operational risk, each task was examined in terms of robot use. Tasks were identified for each robot based on likelihood of use and selected in terms of the highest and lowest response percentages. Thus, resulting in six capability-based task parings unique for each robot in terms of High and Low likelihood of use (see Appendix A). In order verify there was a clear capability-based distinction, an independent t-test was conducted between use categories for each robot. The results indicate there was a significant difference between the high likelihood of use and low likelihood of use tasks categories for each robot. Results are as followed:
Dragon Runner. Search for a target inside of a vacant one-story building that has no electricity (M = 5.64, SD = 1.48) Disarm an improvised explosive device in a dangerous environment (M = 2.17, SD = 1.96), t(52) = 7.21, p = .000.
510 Packbot. Disarm an improvised explosive device in a hostile environment (M = 5.15, SD = 1.26) Remove a 30lbs object off of a person (M = 3.58, SD = 2.19), t(49) = 3.19, p = .003.
Armadillo. Search inside a vacant tunnel for a bomb (M = 5.35, SD = 1.81) Disable an improvised explosive device by emplacing 10lbs of counter explosives (M = 2.25, SD = 2.25), t(48) = 6.03, p = .000.
ReconScout. Search underneath a compact vehicle for an explosive device (M = 5.96, SD = 1.17) Transport stable explosives from a building (M = 2.14, SD = 1.77), t(48) = 5.08, p = .001.
Talon. Remove 30lbs of small rocks off of a person (M = 5.44, SD = 1.72) Quietly search inside of a three-story building for a person being held hostage (M = 3.09, SD = 2.25), t(47) = 4.15, p = .001.
As the first of two experiments, it was also important to discover whether participants found the content in the Robot Profiles useful. Multiple regression analysis was conducted to examine the usefulness of the Robot Profile contents during task evaluations based on the overall importance ratings. The Robot Profile Manufacturer Specifications were shown to be useful during task evaluations producing an R2 = .75, F(7.49, 0.49) = 15.32, p = .001. The Robot Profile Photos were also shown to be useful during task evaluations producing an R2 = .79, F(6.75, 0.36) = 18.53, p = .001. On average, the Robot Profile Manufacturer
Discussion
Experiment 1 was designed to empirically refine the experimental methodology for Experiment 2. Considering that the intention was to focus on high-risk applications in which robots are employed to conduct dangerous operations, the risk assessment revealed 39% of the thirty-six tasks generated were considered High risk. This finding suggests that
participants understood the perceived risks associated with various operational environments, without forced manipulations and independent of robot use.
Tasks were collated for each robot based on likelihood of use in terms of response percentage. Following a subset of six tasks was selected for each robot based on the high and low likelihood of use. Though more tasks could be selected, if other variables were of
interest, six tasks were deemed to be sufficient for the purposes of the intent of research to follow. Despite the small sampling of tasks for each robot, the results indicated a clear differentiation between task-based robot use categories.
Participants also indicated the positive utility of the Robot Profiles, and were able to effectively use the information that was provided throughout the robot task evaluations. Thus, both the photo and the manufacturer specifications were deemed helpful decision aids. More interestingly, the results indicated that participants found the Manufacturer
Experiment 2
Experiment 2 sought to investigate factors affecting robot use; more specifically, the effect of HRI trust and operational risk on the likelihood of robot use. Utilizing a
methodology similar to Experiment 1, participants were instructed to assess the likelihood of robot use; however, in this experiment participants were in one of six conditions intended to manipulate HRI trust and operational risk.
The overall design of the study was a 3 x 2 between-subjects design. The
Method
Participants. 329 participants (Males = 217; Females = 112), between the ages of 18 and 66 (M = 30 years old), were recruited using a crowdsourcing web service, Amazon, Inc. Mechanical Turk (http://www.mturk.com). All participants resided in the United States and had an acceptance rate (i.e., successful completion of previous Human Intelligence Tasks or “HITs”) greater than 95%. The average completion time for the study was 35 minutes, and
participants were compensated $0.80.
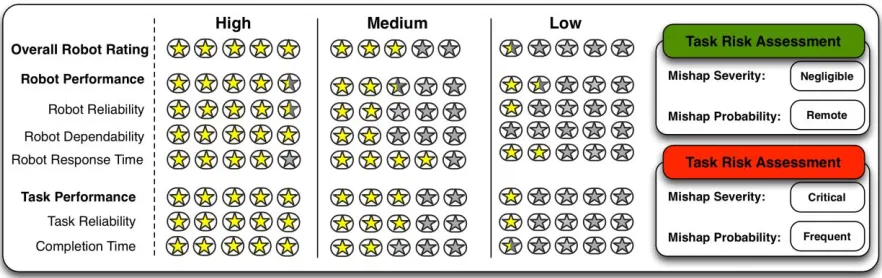
Materials. During the experiment, participants were instructed to use the Robot Profiles provided to evaluate each robot; however, the Robot Profiles in Experiment 2 incorporated two additional components: (1) robot performance history; and (2) assessed operational risk. In order to assist participants with their evaluations, robot operators rated the overall performance of each robot based on their previous experience, hypothetically speaking. As shown in Figure 4 robot performance histories were generated using yellow stars to indicate favorable robot performance to imply three levels of HRI trust. The second Robot Profile addition was replicated results from an operational risk assessment previously conducted, also shown in Figure 4. HRI trust and operational risk remained constant
Figure 4. HRI trust (left) and operational risk (right) manipulations integrated into the Robot Profiles used during Experiment 2.
Procedure. Prior to starting the experiment, participants were asked to use their knowledge and experience to answer general questions pertaining to robots. Following that introduction, the training session began. The goal of the training session was to familiarize participants with the Robot Profiles used in the study. Participants were asked to match the profile content with the following terms: Robot Capabilities, Operator Evaluation,
Operational Risk. The training concluded when the participant correctly matched all of the terms to the profile content.
Once the training had been completed, participants were given the experimental instructions. Participants were informed that they would be evaluating the potential use of 6 different robots. Again, instructed to answer the robot use questions referencing the
information provided in the Robot Profiles, which were unique for each robot.
use. For each of the six tasks, participants rated the robot effectiveness, usefulness, and ease of use; then, similar to Experiment 1, participants were also asked to rate the likelihood of use by indicating the extent to which they agree with the following statement: If I needed to accomplish this task, and the choice was up to me, I would use this robot. These capability-based items were generated from the psychometric evaluation of various technology
Results
Robot Configuration. Throughout the experiment, six unique tasks were evaluated for each robot, and of the six tasks, only half of which the robots were properly configured for. More specifically, the configuration of each robot was evaluated in terms of the
effectiveness, usefulness, ease of use, and likelihood of use for all six tasks. In general, these response items were used to assess the likelihood of robot use relative to the system
capabilities required to complete the task.
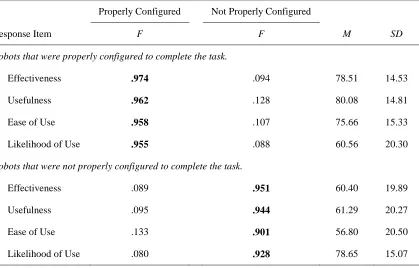
Table 1. Factor Loadings for Exploratory Factor Analysis with Varimax Rotation of Capability-based Robot Evaluation Items
Properly Configured Not Properly Configured
Response Item F F M SD
Robots that were properly configured to complete the task.
Effectiveness .974 .094 78.51 14.53
Usefulness .962 .128 80.08 14.81
Ease of Use .958 .107 75.66 15.33
Likelihood of Use .955 .088 60.56 20.30
Robots that were not properly configured to complete the task.
Effectiveness .089 .951 60.40 19.89
Usefulness .095 .944 61.29 20.27
Ease of Use .133 .901 56.80 20.50
Likelihood of Use .080 .928 78.65 15.07
Furthermore, the capability-based response items within both robot configuration groups identified were all positively correlated, with r-values ranging from .71 to .92 and p = .001. Based on these results, the highly correlated capability-based response items were collapsed then separated into two robot configuration categories. A within-subjects analysis of variance (ANOVA) was conducted to assess the actual degree of difference between the two configuration categories that were established. The results confirmed there was significant difference between the two consolidated groups of capability-based response items, F(1, 355) = 263.72, p = .001, η2=.43.
scores (e.g., effectiveness, usefulness, ease of use, and likelihood of use were combined based on task ability, respectively) identified. Therefore, the effects of HRI trust and operational risk, on the likelihood of robot use, will be analyzed separately for robots properly
configured and not properly configured to complete the task.
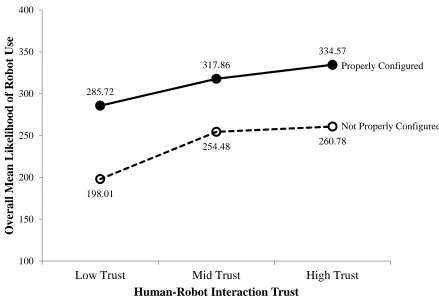
Figure 5. The impact of HRI trust on the likelihood of robot use. The results presented have been separated between robots properly configured and not properly configured.
In order to further investigate Hypothesis 1, additional post-hoc analyses were conducted to decompose the main effect of HRI trust on robot use. LSD comparisons identified a significant difference between all levels (High, Medium, Low) of HRI trust for robots properly configured, ranging from p = .001 to .023. Revealing a higher likelihood of robot use as HRI trust increases. When robots were not properly configured, similar
likelihood of use differences were found between High and Low HRI trust (p = .001); however, no significant difference between High and Medium HRI trust (p = .473) was
285.72
317.86
334.57
198.01
254.48 260.78
100 150 200 250 300 350 400
Low Trust Mid Trust High Trust
Over all M ean L ik eli h ood of Robot Use
Human-Robot Interaction Trust
Properly Configured
found. Interestingly, there seems to a ceiling effect, at higher levels of HRI trust, when a robot is not properly configured.
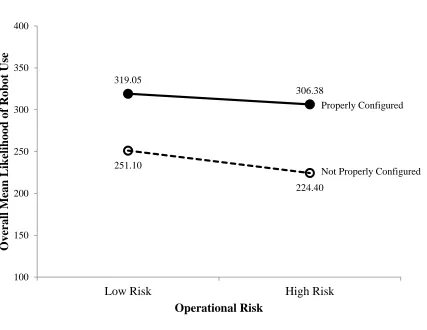
Operational Risk. Hypothesis 2 claimed that operational risk would have a negative impact on the likelihood of robot use. As shown in Figure 6, there was a significant main effect of operational risk on robot use when properly configured, F(1, 350) = 5.21, p = .023, η2
=.02, and when not properly configured, F(1, 350) = 12.38, p = .001, η2=.03, to complete the task. Interestingly enough, when the results were analyzed between operational risk levels for each robot configuration category, this main effect was only partially supported. When a robot was not properly configured, operational risk had a significant impact on the likelihood of robot use, F(1, 355) = 6.13, p = .014. Consistent with Hypothesis 2, the
Figure 6. The impact of operational risk on the likelihood of robot use. The results presented have been separated between robots properly configured and not properly configured.
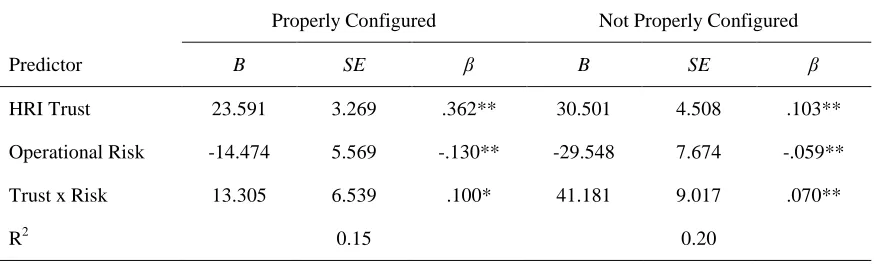
HRI Trust and Operational Risk. Hypothesis 3 stated that operational risk was expected to moderate the effect of HRI trust had on the probability of robot use. In order to assess this hypothesize effect a multiple regression was conducted, and the results were again analyzed between robot configuration categories. The findings are presented in Table 2 between robot configuration categories.
319.05
306.38
251.10
224.40
100 150 200 250 300 350 400
Low Risk High Risk
Over
all
M
ean
L
ik
eli
h
ood
of
Robot Use
Operational Risk
Properly Configured
Table 2. Multiple Regression Analysis Predicting Robot Use from HRI Trust and Operational Risk with Robots Properly Configured and Not Properly Configured
Properly Configured Not Properly Configured
Predictor B SE β B SE β
HRI Trust 23.591 3.269 .362** 30.501 4.508 .103**
Operational Risk -14.474 5.569 -.130** -29.548 7.674 -.059**
Trust x Risk 13.305 6.539 .100* 41.181 9.017 .070**
R2 0.15 0.20
Figure 8. The overall interaction between HRI trust and operational risk on the likelihood
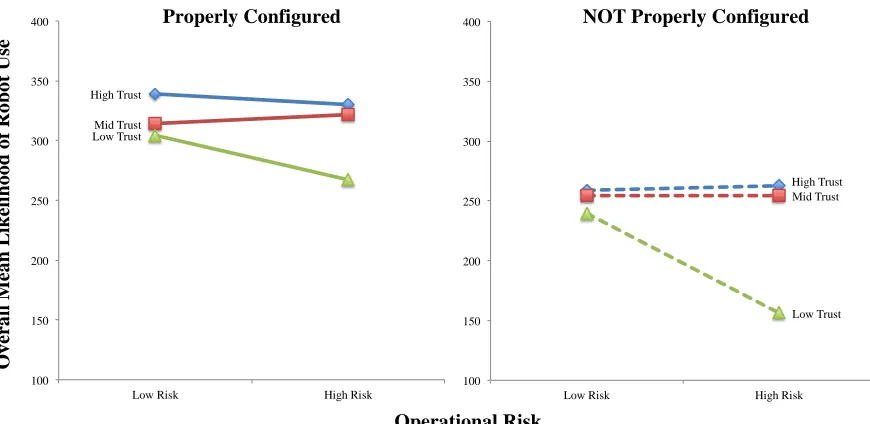
In order to further investigate Hypothesis 3, a closer look was taken at the interaction between HRI trust and operational risk. Considering there was an instance when no
difference was found between High and Medium HRI trust, the results herein are expressed only in terms of High and Low HRI trust. As shown in Figure 9, variations in operational risk did not seem to cause a significant change in robot use when HRI trust was High. In fact, this finding held for robots both properly configured (t(125) = 1.13, p = .261) and not properly configured (t(125) = 0.28, p = .778) suggesting that operational risk does cause variations in robot use when HRI trust is High. Yet, there was a significant change in likelihood of robot use between the robot configuration categories in low operational risk (t(96) = 6.29, p = .001) and high operational risk (t(154) = 6.69, p = .001) conditions (see Figure 9). High Trust Mid Trust Low Trust 100 150 200 250 300 350 400
Low Risk High Risk
High Trust Mid Trust Low Trust 100 150 200 250 300 350 400
Low Risk High Risk
Properly Configured NOT Properly Configured
O v er a ll M ea n L ikeli ho o d o f Ro bo t Use Operational Risk
Figure 9. The likelihood of robot use across operational risk conditions when HRI trust is High. The results presented have been separated between robots properly configured and not properly configured.
Although, operational risk did cause a significant change in robot use when HRI trust was Low when robots were properly configured (t(129) = 3.42, p = .001) and not properly configured (t(129) =7.57, p = .001). In addition, there was a significant difference between robot configuration categories in Low operational risk (t(154) =7.34, p = .001) and High operational risk (t(104) =8.48, p = .001) pertaining to robot use (see Figure 10). As expected, Low HRI trust resulted in a lower likelihood of robot use. Furthermore, this effect was even more pronounced in High operational risk situations.
339.06
330.08
258.78 262.78
100 150 200 250 300 350 400
Low Risk High Risk
Over all M ean L ik eli h ood of Robot Use Operational Risk Properly Configured
Figure 10. The likelihood of robot use across operational risk conditions when HRI trust is Low. The results presented have been separated between robots properly configured and not properly configured.
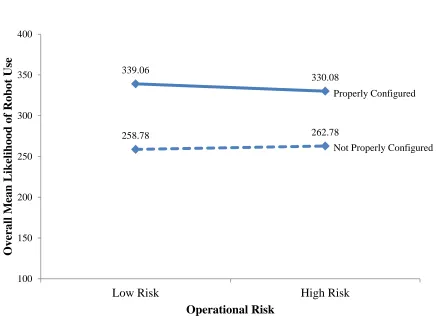
There was a very interesting interaction found when combining a subset of the results shown in Figure 9 and Figure 10. More specifically, comparing a robot properly configured with Low HRI trust to a robot not properly configured with High HRI trust (see Figure 11). In a Low operational risk situation, there was a higher likelihood of using the robot properly configured (M = 304.22, SD = 47.81) as opposed using to the robot not properly configured (M = 258.78, SD = 76.50) to compete the task, t(125) =4.12, p = .001. Ideally, this is what should be expected. However, it is quite concerning that this is not the case in High
operational risk situations. Actually, no difference was found between using a robot properly
304.22 267.23 239.9 156.11 100 150 200 250 300 350 400
Low Risk High Risk
Over all M ean L ik eli h ood of Robot Use Operational Risk Properly Configured
configured (M = 267.23, SD = 76.15) and using a robot not properly configured with High HRI trust (M = 262.78, SD = 78.27) in a High operational risk situation, t(129) =.323, p = .747 (see Figure 11). Interestingly, it seems these results have concluded the opposite of Hypothesis 3 to be true; where, HRI trust actually moderates the effect of operational risk has on robot use.
Figure 11. The likelihood of using a robot properly configured with Low HRI trust compared to using a robot not properly configured with High HRI trust across operational risk conditions. 304.22 267.23 258.78 262.78 100 150 200 250 300 350 400
Low Risk High Risk
Over all M ean L ik eli h ood of Robot Use Operational Risk Properly Configured
Discussion
The results from the second experiment highlighted the influence of HRI trust and operational risk on the likelihood of robot use; in addition, they shed light on the importance of the configuration of the robot capabilities needed for task completion. Hypothesis 1 attributed a positive relationship between HRI trust and robot use and was confirmed. Overall, there was a higher likelihood of robot use with increasing HRI trust. Furthermore, when there were high levels of HRI trust, changes in operational risk did not affect likelihood of robot use. Considering the positive interaction was maintained, this bolsters the evidence in support of Hypothesis 1 when a robot is properly configured for the task.
Hypothesis 2 examined the relationship between operational risk and likelihood of robot use. The experimental results only partially confirmed the negative relationship initially proposed. There was no isolated significant difference found for operational risk when robots were configured properly there was, however, for when they were not configured properly. Yet, taking into account the entire operational picture there was a significant main effect of operation risk for both task-based robot configuration categories. Thus, full operational impact of risk warrants further articulation and testing in the future. For the purposes of this research, operational risk findings seem to become more meaningful within the context of HRI trust within Hypothesis 3.
likelihood of robot use even if the robot was not properly configured, comparatively speaking. A negative, significant interaction was found with low levels of HRI trust displaying a much stronger positive association between HRI trust and robot use with high levels of operational risk; which, was heightened when the robot was not properly
General Discussion
This study examined underlying factors affecting the likelihood of robot use. The overall intent of Experiment 1 was to identify high-risk tasks, in which each of the six robots would or would not be used for. In doing so, empirically refine the experimental
methodology that was used in Experiment 2. Experiment 2 sought to investigate three hypothesized effects of HRI trust and operational risk on the likelihood of robot use.
Hypothesis 1 examined the effect of HRI trust on robot use, attributing a positive relationship between the two progressive variables. When a robot was properly configured for the task, the data was strongly consistent with Hypothesis 1. However, when not properly configured, the likelihood of robot use seemed to plateau instead of progressively increasing with HRI trust. Concluding that HRI trust increases the likelihood of robot use with the proposition that this relationship is moderated by the capabilities of the robot configuration.
Examining the interaction between HRI trust and operational risk, as noted in
Hypothesis 3, yielded some surprising results pertaining to tendencies in robot use. The data revealed that in a high operational risk situation, HRI trust becomes a significant factor in determining which robot (i.e., properly configured or not properly configured) to use. In fact, instances when HRI trust is high may lead to using a robot that is not even properly configured for the task. In addition, there was no significant difference between that and using a robot properly configured when HRI trust was low. Thus, a person is just as likely to use ‘an old reliable’ robot that does not have the capabilities needed to complete the task, just
because it is a trusted system. As always, the results of one study should be interpreted with some reservation, but there could be serious consequences if this tendency or unwillingness to accept new unmanned systems were to hold during an actual high-risk operation. The underlying mechanisms associated with the process in which this propensity develops warrant further articulation and testing in future research.
In order to enhance the utility and acceptance of unmanned systems, better HRI is needed. It is beneficial to understand the underlying mechanisms that influence the perception (right or wrong) surrounding a new or existing unmanned system in an operational environment. Considering the laboratory nature of this research, the
The results from this research allude to some of the operational challenges faced when employing new and unproven robots. First, the unmanned system capabilities need to match the demands of the mission and complement operator performance. In order to start building operational trust, the robot must first be properly configured to execute the mission. Based on the findings of this research, there is a higher likelihood of robot use when the functional capabilities align with the demands of the task; however, this is not always the case. Evidence has suggested that HRI trust is needed to maintain the human-robot
collaboration needed to effectively complete the mission. Thus, a lack of HRI trust may lead to unintended consequences analogous with inappropriate robot use decisions.
Building and maintaining HRI trust within an operational environment is a relatively new concept, and quickly emerging. “Developing operational trust between the users and the autonomous systems will require education and comprehensive training of the
human-autonomy teams,” (pg. 64; Defense Science Board, 2012). Additional research is needed to
investigate how HRI trust can be evaluated and monitored during human-robot collaborations. A few future research questions to ponder:
Are operators taking on more risk to themselves in order to use their favorite ‘old reliable’ robot?
At what point does an operator no longer trust a robot, disregard the system, and complete the task themselves?
What is the short term and long term impact of a system behaving unexpectedly or failing suddenly during a critical phase of a mission?
REFERENCES
Adams, B. D., Bruyn, L. E., Chung-yan, G., & Mccann, C. (2004). Creating a measure of trust in small military teams ( No. CR 2004-077).
Ajzen, I., & Madden, T. J. (1986). Prediction of goal-directed behavior: attitudes, intentions, and perceived behavioral control. Journal of Experimental Social Psychology, 22, 453– 474. doi:10.1016/0022-1031(86)90045-4
Chen, J Y C, Haas, E. C., Pillalamarri, K., & Jacobson, C. N. (2006). Human robot interface: Issues in operator performance, interface design, and technologies ( No. ARL-TR-3834). U.S. Army Res. Lab, Aberdeen Proving Ground, Aberdeen, MD, Tech. Rep. ARL-TR- (Vol. 3834).
Chen, J. Y. C., & Barnes, M. J. (2012). Supervisory control of multiple robots: effects of imperfect automation and individual differences. Human Factors, 54, 157–174. doi:10.1177/0018720811435843
Chin, W., Johnson, N., & Schwarz, A. (2008). A fast form approach to measuring technology acceptance and other constructs. MIS Quarterly, 32(4), 687–703.
Davis, F. D., Bagozzi, R. P., & Warshaw, P. R. (1989). User acceptance of computer
technology: a comparison of two theoretical models. Management Science, 35(8), 982– 1003. doi:10.1287/mnsc.35.8.982
Davis, Fred D. (1989). Perceived usefulness, perceived ease of use, and user acceptance of information technology. MIS Quarterly, 13(3), 319–340.
De Visser, E., Parasuraman, R., Freedy, A., Freedy, E., & Weltman, G. (2007). Evaluating situation awareness in human-robot teams. Proceedings of the Human Factors and Ergonomics Society Annual Meeting,1061–1064. doi:10.1177/154193120705101801 Defense Science Board. (2012). The Role of Autonomy in DoD Systems. Office under the
Secretary of Defense for Acquisition, Technology and Logistics. Washington, D.C. Fishbein, M., & Ajzen, I. (1975). Belief, attitude, intention, and behavior: an introduction to
theory and research. Reading, MA: Addison-Wesley. Retrieved from http://people.umass.edu/aizen/f&a1975.html
Gabarro, J. J. (1978). The development of trust influence and expectations. In A. G. Athos & J. J. Gabarro (Eds.), Interpersonal behavior: Communication and understanding in relationships (pp. 290–230). Englewood Cliffs, NJ: Prentice Hall.
Ghazizadeh, M., Lee, J. D., & Boyle, L. N. (2012). Extending the technology acceptance model to assess automation. Cognition, Technology & Work, 14, 39–49.
doi:10.1007/s10111-011-0194-3
Hancock, P. a., Billings, D. R., Schaefer, K. E., Chen, J. Y. C., De Visser, E. J., & Parasuraman, R. (2011). A meta-analysis of factors affecting trust in human-robot interaction. Human Factors, 53, 517–527. doi:10.1177/0018720811417254 Inagaki, T. (2003). Adaptive automation: sharing and trading of control. Handbook of
cognitive task design, 147–169.
Kaniarasu, P., Steinfeld, A., Desai, M., Yanco, H., & Lowell, M. (2012). Potential measures for detecting trust changes. In the proceedings of the 2012 HRI Conference, 5–6.
King, W., & He, J. (2006). A meta-analysis of the technology acceptance model. Information & Management, 43, 740–755. doi:10.1016/j.im.2006.05.003
Lee, J. D., & See, K. A. (2004). Trust in automation: designing for appropriate reliance. Human Factors, 46, 50–80. doi:10.1518/hfes.46.1.50
Legris, P., Ingham, J., & Collerette, P. (2003). Why do people use information technology? A critical review of the technology acceptance model, 40, 191–204.
Mantel, B., Hoppenot, P., & Colle, E. (2012). Perceiving for acting with teleoperated robots: ecological principles to human–robot interaction design. IEEE Transactions on Systems, Man, and Cybernetics - Part A: Systems and Humans, 1–16.
doi:10.1109/TSMCA.2012.2190400
McDermott, P., Gillan, D. J., Riley, J. M., & Allender, L. (2009). Five lessons learned in human-robot interaction. In P. McDermott & L. Allender (Eds.), Advanced decision architectures for the warfighter: foundations and technology (pp. 289–305). Army Research Laboratory Advanced Decision Architectures Collaborative Technology Alliance.
Moray, N., Inagaki, T., & Itoh, M. (1998). Allocation of function, adaptive automation, and fault management. In the Proceedings of the Human Factors and Ergonomics Society Annual Meeting, 277–280. doi:10.1177/154193129804200320
Muir, B. M. (1988). Trust between humans and machines, and the design of decision aids. In H. E., M. G., & W. D. D. (Eds.), Cognitive engineering in complex dynamic worlds (pp. 71–83). London: Academic.
Parasuraman, R., Sheridan, T. B., & Wickens, C. D. (2000). A model for types and levels of human interaction with automation. IEEE transactions on systems, man, and
cybernetics. Part A, 30(3), 286–97. Retrieved from http://www.ncbi.nlm.nih.gov/pubmed/11760769
Parasuraman, R., & Riley, V. (1997). Humans and automation: use, misuse, disuse, abuse. Human Factors, 39, 230–253.
Pijpers, G. G. M., Bemelmans, T. M. A., Heemstra, F. J., & Van Montfort, K. A. G. M. (2001). Senior executives’ use of information technology. Information and Software Technology, 43(15), 959–971. doi:10.1016/S0950-5849(01)00197-5
Roth, E. M., Bennett, K. B., & Woods, D. D. (1987). Human interaction with an "intelligent" machine. International Journal of Man-Machine Studies, 27, 479–525.
Rotter, J. B. (1971). Generalized expectancies for interpersonal trust. American Psychologist, 26(5), 443–452. doi:10.1037/h0031464
Rouse, W. (1988). Adaptive aiding for human/computer control. Human Factors and Ergonomics, 30(4), 431–443.
Scerbo, M. (1996). Theoretical perspectives on adaptive automation. In Raja Parasuraman & M. Mouloua (Eds.), Automation and human performance: theory and applications (pp. 37–63). Mahwah: Lawrence Erlbaum Associates, Inc.
Schifter, D. E., & Ajzen, I. (1985). Intention, perceived control, and weight loss: an application of the theory of planned behavior, 49, 843–851.
Sheridan, T. B., & Parasuraman, R. (2005). Human-Automation Interaction. Reviews of Human Factors and Ergonomics, 1, 89–129. doi:10.1518/155723405783703082 Straub, D., & Limayem, M. (1995). Measuring system usage: implications for IS theory
Taylor, S., & Todd, P. (1995). Understanding information technology usage: a test of cometing models. Informatiom Systems Research, 6, 144–176.
Venkatesh, V., & Bala, H. (2008). Technology acceptance model 3 and a research agenda on interventions. Decision Sciences, 39, 273–315. doi:10.1111/j.1540-5915.2008.00192.x Venkatesh, V., & Davis, F. D. (2000). A theoretical extension of the technology acceptance
model: four longitudinal field studies. Management Science, 46, 186–204. doi:10.1287/mnsc.46.2.186.11926
Venkatesh, V., Morris, M., Davis, G., & Davis, F. D. (2003). User acceptance of information technology: toward a unified view. MIS Quarterly, 27, 425–478.
Yagoda, R. E. (2012). Human-Robot Interaction Function Allocation Analysis (HRI-FAA) Process: Unmanned Surface Vehicle (USV) Technical Memorandum No. NSWCCD-23TM-2012/09.
Yagoda, R. E., & Gillan, D. J. (2012). You want me to trust a robot? the development of a human–robot interaction trust scale. International Journal of Social Robotics.
Appendix A
Manufacturer Specs
Weight: 11 lbs Height: 15 cm Length: 15.5” Width:13.8”x6”
On board battery
2-3 Hrs, mission dependent
N/A
Cameras (Front & Rear): Day and Night capable
Compatible with all existing QinetiQ controllers N/A Endurance Power Source Manipulator Payload Sensors Control Size
A.1 Dragon Runner
High Likelihood of Use
Search for a target inside of a vacant one-story building
that has no electricity. Strongly Agree 36.0%
Search inside a subway tunnel for a bomb. Strongly Agree 28.0%
Search for suspected explosive devices in a hostile
environment. Agree 37.0%
Low Likelihood of Use
Disarm an improvised explosive device in a dangerous environment.
Strongly
Disagree 65.5%
Remove 30lbs of small rocks off of a person. Strongly
Disagree 65.2%
Remove a 30lbs object off of a person. Strongly
A.2 510 Packbot
High Likelihood of Use
Search inside a vacant tunnel for a bomb. Strongly Agree 38.5%
Inspect underneath a semi-truck for a bomb. Strongly Agree 29.6%
Monitor a building for human movement. Agree 50.0%
Low Likelihood of Use
Disable an improvised explosive device by emplacing 10lbs of counter explosives.
Strongly
Disagree 62.5%
Disable an improvised explosive device in a highly populated urban environment.
Strongly
Disagree 61.5%
Remove 30lbs of small rocks off of a person. Strongly
Disagree 60.0%
Manufacturer Specs
Width: 20.5 in Length: 27 in
Height: 12.0 in Weight: 58.8 lbs
Battery: Batteries (2 BB-2590s): 6.3 lbs (2.9 kg)
Approximately 4 hours
4 DOF, Small Arm Manipulator “SAM”: 8.2 lbs
LWIR Thermal Camera, Camera Arm “CAM”: 5.8 lbs (2.6 kg) Eyes-on, remote teleop, preset poses
Enhanced Aware Payload “EAP”: 2.5 lbs (1.1 kg
A.3 Armadillo
High Likelihood of Use
Search inside a vacant tunnel for a bomb. Strongly Agree 38.5%
Inspect underneath a semi-truck for a bomb. Strongly Agree 29.6%
Monitor a building for human movement. Agree 50.0%
Low Likelihood of Use
Disable an improvised explosive device by emplacing 10lbs of counter explosives.
Strongly
Disagree 62.5%
Disable an improvised explosive device in a highly populated urban environment.
Strongly
Disagree 61.5%
Remove 30lbs of small rocks off of a person. Strongly
Disagree 60.0%
Manufacturer Specs
Height: 7.95 in Width:10.43in
Length: 1.00 in Weight: 5.50 lb
External 12v power and data connector, Li-Ion batteries 1.5 hours full operating condition and 12 hours standby mode N/A
A.4 FirstLook
High Likelihood of Use
Search inside a vacant tunnel for a bomb. Strongly Agree 44.0%
Search underneath a compact vehicle for an explosive
devise. Strongly Agree 37.5%
Provide visual surveillance outside the door of a suspected
terrorist organization for 2 hours. Strongly Agree 36.4%
Low Likelihood of Use
Remove the restraints from a person being held hostage. Strongly
Disagree 58.6%
Disable an improvised explosive device in a highly populated urban environment.
Strongly
Disagree 52.0%
Transport unstable explosive material from a building. Strongly
Disagree 48.0%
Manufacturer Specs
Weight: Less than 5 lbs Height:
4 in Length: 10 in Width: 9 in
Lithium Ion battery
More than 6 hours on average N/A
A.5 ReconScout
High Likelihood of Use
Search underneath a compact vehicle for an explosive
devise. Strongly Agree 32.0%
Search for a target inside of a vacant one-story building
that has no electricity. Strongly Agree 24.0%
Search for suspected explosive devices in a hostile
environment. Somewhat Agree 38.5%
Low Likelihood of Use
Transport stable explosives from a building. Strongly
Disagree 56.0%
Communicate to a person being held hostage. Strongly
Disagree 44.4%
Disturb the objects surrounding a potential explosive device.
Strongly
Disagree 42.9%
Manufacturer Specs
Width: 3 in Length: 7.36 in
Height: 3 in Weight: 1.2 lbs
11.4 V DC Lithium Polymer
A.6 Talon
High Likelihood of Use
Remove 30lbs of small rocks off of a person. Strongly Agree 37.0%
Disable an improvised explosive device by emplacing 4lbs
of counter explosives. Strongly Agree 33.3%
Disturb the objects surrounding an improvised explosive
device. Strongly Agree 30.8%
Low Likelihood of Use
Quietly search inside of a three-story building for a person being held hostage.
Strongly
Disagree 45.5%
Provide visual surveillance outside the door of a suspected terrorist organization for 10 hours.
Strongly
Disagree 24.0%
Communicate to a person being held hostage. Strongly
Disagree 20.0%
Manufacturer Specs
Width: 22 in Length: 34 in Height: 11-52 in Weight: 115 to 140 lb
Single Lithium-ion Battery or Dual Lead-Acid Battery Pack
4.5 hr (7.2 km/hr)
30 in-lb of gripping strength, 6 in wide opening, manual 340 degree wrist
Chemsentry , RAE System MultiRAE, Canberra AN- UDR-14, RayTek temp. probe, targeting laser digital/analog, 500-800 m LOS High Gain antenna range to 1200m LOS
100 lb (45 kg)