MOLECULAR CHARACTERIZATION OF
THE
DROSOPHILA GENOME'CHARLES D. LAIRD AND BRIAN J. McCARTHY
Department of Zoology, The Uniuersity of Texas at Austin
and
Departments of Genetics and Microbiology, University of Washington, Seattle 98105
Received February 14, 1969
A
remarkable feature of evolution in the genus Drosophila is the conservation of the basic karyotype. Postulation of Robertsonian centric fusions (ROBERT- SON 1916) is sufficient to explain most of the karyotypic rearrangements found in the various species. The fixation of large duplications of genetic material dur- ing the evolution of this genus appears to have been rare (STONE 1955). On the other hand, amino acid sequence data for proteins of other organisms indicate that many cistrons have very similar nucleotide sequences, and are presumably related by prior gene duplication(JUKES
1966). Physical studies of DNA of various eucaryotes also suggest that these genomes contain very large families ofrelated cistrons (BRITTEN and KOHNE 1968). The size of such families is often in excess of that inferred from existing protein data (BRITTEN and KOHNE 1968; MCCARTHY 1967; WETMUR and DAVIDSON 1968). This may in some cases reflect the presence of cistrons with similar nucleotide sequences which specify proteins of overtly different functions. It is also likely that some of these families of genes have functions other than the determination of amino acid sequences.
I n keeping with the cytological studies, the reassociation kinetics of denatured
Drosophila melanogaster DNA imply that the genome of this organism is much
less complex, in terms of intragenome nucleotide sequence homologies, than those
of vertebrates (LAIRD and MCCARTHY 1968b). Estimates made from these measurements suggest that perhaps 90% of D . melanogaster nucleotide sequences are not closely related to others elsewhere in the genome.
In light of the extensive diversity within the genus Drosophila (LAIRD and MCCARTHY 1968a)
,
a detailed analysis of the intragenome homologies of representative species is expected to provide information about the evolution ofgenomes. I n particular, our results indicate that genome simplicity extends to other Drosophila species and to a representative of another Dipteran family. I n addition, there are variations among Diptera in genome size as inferred from the informational content of nucleotide sequences.
MATERIALS AND METHODS
Details of labeling and isolation of DNA and RNA from Drosophila, preparation of filter- bound DNA, hybridization and duplex formation procedures, and analytical CsCl pycnography
866 C. D. LAIRD A N D B. J. M C CARTHY
have been previously described (LAIRD and MCCARTHY 1968a). Additional and modified pro- cedures are listed below.
A) Preparation of isotopically-labeled DNA: 32P-labeled T2 DNA-Escherichia coli (2 x 10⁸ cells/ml), growing in low phosphate minimal medium containing glucose, were infected with T 2 (strain H, kindly provided by Dr. R. CROUCH) at a multiplicity of 0.1. Five minutes after in- fection, 10 &c/ml 32P (as Na,HPO,) was added, and aeration was continued a t 37°C for 4 hr. After removal of debris from the lysate by low-speed centrifugation, T2 bacteriophage and DNA were purified by the method of FRE~FELDER (1965).
3H-labeled bacterial DNA's-E. coli B and Bacillus subtilis 168 were grown in Davis minimal medium containing glucose and 5 cc/ml thymidine-methyl-3H (17 c/m mole, New England Nuclear). Bacteria were collected during exponential growth phase and the labeled DNA was isolated by the method of MARMUR (1961).
B) Unlabeled DNA's: T2 DNA was isolated from purified phage by the NaC10, method of
FREIFELDFS (1965). Bacterial DNA's from E. coli B, Bacillus subtilis 168, B . globigii (Depart- ment of Genetics, Stanford University) and Cytophaga succinicans were purified as described by MARMUR (1961). A variety of procedures was used to isolate DNA from insects The procedure detailed previously (LAIRD and MCCARTHY 1968a), involving a crude preparation of cell nuclei, was used unless otherwise specified. Nuclei of various extents of punty were also used i n order to examine the relative rontributions of nudear and cytoplasmic D N A s to the total DNA. A crude nuclear pellet from pupae or adults was obtained by homogenization in Tris buffer (0.05 M, pH 7.6) containing KC1 (0.025 M ) , magnesium acetate (0.005 M ) and sucrose (0 35 M ) , using a mortar and pestle. The homogenate was filtered through cheese cloth, and the filtrate was further homogenized with a motor-driven teflon pestle in a glass tube. Nuclei were pelleted by centrifugation at 500 x g for 10 min. DNA was prepared from crude nuclear pellets from D .
melanogaster (Oregon-R) pupae and adults, D . funebris (Austin, Texas) pupae, and fleshfly (Sarcophaga bullata) pupae obtained from Carolina Biological Supply House. Nuclei from D.
melanoguster adults were also purified by centrifugation through 2.0 M sucrose containing 0.003 M CaC1, and 0.01 M Tris, pH 7.1 and then used as a source of nuclear DNA.
C) Renaturation of D N A in solution: Denaturation and renaturation of DNA were studied using optical methods. The change in absorbance at 260 m& which accompanies denaturation of DNA (hyperchromicity) was measured with an automatic recording Gilford-Beckman spec- photometer. Rates of reassociation of denatured DNA were measured in 1 :: SSC (SSC is 0.15 M NaC1, 0.015 M trisodium citrate) with DNA sheared at about 680 atmospheres (10,000 p s i ) yielding a single-strand molecular weight of about 400,000 daltons. Renaturation at low DNA concentrations (< 50 pg/ml) was followed in 1 cm light-path cuvettes. To determine DNA con- centrations and purity by the total hyperchromic shift during denaturation, OD,,, was followed as the temperature was raised in the cuvettes from 60" to 100°C. These solutions were rapidly cooled to the optimum renaturation temperature of 25" below the midpoint of the thermal transi- tion (T,,, MARMUR and DOTY 1961); the optical density was monitored continuously. For highly purified DNA's, the percent hyperchromicity was 38%; this value dropped to 33% during the cooling to renaturation temperatures as the single strands assumed a less extended configuration. Renaturation of DNA at higher concentrations was carried out under mineral oil in 1 mm light- path cuvettes with the continuously recording spectrophotometer. In this case, D N A s were denatured at 100°C for 10 min, rapidly cooled, and brought up to renaturation temperature. Hyperchromic values during denaturation of these same DNA solutions were determined in 1 cm light-path cuvettes. I n some experiments, renaturation at even higher concentrations (> 2 mg/ml) was followed measuring at 62°C the absorbance of aliquots diluted into 1 >: SSC.
RESULTS
A) Calibration of genome size with initial rate of DNA/DNA duplex formation:
CHARACTERIZATION O F DROSOPHILA D N A 867 accurately reassociation rates of the total DNA (MCCARTHY 1967; BRITTEN and KOHNE 1968). Measurements using filter-bound DNA to determine initial rates of duplex formation indicate that DNA from organisms with small genomes, such as bacteriophage, reassociates more rapidly than DNA from organisms with larger genomes, for example, bacteria (MCCARTHY 1967; LAIRD and MCCARTHY 1968b). Immobilization of one of the interacting components complicates theo- retical analysis of this expected dependence of' reassociation rate on sequence diversity and necessitates an empirical correlation. W e have attempted to deter- mine this correlation by mixing DNA's from unrelated organisms to provide an increased heterogeneity in nucleotide sequences. This increased heterogeneity should simulate the sequence diversity in DNA derived from an organism with a larger genome.
One experiment reported here involved dilution of T2 bacteriophage DNA (both labeled and filter-bound) with bacterial UNA from Escherichia coli. With increasing proportions of bacterial DNA, the labeled T2 sequences react with a smaller and smalle: proportion of the total DNA. This effect is equivalent to studying reactions of a few genes in an increasingly larger genome. Six different mixtures of T2 and E . coli DNA's were used, varying h o m 100% T2 to 100%
E. coli DNA, with the most pertinent ratio being 1 T2:20 E. coli. Reaction solu- tions contained 32P-labeled T2 and/or 3H-labeled E. coli DNA's at a total con- centration of
5
pg/ml in 0.2 ml of 1 x SSC. To each of a series of such vials, a filter containing 12 p g denatured DNA was added. The ratio of T2 to E. coli DNA was adjusted during filter preparation to be identical to that in the solution DNA. Reactions were followed for up to 90 min at 60°C to determine initial rates of T2 and E. coli duplex formation. The results of measuring the rate of association of 32P-labeled, sheared, denatured T2 DNA with filter-bound T2 DNA in the pres- ence of increasing proportions of E. coli DNA are shown in Figure 1A. The upper abscissa indicates the percent of T2 DNA in the reaction mixtures and on the filters, while the lower abscissa indicates the genome molecular weight, taking 1.3 X lo8 daltons to be the genome size of T2 (RUBENSTEIN et al. 1961). The ordinate shows the observed initial rate of reaction (percent labeled DNA bound per hr) of the 32P-T2 DNA (open and closed circles). For example, with noE. coli DNA present, T2 DNA reacted at nine percent per hour. When 10% of
the DNA was T2, (and 90% was E. coli DNA), the rate was about four percent per hour.
At this 1 : 10 ratio of T2 : E. coli DNA, the solution can be thought of as con- taining DNA from a hypothetical organism, 10% of whose genes were derived from T2, and 90% from E. coli. Thus the minimum genome size in which each
868 C. D. LAIRD A N D B. J. M C CARTHY
IO0
IO
I
I O 0
I O
I " " " I I I"""
'
I I""I I I I I " ' " I
A
-
4 -
-
3 -
-
2 -
%
3
8 -
6
5 6
$i Q
-
I -
0
Q,
Q
4-
s
P
\
2-
2
- \
I
o8
I
o9
IO'Olo9
Size
of Genome,
Da
I
tons
FIGURE 1.-An empirical relationship between genome size and initial rate of duplex forma- tion as measured by the filter method.
A. 32P-labeled T2 DNA (21,000 cpm/pg) at a concentration of 5 pg/ml was incubated with
15 pg filter-bound T2 DNA at 62" C, in 0.2 ml 1
x
SSC. At 5, 12, 24, and 45 min, duplicate filters were removed from parallel vials and washed three times i n 1 x SSC a t 62°C. The filter-bound 32P radioactivity was measured by liquid scintillation spectrometry. The initial rate of this duplex formation (9.6%/hr) is plotted versus the molecular weight of the T2 genome, 1.3 X IO8 daltons ( 0 ) . Similarly, rates of reaction were determined for 3H-labeled E. coli DNA (4,300 cpm/pg) and B . subtilis DNA (12,000 cpm/gg) with homologous filter-bound DNAs
(A,
W ) ;these values are also plotted against the genome sizes of 2.7 x 10" for E. coli and 2.0 x IO9 for
B . subtilis.
The open circles
(0)
represent initial rates of reaction of 32P-labeled T2 DNA with homo- logous filter-bound DNA. In these cases, however, E. coli DN.4 was mixed with both the solution and filter-bound DNA's. Solution DNA's and filter-bound DNA's were again in concentrations of5 scg/ml and 15 pg/fiiter. Each circle represents rate determinations on mixtures with different
proportions of the T2 and E. coli DNA's; the upper abscissa scale indicates the percentage of T 2 DNA in the mixture.
B. A similar experiment was carried out with 32P-labeled B . subtilis DNA (41,000 cpm/pg) and 3H-labeled D. mehnogaster DNA (2,000 cpm/pg). Reaction rates obtained with B . subtilis
( 0 ) or Drosophila DNA's
(A)
are plotted versus genome size (data for the molecular weight estimate of the Drosophila genome were taken from Figure 3). The rates of homologous reaction of B. subtilis DNA in the presence of Drosophila DNA are indicated by the open circles (0);t h e upper abscissa indicates the percentage of R. subtilis DNA i n the mixture.
estimates of 2 X IO9 and 2.7 X IO9, respectively. These values are similar to
estimates based on other techniques for these bacteria (DENNIS and WAKE 1966;
CAIRNS 1963).
CHARACTERIZATION OF DROSOPHILA DNA 869
could not be extended much beyond genomes of 1O1O daltons. However, more slowly reacting B. subtilis DNA was diluted in a similar fashion, and the results of this experiment are shown in Figure 1B. I n this case 32P-labeled B. subtilis
DNA was diluted with D. melanogaster DNA, aiid various ratios of this mixture were reacted with filter-bound DNA containing a mixture of bacterial and Dro- sophila DNA's which reflected their relative proportions in solution. T h e actual reaction rate of Drosophila DNA alone, plotted at a haploid genome mol. wt. of
7 X 1 O 1 O (this value will be discussed below)
,
falls considerably above the cali- bration curve at this point. This rate of 0.6% per h r would be expected for DNA from a genome of 2x
1O1O daltons. If all of the Drosophila nucleotide sequences were participating in this initial reassociation, an average multiplicity of 3 for each nucleotide sequence would be indicated. However, only about 10% ofreassociated Drosophila DNA has reduced stability (LAIRD and MCCARTHY 1968b). It is this fraction, presumably, that is dominating the initial rapid reaction kinetics (BRITTEN and KOHNE 1968). Thus the observed initial rate of 0.6%/hr represents a rate of 6.0%/hr for the reacting sequences. Figure 1A shows that this rate would be observed for DNA from a genome of about 5 X 10' daltons rather than 7 x lolo. This suggests that the rapidly reacting components represent sequences belonging to families with about 100 members.
B ) Relationships among r R N A cistrons:
The multiplicity of rRNA cistrons in Drosophila is 100-200, representing about 0.27% of the DNA (VERMUELEN and ATWOOD 1965; RITOSSA and SPIEGELMAN 1965). The rate of hybridization of rRNA with DNA may be used to determine whether a given rRNA molecule can hybridize with any of these ribosomal RNA
cistrons, o r whether the sequences are sufficiently different to preclude such inter- actions. A comparison of this rate for Drosophila nucleic acids with that observed for rRNA/DNA hybrids with nucleic acids from an organism with the same proportion of rRNA cistrons, but fewer in number, would distinguish between these possibilities. Bacillus subtilis fulfills these requirements, having 5-10 ribo- somal RNA cistrons for each of 16s and 23s molecules per genome (Figure 2; also see YANKOFSKY and SPIEGELMAN 1964). Figure 2A shows that the saturation values for homologous 28s or 23s rRNA with Drosophila and B. subtilis DNA, respectively, are similar as expected. The initial rates of hybridization of these homologous nucleic acids (Figure 2B) are 1.2% per h r and 1.7% per hr. On the assumption that bacterial rRNA sequences will cross-react with most of the mem- bers of the family of rRNA cistrons (KOHNE 1968), this similarity in rate of reaction would indicate that the majority of rRNA sequences in Drosophila are also closely related. Small numbers of very different sequences would not, how- ever, be detected by these reaction rate measurements.
C) Renaturation of Drosophila DNA: Optical Measurements.
8 70 C. D. LAIRD A N D B. J. M C CARTHY
DNA A
r R N A
Drosophila /Drosophila 6
'Mouse
/ B. subtilis A
'
Rabbit AB. subtilis
15
3045
Time
minutesFIGURE 2.-Hybridization of ribosomal RNA.
A. Saturation of homologous and heterologous DNA's with 23s B. subtilis rRNA or 28s D.
melanagaster rRNA.
Increasing amounts of 3H-labeled Drosophila 28s rRNA (1500 cpm/pg) were incubated with 9 pg filter-bound Drosophila DNA or mouse DNA in 0.2 ml 2
x
SSC a t 60" C for 19 'hr.Similarly, 32P-labeled B. subtilis 23s rRNA (15,500 cpm/pg) was incubated with 15 pg filter-
bound B. subtilis or rabbit DNA in 0.2 ml 1 x SSC at 67" C for 18 hr. The filter-bound hybrids were washed twice for 3 min i n the buffer and at the temperature of incubation. The percent DNA hybridized was calculated from the amount of labeled RNA bound to the filters.
B. Rate OI homologous rRNA hybridization.
Two series of reaction vials containing either 1 pg 3H-labeled 28s Drosophila rRNA (1500 cpm/fig) and 15 pg filter-bound Drosophila DNA, or 1 pg 32P-labeled B. subtilis 23s rRNA and 15 pg filter-bound B. subtilis DNA, were incubated at 62" C in 0.2 M 1 x SSC. At the indicated
times, filters were removed and processed as described in part A. The rate of hybridization was 1.2% input RNA bound per h r for Drosophila and 1.7% per hr for B. subtilis.
the renaturation process depend on the genome size and the intragenome homol- ogy of an organism (BRITTEN and KOHNE 1968; WETMUR and DAVIDSON 1968).
A useful method of describing renaturation kinetics involves plotting percent denatured DNA versus Cot, the product of initial concentration of denatured DNA
(molarity of nucleotides) and time of renaturation (in seconds). For convenience, we summarize the basis of this technique, although the reader is referred to the original work for further details (BRITTEN and KOHNE 1967, 1968). The re- naturation of DNA is expected to follow second-order reaction kinetics, inasmuch
CHARACTERIZATION O F DROSOPHILA D N A 871
I
FIGURE 3.-Renaturation of E. coli and Drosophila DNA's.
DNA's from D. melanogaster and E. coli were sheared and heat denatured, and incubated
at 60" C in 1 x SSC. The hyperchromicity at 260 m,u was used to measure the extent of renatura-
tion. The percent denatured DNA is plotted versus Cot, the product of concentration (molarity of nucleotides) and time (seconds). E. coli DNA ( 0 ) and Drosophila DNA (W) were incubated
at 60 ,ug/ml in 1 cm light-path cuvettes. Drosophila DNA at 1.7 mg/ml
(A)
was incubated at62" C in 1 x SSC and diluted 50-fold for OD,,, readings at 62" C. The dashed lines drawn through
the E. coli and Drosophila data at 50% renaturation represent the theoretical renaturation curves
for simple second-order reactions. The bovine and T4 bacteriophage data, shown for reference as examples of DNA from complex and simple genomes, respectively, are taken from BRITTEN and KOHNE ( 1968).
-
dC/dt = k,C2where C = concentration of denatured DNA and t := time of renaturation.
Integrating, and evaluating t == 0 (C = CO),
c -
1Co 1 fk, (cot> e
--
1
c
- 1 - 1CO 2 1
+
k, (Cot) or Cotx =- k,.
At half renaturation,-
-
-
-Since k, is inversely proportional to sequence diversity (i.e., the number of different cistrons, WETMUR and DAVIDSON 1968; also see BRITTEN and KOHNE
1967, 1968), Cotx is directly proportional to the number of different genes. Genome sizes estimated in this manner correspond to the minimum amount of DNA in which each nucleotide sequence is represented at least once. Actual a&ounts of DNA per cell will correspond to this estimate when the cell is in fact
8 72 C . D. LAIRD AND B. J. MC CARTHY
Figure 3 illustrates these points for DNA's from a variety of organisms. Under the conditions of this experiment (1 x SSC, 62" C)
,
E. coli DNA is half renatured when Cotg =4. A genome size of 2.7x
lo9 daltons (CAIRNS 1963) thus cor- responds to a Cot value of 4, 'as illustrated on the upper abscissa. The Cot value for T2 DNA is 0.2, indicative of a genome of 1.3 x los daltons (upper scale). This size estimate is in good agreement with more conventional determinations (RUBENSTEIN et al. 1961). Bovine DNA, on the other hand, shows a biphasic re- naturation, with about 40% renaturing very rapidly and 60% at a rate 400 times more slowly than that of E. coli (BRITTEN and KOHNE 1968). Drosophila DNA has a Cot '/2 value of about 80, indicative of a genome size approximately 20 times that of E. coli. The dashed lines through the E. coli and Drosophila data represent theoretical second-order reaction kinetics obtained by adjusting the rate constant,k,
such that the curve passes through the midpoint of the actual renaturation data. Such idealized curves are derived from the integral form of the second-order rateC
Co 1 +k,
(cot)
.
In practice,-,
CO the fraction renatured DNA, isC 1
equation,
-
=solved for various values of C,t, letting k, = 1. Lateral transposition may then be obtained by varying k,, which is inversely proportional to numbers of different nucleotide sequences.
The E. coli data follow closely the second-order rate curve (Figure 3). About five to ten percent of the Drosophila DNA, however, renatures somewhat more rapidly than expected for a second-order reaction. These rapidly reacting se- quences have a lower thermal stability, after renaturation, than does native DNA (LAIRD and MCCARTHY 1968b) suggesting that these nucleotide sequences are partially repetitious ( BRITTEN and KOHNE 1968). Our approach to determine the proportion of DNA which behaves as unique sequences, i.e., sequences which are not represented elsewhere in the genome, is to fit the observed data to the idealized second-order reaction curves This involves treating the data as belong- ing to two groups, either unique or repetitious. If the first 8% of the renaturation curve, for example, is considered to represent repetitious DNA, then the remain- ing 92% can be considered to reflect unique sequences. Data for each class are then renormalized to 10004, and the derived data are plotted in the usual fashion. Figure 4A illustrates this curve-fitting procedure for the Drosophila data in Figure 3 . In this case, the midpoint of the second-order rate curve (dashed line) is placed through Cot = 100. Curves a, b, and c are obtained by renormalizing the initially reacting 5, 8, or 15% of the Drosophila DNA to 100%. Curves A, B, and C are derived from renormalizing the remaining 95, 92, or 85% of the data. Curves A and B both provide a good fit of the data to the second-order rate curve, suggesting that 90-95% of the Drosophila DNA renatures with kinetics expected for unique sequences. The placement of the Cotg at 100 indicates that a genome is 100
+
4 times that of E. coli, or about 7 x 1 O ' O daltons, using CAIRNS'A
100
E
80- LL3
-t-
a
5
6 0 - nI -
-z W U 40-
LL
W
a
-zo
B
I 8 1 1 1 1 1 I , I , , , I , 1 1 1 1 3 I I I I I I , , I , 1 1 1 1 1 1 -
-
c-
-
-
-
-
I 1 t I I I l l I I I I I I l l I I I I I I l l I I I I I I , , I I , l , , , L
CO+
FIGURE 4.-A. Curve-fitting of Drosophila melanogaster DNA renaturation kinetics.
The dashed line represents second-order kinetics, obtained from the equation - =
C 1
CO 1 $k,C,t The lateral placement (i.e., the value of k,) has been chosen to fit the Drosophila data. To illus- trate how different proportions of partially related sequences would affect the kinetics of renatura- tion of total DNA, three distributions are shown: 5% (a), 8% (b), or 15% (c) repetitious, with the remaining 95% (A), 92% (B), or 85% (C) considered as unique. These percentages of the Drosophila data from Figure 3 are renormalized to 100% and plotted in Figure 4A. Curves A and B fit well the second-order curve (dashed line). The 70- and 50-fold displacements between A and a, and between B and b, indicate the approximate average degree of redundancy (family size) of the repetitious sequences based on the assumption that the initial 5% (a) or 8% (b) reassociation represents reaction among partially related nucleotide sequences.
FIGURE 4.-B. (lower) Curve-fitting of renaturation kinetic data from other insects. Data from Figures 6 and 7 are analyzed as described above except that only one distribution of the data into unique and partially redundant classes is shown for eadh DNA. Curves A and a illustrate the partitioning of D. melamguster data (Figure 6) into 5% repetitious and 95% unique. The dashed line again indicates an ideal second-order kinetic curve laterally displaced to approximate the 95% curve of Drosophila data (A). Origins of other curves are: B (95%) and b (5%), D.
simulans data, Figure 6; C (88%) and c (12%), D. funebris data, Figure 6; D (sa%) and d
8 74 C. D. LAIRD A N D B. J. MC CARTHY
would represent only 90% of the genome, thereby necessitating a n 11
%
increase in genome size estimate.The displacement between curves B and b in Figure 4 indicates the extent to which the partially related sequences are renaturing more rapidly. The ratio of the Cot ~ values of curves A and a, and
B
and b, are 50 and 80, respectively, sug-gesting that the repetitious sequences belong to families with about 50 to 80 mem- bers. These values are in reasonably good agreement with the estimate obtained by the filter reactions (Section A).
D ) Characterization of renatured Drosophila D N A :
An alternative method of analyzing renaturation products depends on the buoyant density difference between native and renatured DNA in CsCl ( MESEL-
SON and STAHL 1958). Separation of the polynucleotide strands is accompanied by a n increase in buoyant density of about 0.01 7 gm ~ m - ~ . At various times dur- ing renaturation of Drosophila DNA, aliquots were diluted and cooled to prevent further reaction and analyzed by CsCl pycnography (Figure 5 ) . Samples d, e, and f were taken at times equivalent to Cot values of 8, 98, and 554 (Figure 3). Renaturation by measurements of hypochromicity at 260 mp was 12%, 53%, and 86%. Renaturation, as measured by the density increment relative to a n initial increase of 0.017 g ~ m - ~ after denaturation, was 25%, 50%, and 65%. During renaturation the density distribution of DNA becomes more narrow, probably as a consequence of the formation of higher molecular weight complexes which have lower rates of diffusion. Such molecular weight changes result from elongation of duplexes by concatenation of the randomly sheared fragments
(THOMAS 1966).
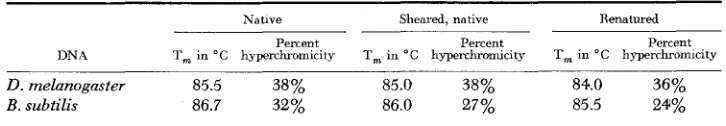
The thermal stability of renatured DNA is also useful in characterizing the reformation of base-paired structures (MCCARTHY and MCCONAUGHY 1968). Table 1 lists the T,’s of renatured Drosophila melunoguster (Cot = 554) and B. subtilis (Cot = 20) DNA’s. Compared with the native sheared DNA, renatured Drosophila DNA exhibits about 90% of the original hyperchromicity, and a stability of 84” C, about 1 O C below that of native DNA. Comparable values were
TABLE 1
Thermal stabilities of natiue, sheared natiue, and renatured DNA’s
Native Sheared, native Renatured
Percent Percent Percent
DNA T, in “ C hyperchromicity T, in “ C hyperchronucity T, in “ C hyperchromiclty
D. melanogaster 85.5 38% 85.0 38% 84.0 36%
B. subtilis 86.7 32 % 8 6 0 27% 85.5 24%
Denaturation of Drosophila and Bacillus DNA’s used i n the renaturation experiments illustrated in Figures 3 and 6 was followed by measuring the hyperchromic transition at 260 xnp. Native DNA, native sheared DNA (10,000 psi, MW = 8 x 1 0 5 daltons), and renatured Drosophila
melanogaster DNA (C,t = 1600) and renatured B. subtilis DNA (Cot = 20) were denatured in
1.721 1.704 1.678
Buoyant density
8 76 C. D. LAIRD A N D B. J. MC CARTHY
found for the bacterial DNA which was expected to form perfectly paired duplexes after renaturation. Thus the buoyant density and thermal stability measurements show that most of the Drosophila DNA renatures homogeneously, and that the products of renaturation are well-paired structures.
E)
Renaturation Kinetics of other Dipteran DNA's:The size and complexity of genomes from species other than D. melanogaster
have been analyzed by optical measurements of renaturation kinetics. Figure 6 shows that D. simulans DNA renatures with kinetics essentially identical to those observed for D. melanogaster DNA with a Cot ~ of 80. D. funebris DNA, however,
renatures with a Cot% of 160 (Figure 6). The bacterial control, in this case Bacil- lus globigii DNA, had a Cot % of 5. These data have been analyzed by the curve- fitting procedure discussed in Section C above. The results (Figure 4B) indicate that the data fit second-order rate curves (dashed lines) assuming that the fol- lowing percentages of DNA are unique sequences: D. melanogaster, 95
%,
(A) ; D. simulans, 95% (B);D.
funebris, 88% (C). The corrected Cot% value for D. funebris is about 200, or about twice that of the D. melanogaster and D . simulans.This suggests that the minimum haploid genome of D. funebris contains about twice as many diff e e n t genes as does that of D. melanogaster. D. simulans DNA,
"
FIGURE 6.-Renaturation of Drosophila D N A s . D N A s from different Drosophila species were sheared and heat-denatured, and incubated at 60°C in 1 x SSC, 0.2% Tween 80, under mineral oil, in 1 mm light-path cuvettes (1 cm light-path cuvettes were used for bacterial DNA's). The hyperchromicity at 260 m p was used to measure the extent of denaturation. The concentrations of DNA were 317pg/ml ( D . melanogaster, O ) , 435 p g h l ( D . simulans e ) , 595 p g / d ( D .
funebris A), and 22 p g / d (Bacillus globigii
A).
The percent denatured DNA is plottd versusCHARACTERIZATION O F DROSOPHILA D N A 877
I 1 I I I Ill1 I I I 1 1 1 1 1 1 I I I I I 1 1 1 1 I I 1 1 1 1 l
r
I I I I I I " 'FIGURE 7.-Renaturation of nuclear Dipteran DNAs. Nuclear DNA's from D. melanogaster,
D. funebris, and the flesh fly (Sarcophaga bullata) were sheared and heat-denatured, and re- natured as described in the legend to Figure 6, at concentrations of 910 pg/ml (O), 900 pg/ml
(e), and 855 pg/ml ( A ) , respectively. The dashed lines, drawn through the 5Q% renaturation value, are theoretical curves for second-order reactions. The renaturation of bacterial DNA
(Cytophaga succinicans,
A)
was carried out at 67 pg/ml under similar conditions.on the other hand, shows the same sequence heterogeneity as does its sibling species,
D.
melanogaster. During the early stages of renaturation, all of the Dro- sophila DNA's reacted somewhat more rapidly than expected for a simple second- order reaction (Figures 6 and 7 ) . The fitting Qf these data to idealized curves (Figure 4B) indicates that the multiplicity of these rapidly reacting sequences is about 70 forD.
simulans andD.
melanogaster (curves A and a; B and b) and about 40 forD.
funebris ( C and c).
This relative simplicity contrasts markedly with the 1,000 to 400,000 family size range observed with mouse DNA ( BRITTENand KOHNE 1968). To determine if this simplicity is limited to the Drosophila genus, we determined renaturation kinetics of DNA from a different family of
insects, Sarcophagidae (order Diptera). The data shown in Figure 7, and ana- lyzed in Figure 4B, indicate that the flesh fly, Sarcophaga bullata, also has a rela- tively simple genome with about 8% repetitious sequences, belonging to families of about 60 members (curves D and d, Figure 4B). The Cot at half-renaturation is approximately 6 times that of
D.
melanogaster, indicative of a minimum genome of 4 x IO1" daltons.DISCUSSION
8 78 C. D. LAIRD A N D B. J. M C C A R T H Y
genome can be extended by the study of polynucleotide sequences. Specific exam- ples of multiple cistrons (YANKOFSKY and SPIEGELMAN 1962), have been gen- eralized to include large numbers of related sequences within many eukaryote genomes. In some vertebrates, the size of such gene families far exceeds that ex- pected from the protein data ( BRITTEN and KOHNE 1968).
From a consideration of cytological data, it seems unlikely that large duplica- tions played an important role in the evolution of modern Drosophila species
(PATTERSON and STONE 1952). That this conclusion extends to the molecular
level was suggested by the rates of Drosophila DNA/DNA duplex formation using filter-bound DNA. Preliminary estimates suggested that only five to ten percent of
D.
melanogaster DNA reassociated with a slightly greater rate than expected for this genome. The thermal stability of these complexes was lower than that of well-paired duplexes whereas products formed after more extensive re- naturation displayed native-like thermal stability ( LAIRD and MCCARTHY 1968b). The results detailed here permit more precise estimates of the size and com- plexity of several Dipteran genomes. Table 2 summarizes these estimates obtained from kinetics of solution renaturation of total and nuclear DNA's. Haploid genomes ofD.
melanogaster andD.
simulans appear to have molecular weights 25 times that of E. coli, o r about 7 x 1 O 1 O daltons. T h i s value is at the lower end of the microspectrophotometric estimates obtained by KURNICK and HERSKOWITZ( 1952). The precise relationship between information content, as measured by
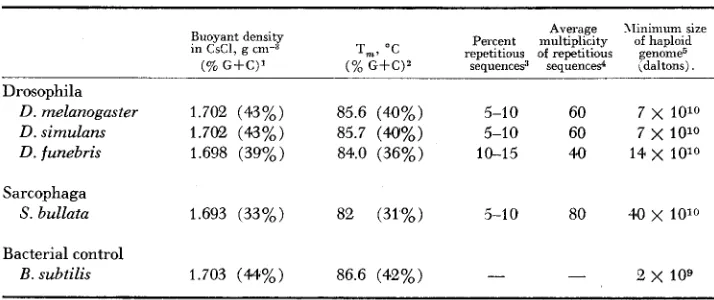
TABLE 2
Characterization of Dipteran DNA's
Average XIinimum size Buoyant density Percent multiplicity of haploid in CsCl, g cm-3 T,, " C repetitious of repetitious genome5
(% G+C)' (% G f Q 2 sequence9 sequences4 idaltons) .
Drosophila
D. melanogaster 1.702 (43%) 85.6 (40%) 5-1 0 60 7 x 10¹⁰
D. simulans 1.702 (43%) 85.7 (40%) 5-10 60 7
x
1010D. funebris 1.698 (39%) 84.0 (36%) 10-15 40 14 x 1O10
Sarcophaga
S. bullata 1.693 (33%) 82 (31%) 5-1 0 80 40 x 10'"
Bacterial control
B. subtilis 1.703 (44%) 86.6 (42%) - - e x 109
Densities were measured using Myxococcus xanthus as standard (1.727 g "3). Base com-
2 Thermal denaturations were carried out in 1 x SSC. Base compositions were calculated using
The data of Figures 3, 6 and 7 have been analyzed as shown in Figure 4B to provide this
The displacement between curves (A and a, for example) shown in Figure 4B is taken as an positions were calculated from SCHILDKRAUT, MARMUR and D o n (1962).
the relationship established by MARMUR and D o n (1962).
estimate of percent repetitious sequences.
estimate of family size. -
3 These estimates, taken from F i m r e
-
4B. are based on ratios of the C-t. In value of E . coli I, I,'CHARACTERIZATION O F DROSOPHILA D N A 879 renaturation rates, and the actual amount of DNA per cell is presently under in- vestigation.
That these sibling species have genomes of identical size is predictable in light of the banding pattern similarity of the salivary gland chromosomes (HORTON
1939). I t is surprising, however, that the nucleotide sequqnce diversity of
D.
funebris DNA is twice as great as that of
D.
melanogaster. These species have been separated for perhaps 4.0 X lo6 years (THROCKMORTON~ personal communi- cation) and are classified in different subgenera. On the basis of nucleotide se- quence homology differences between these species, the genus Drosophila is com- parable in diversity to the taxon “order” among mammals (LAIRD and Mc-CARTHY 1968a). However, very little difference in DNA content per haploid cell exists among the entire class Mammalia, although variation among even closely related plants is common ( STEBBINS 1966 j
.
It is not clear which DNA value, if either, represents that of the ancestral Drosophila line. It is possible that
D.
melanogaster and other species in the Sophophora subgenus represent a reduction in DNA values. Alternatively,D.
funebris may represent a species which has undergone duplication of sequences by polyploidy, with subsequent divergence so that these duplicate sequences are no longer recognizably similar. Since autopolyploidy is theoretically improbable after the establishment of differentiated sex chromosomes (MULLER 1925; OHNO
1967), it may be that such duplication occurred prior to fixation of the sex- determining X and Y homologues in Drosophila. Although banding pattern rela- tionships are too distant between these species for salivary gland chromosome comparisons, metaphase chromosomes of the two species appear to be rearranged by centric fusion only (PATTERSON and STONE, 1952). However, it is perhaps significant that genetic markers on the X chromosome of
D.
funebris are separated by twice the map distance as are the homologous markers inD.
melanogaster (PERJE 1955). Further comparison of these and other species may indicate whether nucleotide sequences have been lost in the evolution ofD.
melanogasteror added during the evolution of
D.
funebris.It will be of interest to examine these values in light of suggestions made by STEBBINS (1966) that primitive, ancestral-like species often have a greater num- ber of genes than do their more specialized derivatives. The argument is based on the concept that variety and versatility of ger,e function may be more vital to an unspecialized organism. In this respect,
D.
funebris is thought to be more similar to the ancestral line, on the basis of morphology and karyotype, than isD.
melanogaster (PATTERSON and STONE 1952). and their genome sizes are con- sistent with this correlation.The rather large genome of Sarcophaga is also of interest in comparison with mammals. A haploid mouse cell, for example, has a DNA equivalent of about
2 x 1Ol2 daltons (VENDRELY and VENDRELY 1949), only five times that of
Sarcophaga and thirty times that of
D.
melaitogaster. While the difference be- tween flies and rodents may be rationalized in terms of the sophistication of the organism, the significance of a six-fold difference between flies is not obvious.880 C . D. LAIRD A N D B. J. MC CARTHY
similarity in the extent of intragenome homology. About 10% of the DNA base sequences appear to be partially redundant; the average size of these families of related sequences is about 40 to 80. These numbers are far lower than those obtained for mammalian DNA's when estimates are based on similar criteria of nucleotide sequence homology. Bovine DNA, for example, seems to consist of 60% unique, and 40% partially redundant sequences. The family size of these repititious sequences ranges up to 100,000 (BRITTEN and KOHNE 1968). The relative simplicity of the Drosophila genome, however, is not characteristic of
all invertebrates, since sea urchin DNA, for example, shows a considerable amount of intragenome homology (BRITTEN and KOHNE 1968). Other examples of simple genomes among eukaryotes are known, the most extreme offered by yeast (BICKNELL, personal communication; BRITTEN aizd KOHNE 1968).
One possible explanation for these differences may be that simple genomes are correlated with higher mutation rates. Clearly, if the rate of divergence by fixa- tion of mutations exceeds the rate of creation of new intragenome homologies by gene duplication, apparent genome simplicity would result. Some evidence for very distant sequence homologies in D. melanogaster has been found by reasso- ciating DNA at reduced temperature (LAIRD and MCCARTHY 196813). These sequences may represent members of larger groups of common ancestry which have since diverged to a considerable extent. I n some organisms, recombination restrictions may also force rapid divergence of related sequences (THOMAS 1966). Alternatively, specific requirements of gene function may determine to what extent intragenome homology may be tolerated by a n organism.
SUMMARY
The nucleotide sequence heterogeneity of DNA influences the kinetics of strand reassociation during renaturation. Kinetic measurements of renaturation have been used to estimate the number of different sequences in several insect DNA's. Our studies with Dipteran DNA's indicate that the minimum genome sizes of
the sibling species, Drosophila melanogaster and D. simulans, are about 7 x l O l o daltons, corresponding to 100,000 cistrons of 1,000 nucleotides. In contrast to this, the genome of D. funebris, a more distantly related species, has about twice as many different nucleotide sequences-Intragenome homology, such as would be expected to result from gene duplication, is limited. From five to fifteen percent of the DNA of these species renatures more rapidly than expected for a second- order reaction. The average multiplicity of similar nucleotide sequences is on the order of 50 to 100. Renaturation kinetics of Sarcophuga bullata DNA also indicate the presence of limited intragenome homology. These results are contrasted with rapid renaturation observed with DNA from many other eukaryotes.-One group of genes which share a common function, the ribosomal RNA cistrons, has been analyzed by RNA/DNA hybridization. The kinetics of hybridization of D. me- lanogaster ribosomal RNA to homologous DN-4 suggest that most of the 28s
CHARACTERIZATION O F DROSOPHILA D N A 881 L I T E R A T U R E C I T E D
BRITTEN, R. J. and D. E. KOHNE, 1967 Nucleotide sequence repetition i n DNA. Carnegie Inst. Wash. Yearbook 66: 78-106.
--,
1968 Repeated sequences in DNA. Science 161: 529-540.The chromosome of E . coli. Cold Spring Harbor Symp. Quant. Biol. 28: 43-46. Autoradiography of the Bacillus subtilis chromosome. J.
A rapid technique for the preparation of purified bacteriophage DNA or
A comparison of the salivary gland chromosomes of Drosophila melano-
CAIRNS, J., 1963
DENNIS, E. S. and R. G. WAKE, 1966
FREIFELDER, D., 1965
HORTON, I. H., 1939
JUKES, T. H., 1966 KOHNE, D., 1968
KURNICK, N. B. and I. H. HERSKOWITZ, 195Q
LAIRD, C. D. and B. J. MCCARTHY, 1968a Mol. Biol. 15: 435439.
RNA from crude lysates. Biochim. Biophys. Acta 108: 318-320.
gaster and D. simulans. Genetics 24: 234-243.
Molecules and Evolution. Columbia University Press, New York.
Isolation and characterization of bacterial ribosomal RNA cistrons. Biophys. J.
The estimation of polyteny in Drosophila salivary gland nuclei based on determination of DNA content. J. Cell. Comp. Physiol. 39: 281-299.
Magnitude of interspecific nucleotide sequence vana- bility in Drosophila. Genetics 60: 303-322. -, 1968b Nucleotide sequence homology within the genome of Drosophila melanogaster. Genetics 60: 323-334.
A procedure for the isolation of deoxyribonucleic acid from micro-organisms.
J. Mol. Biol. 3: 208-218.
Thermal renaturation of deoxyribonucleic acids. J. Mol. Biol. 3: 585-594. -, 1962 Determination of the base composition of deoxyribonucleic acid from its thermal denaturation temperature. J. Mol. Biol. 5: 109-118.
The replication of DNA in Escherichia coli. Proc. Natl. Acad. Sci. U. S. 44: 671-680.
The arrangement of base sequences in DNA. Bacteriol. Rev. 31 : 208-
Related base sequences in the DNA of simple and complex organisms. I. DNA/DNA duplex formation and the incidence of related base sequences in DNA. Biochem. Genetics 2 : 37-53.
Why polyploidy is rarer in animals than i n plants. Am. Naturalist 59:
Sex Chromosomes and Sex-Linked Genes. Springer-Verlag, Berlin, New York.
Evolution in the Genus Drosophila. The Macmillan
Genetic and cytological studies of D . funebris; some sex-linked mutations
Localization of DNA complementary to ribosomal RNA in the nucleolus organizer regions of Drosophila melanogaster. Proc. Natl. Acad. Sci. U. S. 53: 737-745.
Chromosome studies. I. Taxonomic relationships shown in the chro- mosomes of Tettigidae and Acrididae. J. Morphol. 27 : 179-331.
The molecular weights of T 2 Bacteriophage DNA and its first and second breakage products. Proc. Natl. Acad. Sci. U. S.
47: 1113-1122.
8 : 1104-1118.
MARMUR, J., 1961
~MARMUR, J. and P. DOTY, 1961
MESELSON, M. and F. STAHL, 1958
MCCARTHY, B. J., 1967
MCCARTHY, B. J. and B. L. MCCONAUGHY, 1968 227.
MULLER, H. J., 1925
OHNO, S.. 1967
PATTERSON, J. T. and W. S. STONE, 1952
PERJE, A. M., 1955
RITOSSA, F. and S. SPIEGECMAN, 1965 346-353.
Company, New York.
and their standard order. Acta. Zool. Stockholm 36: 51-66.
ROBERTSON, W. R. B , 1916
882
SCHILDKRAUT, C. L., J. MARMUK and P. D o n , 1962 Determination of the base composition of
STEBBINS, G. L., 1966
STONE, W. S., 1955 Genetic and chromosomal variability in Drosophila. Cold Spring Harbor Symp. Quant. Biol. 20: 256-270.
THOMAS, C., 1966 Recombination of DNA molecules. Prog. Nucleic Acid Res. Mol. Biol. 5 :
315-348.
VENDRELY, R. and C. VENDRELY, 1949 La teneur du noyau cellulaire en acide dCsoxyribo- nuclbique B travers les organes, les individus et les esgces animals. Experientia 5 : 327-329. VERMEULEN, C. W. and K. C. ATWOOD, 1965 The proportion of DNA complementary to ribo-
somal RNA in Drosophila melanogaster. Biochem. Biophys. Res. Commun. 19: 221-226.
WETMUR, J. G. and N. DAVIDSON, 1968 Kinetics of renaturation of DNA. J. Mol. Biol. 31:
349-370.
YANKOFSKY, S. A. and
s.
SPIEGELMAN, 1962 Distinct cistrons for the two ribosomal RNA com. ponents. Proc. Natl. Acad. Sci. U. S. 49: 538-544.C. D. LAIRD A N D B. J. M C CARTHY