_____________________________________________________________________________________________________ www.sciencedomain.org
Peak Expiratory Flow (PEF) in Relation to Selected
Anthropometric Parameters in Healthy Adult Males
of Kumaun Region of India: A Comparative Study
Kumari Poonam
1, Mehar Bano
2, Kamlesh Jha
3*and Parveen Bhardwaj
11Department of Physiology, Government Medical College, Haldwani, Uttarakhnad, India. 2Department of Community Medicine, Government Medical College, Haldwani, Uttarakhand, India.
3
Department of Physiology, AIIMS, Patna, India.
Authors’ contributions
This work was carried out in collaboration between all authors. Authors KP and PB designed the study, author MB wrote the protocol and performed the statistical analysis. Authors KP and KJ wrote the first draft of the manuscript and managed literature searches. All authors read and approved the final manuscript.
Article Information
DOI: 10.9734/BJMMR/2015/12460 Editor(s): (1) Robson Xavier Faria, Laboratory of Cell Communication, Oswaldo Cruz Institute, Oswaldo Cruz Foundation, Brazil. (2)A. A. Hanafi-Bojd, Department of Medical Entomology and Vector Control, School of Public Health,
Tehran University of Medical Sciences, Iran (3)Harry E. Ruda, Stan Meek Chair Professor in Nanotechnology, University of Toronto, Director, Centre for Advanced Nanotechnology, University of Toronto, Canada. (4)Salomone Di Saverio, Emergency Surgery Unit, Department of General and Transplant Surgery, S. Orsola Malpighi University Hospital, Bologna, Italy. Reviewers: (1)Anonymous, Israel. (2)Anonymous, University of Yaounde 1, Cameroon. (3)Anonymous, São Paulo State University, Brazil. (4)Anonymous, Thailand. (5)Anonymous, Italy. Complete Peer review History:http://sciencedomain.org/review-history/9882
Received 1st July 2014 Accepted 28th May 2015 Published 20th June 2015
ABSTRACT
Background: PEF is a reasonably good measure of ventilatory function. It varies with various anthropometric parameters, geographical location of the subjects as well as various disease processes.
Objective: To assess the relationship between PEF and certain selected anthropometric parameters and to devise prediction equation based upon these parameters.
been assessed for PEF using Wright Peak Flow Meter.
Results: In the age group ≤ 40 years, PEF was on the average greater than in the age group > 40 years. Prediction equations were derived for PEF dependent on age and height in <40 age group and age and weight in >40 years age group.
Conclusion: PEF appears to decline with advancing age, and to increase with height in younger subjects and weight in older subjects.
Keywords: PEF; anthropometric parameters; prediction equation.
1. INTRODUCTION
The peak expiratory flow has received general acceptance as a useful test of ventilatory function. PEF is the maximum rate of air flow achieved during a forced expiration after maximal inspiration [1,2]. PEF measurement by Peak Flow Meter is an easy way to measure lung functions in field studies [2]. Measuring PEF is a simple method for follow-up of treatment in patients with respiratory illnesses such as asthma, chronic bronchitis, and emphysema. The test is simple to perform and though similar to forced vital capacity, the effort needed to be maintained till the end of expiration and a poor terminal effort does not affect the peak flow meter value [3].
Peak expiratory flow vary with age, sex, height, weight, body surface area, arm span, geographical region, physical activity, circadian rhythm, tobacco smoking, environmental conditions including occupation and socioeconomic status of an individual [2-11].
Nainital district is located at 29.38 deg N 79.45 deg E with an altitude of 2084 meters above sea level. Kumaun region of Uttrakhand, (INDIA) is unique in terms of its difficult mountain terrain and its hard working residents (especially males who use to do most of the outdoor assignments) has been selected for the study. Though enough of literatures (both Indian as well as foreign) are available regarding the relationship of PEF and anthropometric parameters [12-15], the unique geographical location of the study population and paucity of sufficient evidence of similar study in this area may make this study a novel one.
The present study investigates the relation between PEF and certain anthropometric variables in the young versus older healthy adult male population of the Kumaun region.
2. METHODOLOGY
Three hundred (300) healthy adults of age between 18 to 60 years visiting GMC Haldwani,
Nainital as attendants of the patients or staffs of the institute and resident of Kumaun region (Hilly region) have volunteered for the study. The study enrolled exclusively males. We excluded from the study all the volunteers who were non-resident of that area or having history of smoking or had history of any recent/ chronic cardio-respiratory illness. Each of the subjects signed an informed consent according to the ethical requirements prior to the measurement of the peak expiratory flow. We measured the PEF by using Wright’s Peak Flow Meter (Medi Aid System, India). The test was performed in standing position after a group demonstration. The test was repeated 3 times and highest of these readings was recorded for analysis of PEF in litre/min. Age of subjects was recorded as per their valid identity card/ age proof (voter id, pan card, driving licence). The height was measured in centimetres without shoes in the standing position. The body weight in kg with minimum clothing was recorded for each subject using weighing machine (Gravis). The body surface area (BSA in m2) was calculated with the help of Dubois formula [16] as follows:
A= W0.425 X H0.725 X 0.007184
where A is the body surface area (BSA), W is weight in kg and H is height in meter.
3. STATISTICAL ANALYSIS
Data were expressed as mean±standard deviation (SD). Student’s t test was performed to find the difference in the mean PEF in the two age groups. Bivariate Pearson’s correlation analysis was done between selected anthropometric variables and PEF. Regression equations were framed for PEF dependent on age and height in ≤40 age group and age and weight in >40 year age group. The software used was SPSS (version-18).
4. RESULTS
mean weight was slightly greater in ≥ 40 years age group (69.2±9.0 kg) than in < 40 years age group (65.9±9.9 kg). Height and BSA on the average were similar in the two age groups (Table 1).
PEF was steady up to 24 years of age followed by linear decrease with increasing age. Although the difference in PEF between the subjects of <20 year’s age group and the 20-24 years age group is 3.5 L/min, too small to say that there was a real difference (a ‘t’ test would give a P of about 0.70). Not surprisingly, the mean PEF was significantly greater in ≤ 40 age group than in > 40 age group (p <0.05).
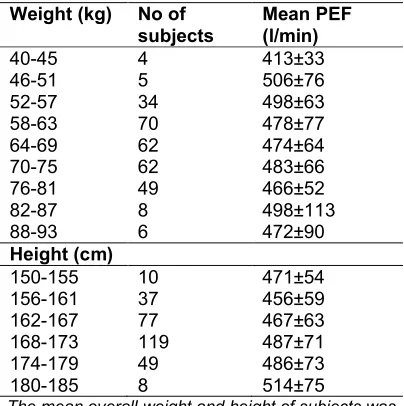
The table (Table 2) shows that Mean PEF is highest in the weight range of 46-51kg (506+76 l/min), Further the highest PEF was observed in a height range of 180-185 cm (514+75 l/min).
The correlation coefficient is greater in PEF & age (-0.678 in ≤ 40 years age group and -0.685 in >40 years age group) than the correlation coefficient between PEF & other anthropometric variables of height, weight and BSA (Table 3).
The table (Table 4) shows that in ≤40 years age group (observed after the age 24 years), PEF highly correlated with the age (r is 0.678 & -0.685) in both the age groups and less correlated with height (r is 0.330) and weight (r is 0.199).
Here, the R2 is 15.4% in 25-≤ 40 age group and 46.9% in >40 age group respectively in both the age groups and the model is significant. The 15.4% and 46.9% variation in the dependent variable, PEF is explained by the age.
The table further shows that in subjects ≤40 years of age PEF correlates with weight and with age.
A multiple regression was carried out in 25-≤40 age group & height of these individuals as predictors and age & weight as predictors in >40 years age group. Similar results were obtained on carrying out stepwise linear regression taking age, height, weight and BSA as predictors in both the age groups. Age became significant predictor in >40 years age groups while age & height as significant predictors in ≤40 years age group.
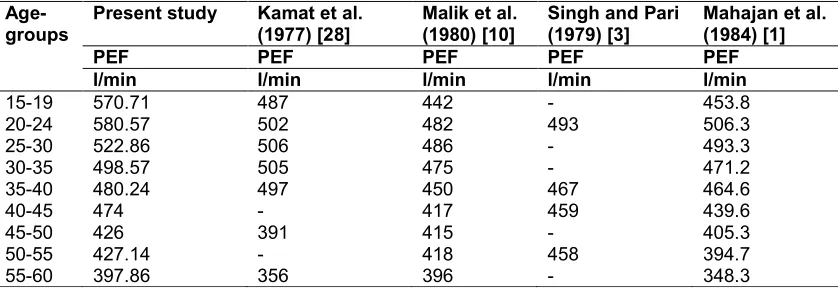
This table (Table 5) shows that the mean PEF values of the Kumaun adult males in various age groups is different to that of other Indian author’s studies attributable to the different regional conditions. Various authors [1,3,10] had given prediction equation for PEF earlier based upon different geographical area, mostly sea level cities. Their formulae have been used for prediction of PEF of the population in question to explain the difference that is obvious between the study population and the previously studied population. Thus it could be inferred that same prediction equation could not applied to all the populations living in diverse geographical regions.
5. DISCUSSION
Pulmonary function test is an important tool in the diagnostics of pulmonary ailments. Most of the existing knowledge about the normative values of pulmonary function test is based upon the studies done in the western countries over subjects whose anthropometric parameters are quite different from Indian population [17].
Table 1. Anthropometric data and PEF is presented according to two age groups (≤ 40 years & > 40 years)
Anthropometric data PEF
Age- (yrs) No Weight (kg) Height (cm) BSA (m2) (l/min) mean (l/min) < 40 years
>20 14 67.9±8.3 173.7±4.0 1.8±0.1 577±32
523±58 20-24 35 67.1±11.1 170.0±6.0 1.8±0.2 580±27
25-29 35 65.0±8.0 166.8±5.7 1.7±0.2 520±63 30 -34 35 62.4±9.5 166.2±7.1 1.7±0.1 499±44 35 - 40 41 67.9±10.6 167.1±6.1 1.8±0.1 480±30
> 40 years
41-45 35 72.0±8.8 165.2±6.0 1.8±0.1 460±32
The study attempted to put forward a prediction equation for PEF based upon certain anthropometric parameters for Indian population living in the hilly region. The real importance of the study lies in devising a prediction equation for predicting PEF of people living in hilly places like the one studied based upon normative data gathered. This could enable a primary care physician to figure out if the values they are getting in those types of subjects are normal or abnormal. Many earlier studies in Indian population attempted to answer this question in their own way by devising prediction equation but as is obvious, the anthropometric parameters vary depending upon the geographical locations and various other factors [18]. Therefore, population specific prediction equation is a much needed.
Table 2. The effect of weight and height on PEF regardless of age
Weight (kg) No of subjects
Mean PEF (l/min)
40-45 4 413±33 46-51 5 506±76 52-57 34 498±63 58-63 70 478±77 64-69 62 474±64 70-75 62 483±66 76-81 49 466±52 82-87 8 498±113 88-93 6 472±90
Height (cm)
150-155 10 471±54 156-161 37 456±59 162-167 77 467±63 168-173 119 487±71 174-179 49 486±73 180-185 8 514±75
The mean overall weight and height of subjects was 67.5±9.6 kg and 167.8±6.3 cm. respectively.
The study revealed that up to the age of 24 years the PEF has got a tendency to increase or remain steady followed by a linear decrease with advancing age. Elderly age group (>40 years
age group subjects in the present study) showed a significantly lower PEF values. The observations are in close agreement with that of earlier studies in Haryanavi adults [1] and another study done over healthy south Indian subjects(4). A higher PEF in younger age group may be explained on the basis of the factors affecting the PEF in general like the elastic recoil of lung tissue, expiratory muscular effort, airway size etc which is reported to be decreased with advancing age more so after 40 years [19]. The decline in PEF per decade increase in age has been reported in various Indian studies which ranged from 20.3 liter/min. to 33.1 liter/min. [20-25]. Present study reported a decline ranging from 38.89 liter/min. to 73.01 liter/min. which may again, be attributed to the active and to some extent difficult routine life of younger age group individuals in the hilly regions who are also the principal bread earners of their family. Body weight is another parameter which affects the PEF to some extent. Lean body mass which is the principal determinant of body weight, also affects the PEF significantly. Lean body mass is reported to decline steadily after 3rd decade of life at the rate of 0.3 kg/year which may accelerate in later life depending upon various factors [26]. This may be one explanation why PEF declines after 40 years of age as reported in the study. Height is another important parameter that affects the PEF values and should be incorporated in the prediction equation for the same. A study conducted in the school children of Maharashtra revealed a significant positive correlation between PEF and anthropometric parameters like height, weight and body Surface Area (BSA) [11]. In a study by Jayanti Mishra et al. in Orissa a positive correlation has been established among PEF, height and weight in young adult males [27]. The prediction equation proposed in the present study addresses the anthropometric parameters that are major determinant of PEF in particular age group (viz. less than or more than 40 years), hence different for subjects of less than 40 years and more than 40 years age group.
Table 3. Bivariate Pearson’s correlation analysis between PEFR and other anthropometric parameters in the two age groups of the study subjects
Variables ≤ 40 years >40 years
R P R P
PEFR vs. age -0.678 & (-0.393 in 25 to ≤ 40 years) 0.001 -0.685 0.001
PFER vs. Wt 0.103 0.097 0.199 0.018
PEFR vs. Ht 0.330 0.001 0.044 0.602
Table 4. Linear and multiple regression in the two age groups of the study subjects
≤ 40 years age group
Age (y) Regression Equation R2 (Coefficient of determination) Significance
25-≤40 633.585 – 4.156 Age 0.154 0.001 25-≤40 388.9-4.2*Age + 1.482*H- 0.190 0.001
>40 years age
Age 632.980- 4.082Age 0.469 0.001
Age and Weight
614.3– 4.0*Age + 0.217* Wt 0.472 0.001
Table 5. Predicted PEF values of Kumaun adult males at different age groups with other Indian authors studies
Age-groups
Present study Kamat et al. (1977) [28]
Malik et al. (1980) [10]
Singh and Pari (1979) [3]
Mahajan et al. (1984) [1]
PEF PEF PEF PEF PEF
l/min l/min l/min l/min l/min
15-19 570.71 487 442 - 453.8
20-24 580.57 502 482 493 506.3
25-30 522.86 506 486 - 493.3
30-35 498.57 505 475 - 471.2
35-40 480.24 497 450 467 464.6
40-45 474 - 417 459 439.6
45-50 426 391 415 - 405.3
50-55 427.14 - 418 458 394.7
55-60 397.86 356 396 - 348.3
The difference in the predicted PEF value based upon this study and that of earlier studies may be attributed to the topographical location of study population which also influences the long term nutritional, genetic and environmental milieu of the population.
6. CONCLUSIONS
In the present study age of the subjects correlated negatively with PEF whereas anthropometric variables showed positive correlation with PEF. Therefore, it can be concluded that in resource limited settings at high altitude, a hand held portable peak flow meter could be a valuable and practical tool for screening pulmonary functions and the prediction equation derived may be used for the population residing in similar geographical region. It was aimed to derive an equation for predicting the normal expected PEF of population residing in a particular geographical area based upon simple anthropometric measures. The idea is to add up in diagnostic and therapeutic arena of respiratory diseases in resource limited settings where many people could not afford sophisticated pulmonary function tests, thus a simple prediction equation based upon anthropometric parameters could
help a primary care physician to analyze the clinical situation without much botheration.
7. LIMITATIONS
The study has not included females, children and elderly population. The relationship of other anthropometric parameters like BMI, chest circumference on PEF in the study subjects has not been studied.
COMPETING INTERESTS
Authors have declared that no competing interests exist.
REFERENCES
1. Mahajan KK, Mahajan SK, Maini BK, Srivastava SC. Peak expiratory flow rate and its prediction formulae in Haryanvis. Indian J Physiol Pharmacol. 1984;28:319-325.
3. Singh HD, Pari S. Peak expiratory flow rate in South Indian Adults. Indian J Physiol Pharmacol. 1979;23:315-320. 4. Jepegnanam V, Amritharaj G,
Damodarasamy S, Madhusudanrao V. Peak expiratory flow rate in random healthy population of Coimbatore. Indian J Physiol Pharmacol. 1996;40:127-133. 5. Pande AN, Pande SH. Dynamic pulmonary
functions in children and their correlation with armspan. Indian J Physiol Pharmacol. 1984;51:541-543.
6. Kashyap S, Puri DS, Bansal SK. Peak expiratory flow rates of healthy tribal children living at high altitudes in the Himalayas. Indian Pediatr. 1992;29:283-286.
7. Mehrotra RP, Verma N, Tiwari S, Kumar P. Pulmonary functions in Indian sportsmen playing different sports. Indian J Physiol Pharmacol. 1998;42:412-416.
8. Mahajan KK, Mahajan SK, Maini BK. Diurnal day to day and seasonal variations in ventilator functions in healthy adults. Indian Med Gazette. 1985;19:76-78. 9. Ambadekar NN, Kandait DW, Vasudeo
ND. Peak expiratory flow rate (PEFR) in Hairdressers. Indian J Physiol Pharmacol. 1999;43:393-397.
10. Malik SK, Jindal SK, Bagga N, Bansal S. Peak expiratory flow rate of healthy North Indian Teachers. Indian J Med Res. 1980; 71:322-324.
11. Aundhakar LD, Kasliwal GK, Vajurveda VS, Rawat MS, Ganeriwal SK, Sangam RN. Pulmonary function tests in school children (Maharashtra). Indian J Physiol Pharmacol. 1985;29:14-20.
12. Bhardwaj P, Poonam K, Jha K, Bano M. Effect of age and bmi on pefr in Indian population. Indian J Physiol Pharmacol. 2014;58(2):166–169.
13. Yue Chen, Donna Rennie, Yvon F Cormier, James Dosman. Waist circumference is associated with pulmonary function in normal weight, over-weight and obese subjects. Am J Clin Nutr. 2007;85:35-9.
14. Bharat Thyagarajan1, David R Jacobs Jr*2,3, George G Apostol4, Lewis J Smith5, Robert L Jensen6, Robert O Crapo6, R Graham Barr7, Cora E Lewis8, O Dale Williams. Longitudinal association of body mass index with lung function: The CARDIA study. Respir Res. 2008;9:31.
15. Saxena Y, Sidhwani G, Upannyu R. Abdominal obesity and pulmonary function in young adults: A prospective study. Indian J Physiol Pharmacol. 2009;53(4): 318-326.
16. Subhanshi AS, Satchidhanandan N. Maximal expiratory flow volume curve in Quarry workers. Indian J Physiol Pharmacol. 2002;46(1):78-84.
17. Ferris BG Jr, Anderson DO, Zickmantel R. Prediction values for screening tests of pulmonary function. Am Rev Respir Dis. 1965;91:252-261.
18. Johansen ZM, Erasmus LD. Clinical spirometry in normal Bantu. Am Rev Respir Dis. 1968;97:584-597.
19. Woolcock AJ, Colman MR, Blackburn CRB. Factors affecting normal values for ventilator function. Am Rev Respir Dis. 1972;196:692-709.
20. Prasad R, Verma SK, Agrawal GG, Mathur N. Prediction model for peak expiratory flow rate in North Indian population. Ind J Chest Dis and Allied Sc. 2006;48:103-6. 21. Kamat SR, Thiruvengadam KV, Rao TL. A
study of pulmonary function among Indians and assessment of wright peak flow meter in relation to spirometry for field use. Am Rev Respir Dis. 1967;96:707-716.
22. John Gunstad, April Lhotsky, Carrington Rice Wendell, Luigi Ferrucci, Alan B Zonderman. Longitudinal Examination Of Obesity And Cognitive Function: Results From The Baltimore Longitudinal Study Of aging. Neuroepidemiology. 2010;34(4): 222–229. Published online 2010 March 18.
DOI: 10.1159/000297742 PMCID: PMC2883839
23. Gupta CK, Mathur N. Statistical models relating peak expiratory flow rate of age, height, weight and sex. J Epidemiol Community Health. 1982;36:64-7.
24. Rastogi SK, Mathur N, Clerk SH. Ventilatory norms in healthy industrial male workers. Indian J Chest Dis and Allied Sci. 1983;25:186-95.
25. Mathur N, Rastogi SK, Husain T, Gupta BN. Lung function norms in healthy working women. Indian J Physiol Pharmacol. 1998;42:245-51.
27. Mishra J, Mishra S, Satpathy S, Magna M, Nayak KP, Mohanty P. Varaition in PEFR among males and females with respect to anthropometric parameters. J Dent Med Sc. 2013;5(1):47-50.
28. Kamat SR, Sarma BS, Raju VRK. Indian norms for Pulmonary function. J Assoc Physicians India. 1977;25:531-40.
_________________________________________________________________________________ © 2015 Poonam et al.; This is an Open Access article distributed under the terms of the Creative Commons Attribution License
(http://creativecommons.org/licenses/by/4.0), which permits unrestricted use, distribution, and reproduction in any medium,
provided the original work is properly cited.
Peer-review history: