A Study on Behaviour of Pedestrian Flow along Sidewalks
G.Akash1, M.John Samuel Raju2
1(M.Tech, Transportation engineering, MVR College of Engineering and Technology)
2(Assistant Professor, MVR College of Engineering and Technology)
ABSTRACT
Pedestrian walking is a major mode of transportation in Indian cities and also effective mode of transportation for short trips. In this study pedestrian sidewalk data was collected from three locations in India. The obtaining three locations data was bi-directional flow unsteady. These data was analyzed for finding pedestrian characteristics like speed, flow and density as well as to draw the fundamental diagrams.
Pedestrian fundamental diagrams and pedestrian characteristics are depends on gender of the pedestrian, age of pedestrian and type of facilities (sidewalks, wide sidewalks and prescient’s). “ pedestrian characteristics, fundamental diagrams for uni-directional flow as well as bi-directional flow, comparison of pedestrian fundamental diagrams between uni-directional and bi-directional flow, capacity and level of service (LOS) for above three sections” was done in this study. Hypothesis testing was conducted for compare the pedestrian speed between different sections and different combinations was done in this study.
Keywords: pedestrians, sidewalks, pedestrian characteristics (speed, flow and density), hypothesis testing, capacity and level of service.
INTRODUCTION
Pedestrian walking is a mode of travel to a given destination on foot. In transportation this type of mode are effectively used for short trips. Walking is a major mode of transportation in middle and low class cities. In transportation many trips are originated and ended walking only. Developing country like India pedestrian walking is a major mode
of transportation. The urban population in India was increased year by year; in 2001 the urban population was 27.81% after 10 years in 2011 this population reached to 31.16% because better facilities for pedestrians have been provided by us. One study told that Tiruchirapalli city 64.7% of the total trips are made on foot (arasan et al., 1994). Another study conducted in Mumbai they can told that all persons walk in a day irrespective of their income (Montgomery, 2006). Because better facilities have been provided for pedestrians are important criteria in urban areas. Now a day the local authorities are interested to provide good pedestrian facilities to encourage walking.
service of pedestrian sidewalk are depends on pedestrian speed, density and flow. Pedestrian walking speed was depends on age of pedestrian, gender and type of facilities. Pedestrian walking speed is more on wide-sidewalk less on precincts. Male pedestrians walking speed is more compare to female pedestrians walking speed. Elder pedestrians speed is less compare to younger pedestrians speed. The thesis has been divided into four chapters, in these four chapters introduction is first one. The second chapter considered past work done on pedestrian sidewalk characteristics, pedestrian dynamics, and models of pedestrian behavior. It can be seen in literature review after this chapter. These literatures have been prepared by reading of many papers and reports of these topics. In chapter 3, I have been describing, experimental set-up, data collection and data decoding in detailed. In this chapter experiments conducted on fundamental diagrams of pedestrian sidewalk and comparison between male and female pedestrians. And also use Z-test to compare between different sets of data collecting from three locations. Next, it concentrates how to affect fundamental diagrams on different pedestrian flows. In chapter 4, presents the results obtained from above analysis and also have graphs obtained from above data analysis. These results are told that how to change pedestrian characteristics like flow, speed and density in different sidewalks and different conditions (age, gender and facilities). In this chapter results and conclusions have been considered by this topic.
METHODOLOGY
In this section trust that the principal factors that affected by pedestrian flow along sidewalks are the gender of pedestrian and direction of pedestrian flow. In this study two types of experiments are conducted. The first type of experiment has conducted the impact of
gender on pedestrian characteristics like speed, flow, density and their relations along sidewalks. This study gives the fundamental diagrams between speed, flow, density and distance headway. Section 3.1 presents the experimental set-up and data collection.
In this chapter methodology for calculating pedestrian sidewalk characteristics like pedestrian speed, flow, density and their relations will be explained by me. Interest to study about this area will be more scope for further research purpose. Till now many researchers have been conducted many studies on this area but further more scope to research in this area. After choosing this study area, experiment will be conducted many places. First of all select different places after that choose which places have more pedestrian crowed. After found this area select a location for data collection. In this section
3.1 present experimental set-up and data collection. Data collection will be conducted in working days only.
Experiments on impact of pedestrian gender on pedestrian characteristics
In this section, experiments conducted and designed to develop fundamental diagrams for pedestrian flow along sidewalks. It may be mentioned here that similar experiments were conducted before this study to develop the fundamental diagrams for different places in India as well as different places in the world. The next subsection will be explained about experimental set-up and details on how data is collected.
the data has collected from three locations in city, first location at daily market. The length of first section, l = 3.0 m and the width of first section w = 1.8 m. these proposed section will be used for data collection. The camera is set at a distance of 2.1 m from the inner edge of the observed section. The camera is fixed above the tripod at proper location, where is the place to cover all four corners of an observed section. The length of second section, l = 3.0 m and the width of second section w =
2.3 m. the length of third section, l = 2.5 m and the width of third section, w = 2.7 m. we select location and fix the experiment area by marking with chalk. The length of the section is 3m and width of section is same as width of sidewalk. Pedestrian speed will be vary less comparatively vehicle speed because data collection section have been taking vary small length. Width of section will be taken same as width of sidewalk. The video camera has rested on tripod, in before tripod will adjust horizontal levelling. After fixing the camera we can write-down the timing after that power on the video camera.
In this study data collection will be done with the help of digital camera (mode: HXR-NX30/NX30P, Make: Sony), Frame rate (25 frames/s) with resolution (640×480) is placed on side of the sidewalk where data collection was done. After data collection put off the video camera after that take data from this video camera.
RESULT AND DISCUSSIONS
The results of this thesis have been dividing into four parts. In this first part results on free flow speed will be presented. In this second part the results on the fundamental relations of pedestrians will be presented. In the third part pedestrian capacity and level of service (LOS) will be presented. In the fourth part influence of pedestrian flow (uni-directional flow and bi- (uni-directional flow)
on fundamental relations of pedestrian flow will be presented.
Study on free flow speed
In this thesis pedestrian free flow speed will be calculated in different locations in city. The free flow speeds will be
mean speed of total pedestrians at location 1 (daily market) is 1.17m/s, mean speed of male pedestrians at location 1 is 1.24m/s and mean speed of female pedestrians is 1.09m/s.
mean speed of total pedestrians at location 2 (daily market) is 1.24m/s, mean speed of male pedestrians at this location is 1.34m/s and mean speed of female pedestrians at this location is 1.14m/s. The above two locations are in the same area but mean speeds of first location have very low comparatively second location. In the first location they have some obstruction are present because pedestrian speeds will be less. In the second section they have no obstruction because pedestrian speeds will be more. Mean speed of total pedestrians at nala road is 1.30m/s, mean speed of male pedestrians at this section is 1.40m/s; mean speed of female pedestrians at this location is 1.21m/s.
Mean speed of total pedestrians at Ambagan market is 1.24m/s, mean speed of male pedestrians at this section is 1.27m/s, mean speed of female pedestrians at this location is 1.20m/s.
Mean speed of total pedestrians at near sector 2 circle is 1.22m/s, mean speed of male pedestrians at this section is 1.26m/s; mean speed of female pedestrians at this location is 1.17m/s.
Pedestrian speed will be more in nala road after that daily market. In maximum mean speed of total pedestrians is 1.30m/s minimum mean speed of total pedestrians is 1.17m/s. maximum mean speed of male pedestrian is 1.40m/s at nala road.
4.1.1 Study on comparison of pedestrian speeds by hypothesis testing
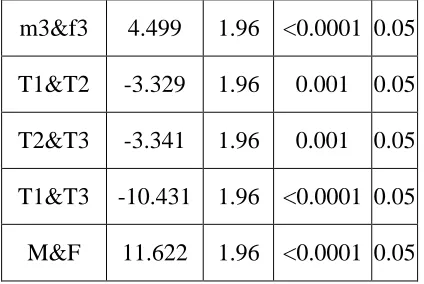
different combinations in above three locations in. In this study first hypothesis test was done to illustrate the pedestrian speed difference between male and female in above all three sections. The combinations was male and female pedestrians at section1 (m1&f1), same as section2 and section3 (m2&f2; m3&f3), male pedestrian speeds between different sections (m1&m2; m2&m3; m3&m1), female pedestrian speeds between different sections (f1&f2; f2&f3; f3&f1), total male speeds in all three locations and total female speeds in all three locations (M&F), all pedestrian speeds between these three locations (section1§ion2; section2§ion3; section3§ion1). In this study speed will be compared in above all combinations in the three sections. The results will be found after hypothesis testing is present in bellow tabular form. In the results m2&m3 combination was got Zobserved value is less than Zcritical value because cannot reject the null hypothesis H0.
Z-test results for all combinations in above all three locations
combinati on
z(Observ ed value)
|z| (Critic
al value)
p-value(Tw
o-tailed) alph
a
f1&f2 -2.128 1.96 0.033 0.05
f1&f3 -9.015 1.96 <0.0001 0.05
f2&f3 -3.89 1.96 0 0.05
m1&m2 -3.519 1.96 0 0.05
m1&m3 -7.104 1.96 <0.0001 0.05
m2&m3 -0.95 1.96 0.342 0.05
m1&f1 10.882 1.96 <0.0001 0.05
m2&f2 5.237 1.96 <0.0001 0.05
m3&f3 4.499 1.96 <0.0001 0.05
T1&T2 -3.329 1.96 0.001 0.05
T2&T3 -3.341 1.96 0.001 0.05
T1&T3 -10.431 1.96 <0.0001 0.05
M&F 11.622 1.96 <0.0001 0.05
Study on fundamental relations
The speed(u)-density(k), flow(q)-density(k), speed(u)-flow(q) curves will be plotted data obtaining from above three locations (fig 3.1, fig 3.2, fig 3.3).
Figure 4.1: (a) speed-density (u-k) (b) speed-distance headway (u-h) (c) flow-density (q-k)
speed-flow (u-q) these fundamental diagrams are drawn data obtaining from location 1 at daily market in.
As a flow versus density data, this plot is shown in figure 4.1 (c), a visual inspection of the
and intercept is 0.4548m. The relationship of the form h = a+b*u is fitted to the data. The value of a and b obtained are 0.4548m and 3.6489, a represents the minimum personal space and b denotes the sensitivity of h to u. From the above fundamental diagram speed versus density curve represents density of pedestrian flow increase at the same time pedestrian speed will decrease, at which place pedestrian speed will be zero at that place density will be jam density (kjam). In the same time where the density will minimum, at that place speed will maximum.
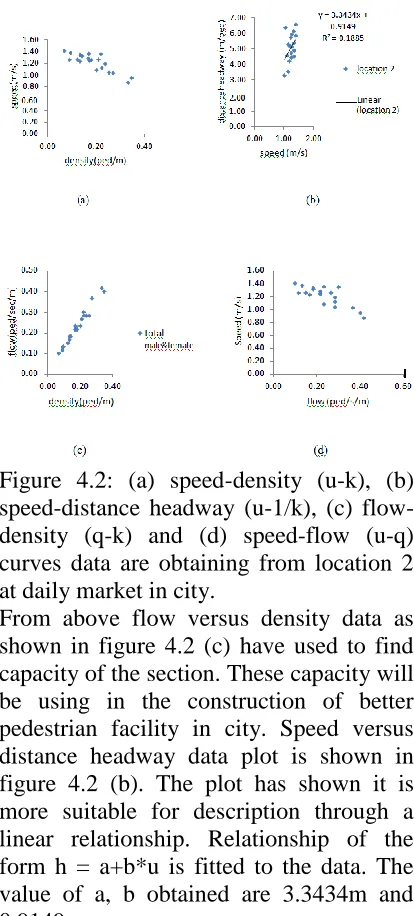
Figure 4.2: (a) speed-density (u-k), (b) speed-distance headway (u-1/k), (c) flow-density (q-k) and (d) speed-flow (u-q) curves data are obtaining from location 2 at daily market in city.
From above flow versus density data as shown in figure 4.2 (c) have used to find capacity of the section. These capacity will be using in the construction of better pedestrian facility in city. Speed versus distance headway data plot is shown in figure 4.2 (b). The plot has shown it is more suitable for description through a linear relationship. Relationship of the form h = a+b*u is fitted to the data. The value of a, b obtained are 3.3434m and 0.9149s.
Figure 4.3: (a) speed-density (u-k), (b) speed-distance headway (u-1/k), (c) flow-density (q-k) and (d) speed-flow (u-q) curves data are obtaining from location 2 at daily market in city.
From above flow versus density data as shown in figure 4.3 (c) have used to find capacity of the section. These capacity will be using in the construction of better pedestrian facility in city. Speed versus distance headway data plot is shown in figure 4.3 (b). The plot has shown it is more suitable for description through a linear relationship. Relationship of the form h = a+b*u is fitted to the data. The value of a, b obtained are 2.4215m and 1.4111s.
The above all fundamental diagrams are representing to pedestrian characteristics in section 1, 2 and 3. Pedestrian speed has more at section 3 and speed has less at section 1, these points are concluded with using speed verses distance headway diagrams in above all three sections. From speed verses distance headway diagram intercept at section 1 is 3.6489m, at section 2 is 3.3434m and at section 3 is 1.4111m because intercept has been increased at that time pedestrian flow will be increased at that time pedestrian speed will be increased.
locat ion
Avg.sp eed
(m/s)
Max.flow/ca pacity
(ped/min) Dens
ity
(ped/ m)
Slop e
Interc ept
1 1.17 24 0.42 3.64 89
0.454 8
2 1.24 26 0.36 3.34 343
0.914 9
3 1.30 30 0.44 2.42 15
1.411 1
Study on Pedestrian Uni-Directional and Bi-Directional Flow
In this study how pedestrian fundamental diagram was influenced due to pedestrian uni- directional and bi-directional flow has been explained. In this study collect two different types of data sets, first data set have been taken above three locations data (bi-directional) next second data set have been taken L. A. data (uni-directional). After collecting data calculate pedestrian characteristics like speed, flow, and density after that fundamental diagrams also calculated individually for two types of data sets, after that these two fundamental diagrams are drawn in one sheet. In this study uni-directional flow has more capacity and pedestrian characteristics (speed, flow and density) comparatively bi-directional flow.
4.4.1 Comparison of pedestrian fundamental diagram between uni-directional and bi- uni-directional flow at daily market (section 1).
specific density values speed of pedestrians in uni-directional flow will be more comparatively speed of pedestrians in bi-directional flow. Figure 4.4.1 (b) speed versus distance headway diagram represents intercept of bi-directional flow will be 0.2097 and intercept of uni-directional flow will be 0.1464.
4.4.2 Comparison of pedestrian fundamental diagram between uni-directional and bi- uni-directional flow at daily market (section 2).
Figure 4.6 flow-density (q-k); density (u-k); flow (u-q); speed-distance headway (u-1/k) curves data are obtaining from nala road and L. A. Hall The above figures data are obtained from pedestrian uni-directional flow and pedestrian bi- directional flow in city. The above all diagrams have been explained pedestrian speed, flow and density values are more in uni-directional flow comparatively bi-directional flow. Pedestrian flow versus density curve have been explained, initially uni-directional and bi-directional flow curves will be coincide, after that uni-directional flow will be more comparatively bi-directional flow. Pedestrian speed versus density
curve also represents uni- directional flow line will be present above the bi-directional flow line, in this figure at any specific density values speed of pedestrians in uni-directional flow will be more comparatively speed of pedestrians in bi-directional flow. Figure 4.4.3 (d) speed versus distance headway diagram represents intercept of bi-directional flow will be 0.0894 and intercept of uni-directional flow will be 0.1464. Slope of bi-directional flow will be 2.1086 and slope of uni-directional flow will be 1.3802.The above three sets of graphs represents the comparison of pedestrian fundamental diagrams between uni-directional flow and bi-uni-directional flow. Flow verses density diagrams in above all sets will be look like in the same pattern, the pattern will be initially both uni-directional and bi-uni-directional flow curves coincides up to some portion after that uni-directional curve present above the bidirectional curve.
The above comparisons of uni-directional and bi-directional pedestrian flow fundamental diagrams will be classified in to three sets, in the first set fundamental diagram was drawn data obtaining from L.A.Hall versus location1 data obtaining from daily market. Second set fundamental diagrams was drawn data obtaining from L.A.Hall verses location2 data obtaining from daily market in similarly third set was obtaining from L.A.Hall data verses nala road data in city.
Bellow table was shown slope and intercept of uni-directional and bi-directional pedestrian flow obtaining from above three sets (fig 4.4; 4.5; 4.6) of pedestrian fundamental diagrams.
Table 4.4 slopes and intercepts for uni-directional and bi-uni-directional flow
Fundame ntal diagram
sets
Uni-directional flow
Bi-directional flow slop
e
interc ept
spe ed
slop e
interc ept
spe ed
1 1.38 02
0.146 4
1.0 2
1.29 2
0.209 7
2 1.38 02
0.146 4
1.0 2
2.17 48
0.013 4
1.2 5
3 1.38 02
0.146 4
1.0 2
1.77 85
0.443 3
1.2 1 CONCLUSIONS
In this study experiments conducted on pedestrian flow behaviour along the sidewalks in different places in city and also experiment conducted on pedestrian characteristics variations in pedestrian uni-directional flow and pedestrian bi-directional flow. From this study results male pedestrian speeds are more, comparatively female pedestrian speeds in above all three sections. In this study pedestrian average speed are more in nala road (section
3) less in daily market (section1). Nala road has more pedestrian sidewalk width comparatively remaining sections and also sidewalk surface will be even because pedestriansidewalk will be more in nala road. Hypothesis test will be conducted in different combination of pedestrians in different sections, male pedestrian speeds at section2 and section3 will be similar because observed value is in between Z-critical value, this combination will be significant. In this study pedestrian uni-directional flow will be get maximum flow (capacity) comparatively pedestrian bi-directional flow. Pedestrian flow versus density graph initially these two (uni and bi-directional flow) lines will be coincides after that uni-directional flow line has above the bi-directional flow line.
REFERENCES
Hankin, B.D. and Wright, R.A. (1958). Passenger Flow in
Subways. Operational Research
Quarterly, 9(2), pp. 81–88.
Oeding, D. (1963).
Verkehrsbelastung und
Dimensionierung von Gehwegen
und Anderen Anlagen des
Fußgängerverkehrs. Tech. Rep.
Forschungsbericht 22, Technische Hochschule Braunschweig.
Older, S.J. (1968). Movement of
Pedestrians on Footways in
Shopping Streets. Traffic
Engineering and Control, 10(4), pp. 160–163.
Navin, F.P.D. and Wheeler, R.J. (1969). Pedestrian Flow
Characteristics. Traffic
Engineering, 39(9), pp. 30–36.
Mori, M. and Tsukaguchi, H. (1987). A New Method for Evaluation of Level of Service in
Pedestrian Facilities.
Transportation Research Part A, 21A (3), pp. 223– 234.
Weidmann, U. (1993).
Transporttechnik der Fußgängers. Tech. Rep. 90, Institut für Verkehrsplanung,
Transporttechnik, Strassen und Eisenbahnbau, Zürich.
Seyfried, A., Steffen, B., Klingsch, W. and Boltes, M. (2005). The
Fundamental Diagram of
Pedestrian Movement Revisited. Journal of Statistical Mechanics: Theory and Experiment, P10002.
Helbing, D., Johansson, A. and Al-Abideen, H.Z. (2007). Dynamics of Crowd Disasters: An Empirical Study. Physical Review E, 75(4), pp. 046109 (1–7).
Polus, A., Joseph, J.L. and Ushpiz, A. (1983). Pedestrian Flow and Level of Service.
Journal of Transportation Engineering, ASCE, 109(1), pp. 46–56.
Hoogendoorn, S.P. and Daamen, W. (2005). Pedestrian Behavior at Bottlenecks.
Transportation Science, 39(2), pp. 147–159.
Seyfried, A., Passon, O., Steffen, B., Boltes, M., Rupprecht, T. and Klingsch, W. (2009). New Insights into Pedestrian Flow through
Bottlenecks. Transportation
Henderson, L.F. and Lyons, D.J. (1972). Sexual Differences in
Human Crowd Motion.
Nature, 240(5380), pp. 353–355.
Young, S.B. (1999). Evaluation of Pedestrian Walking Speeds in Airport Terminals.
Transportation Research Record, 1674, Transportation Research Board, National Research Council, Washington, DC, USA, pp. 20–26.
Morrall, J.F., Ratnayake, L.L. and Seneviratne, P.N. (1991).
Comparison of CBD Pedestrian Characteristics in Canada and Sri Lanka. Transportation Research Record, 1294, Transportation Research Board, National Research Council, Washington, DC, USA, pp. 57–61.
Isobe, M., Adachi, T. and Nagatani, T. (2004). Experiment and Simulation of Pedestrian Counter Flow. Physica A, 336(3–4), pp. 638–650.
Kretz, T., Gruenebohm, A., Kaufman, M., Mazur, F. and Schreckenberg, M. (2006).
Experimental Study of Pedestrian Counterflow in a Corridor. Journal of Statistical Mechanics: Theory and Experiment, P10001.
Hoogendoorn, S.P. and Daamen, W. (2004). Self–Organization in
Walker Experiments. In
Proceedings of the 5th Symposium on Traffic and Granular Flow, (Eds.: Hoogendoorn, S.P., Luding, S., Bovy, P.H.L., Schreckenberg, M. and Wolf, D.E.), Springer, Delft, the Netherlands, pp. 121– 132.
Helbing, D., Bunza, L., Johansson, A. and Werner, T. (2005). Self
Organized Pedestrian Crowd
Dynamics: Experiments,
Simulations and Design Solutions. Transportation Science, 39(1), pp.
1–24.
Rastogi, R., Ilango, T. and Chandra, S. (2011a). Design Implications of Walking Speed for Pedestrian Facilities, Journal of Transportation Engineering, ASCE, 137(10), pp. 687-696.
Rastogi, R., Chandra, S., Vamsheedhar, J. and Das, V. (2011b) Parametric study of pedestrian speeds at midblock
crossings. Journal of Urban
Planning and Development, ASCE, 137(4), pp. 381-389.
Sahani R., Bhuyan P. (2013). Level of Service Criteria of off-street Pedestrian Facilities in Indian Context using Affinity Propagation Clustering. Procedia Social and Behavioral Sciences (104), Elsevier, Agra, India, pp. 718–727.
Chattaraj, U., Seyfried, A. and Chakroborty, P. (2009).
Comparison of Pedestrian
Fundamental Diagram Across
Cultures. Advances in Complex systems, 12(3), pp. 393–405.
Chattaraj, U., Chakroborty, P. and Seyfried, A. (2010). Empirical Studies on Pedestrian Motion Through Corridors of Different Geometries. In Proceedings of the 89th Annual Meeting of the Transportation Research Board, Washington, D.C, USA.
Chattaraj, U. (2011).
Understanding Pedestrian Motion: Experiments and Modelling.
Chattaraj U., Seyfried A., Chakroborty P.,Biswal M. (2013a).
Modelling single file pedestrian motion across cultures. Procedia Social and Behavioral Sciences (104), Elsevier, Agra, India, pp. 698–707.
Flow. Procedia Social and Behavioral Sciences (104), Elsevier, Agra, India, pp. 668–677.