Available online: https://pen2print.org/index.php/ijr/ P a g e | 388
A Movement Decomposition And Knn-Based Fall Detection
1Haseeba N A & 2Liston Deva Glindis
1Master Of Engineering, Dept. of CSE, Dhanalakshmi Srinivasan College Of Engineering,
Coimbatore, India, Mail Id:- [email protected]
2Assistant Professor, Dept. of CSE,Dhanalakshmi Srinivasan College Of Engineering,
Coimbatore, India,Mail Id: [email protected]
Abstract
Aging in people makes them vulnerable to
falls and this has become a universal
problematic fitness issue. Literature
provides several resolutions for the
recognition of falls among which the wrist
worn strategies are included as part of
improving the output and efficacy more than
that of 95%. In accordance with the theory
of comfortability in the aged people, wrist is
considered as the most effective area
proposed for the equipment to be placed. So,
the paper puts forward the idea of an
apparatus to solve the mentioned issue of
fall recognition. Diverse sensing units
(accelerometer, gyroscope, and
magnetometer), along with the indicators
(acceleration, velocity, and displacement),
and track apparatuses (vertical and
nonvertical) are collectively used in addition
to wide-ranging group of approaches
involving threshold-based and machine
learning theories. Therefore, it was possible
to achieve superlative tactic in terms of
recognizing falls. 22 individuals were
chosen to learn the activities leading to fall
and non-fall movements. In case of the
procedures handling threshold-based idea, a
maximum accuracy of 91.1% of highest
exactness got accomplished in association
with the acquired values of 95.8% and
86.5% in the cases of sensitivity and
specificity, respectively consuming
Madgwick’s decomposition. About 99.0%
exactness was realized by considering the
identical movement decomposition and
machine learning methods during the
sorting period. Sensitivity and specificity
were of 100% and 97.9% respectively with
the established statistics.
Keywords:- Acceleration, Falls, NO- Falls,
MLM.
1. INTRODUCTION
The average age of the world population is
Available online: https://pen2print.org/index.php/ijr/ P a g e | 389 2015 Report for World Population Ageing,
between 2015 and 2030, the number of
people aged 60 years old and over is
expected to grow by 56%. One of the most
severe problems faced by elderly people is
the risk of falling. Around 30% of people
aged of 65 and over fall every single year.
For the range of people with 85 years and
over this number reaches 50%. Further, the
fall recurrence is also a relevant fact. Data
from emergency department visitors are
evaluated, identifying that 22.6% of the
elderly fall victims suffered at least one new
fall in six months. The recurrence is also
strengthened by psychological reasons. The
fear of falling and low confidence reduces
elderly mobility, leading to a decreased
quality of life and increased risk for new
falls.
In order to minimize the “time to help” and
fall consequences, several devices have been
developed to enable the family notification
of elderly emergency situations. The fall
detection is normally done through many
different technologies. The most common
one is to acquire motion information using
an inertial measurement unit (IMU). IMUs
are used to detect and measure a body
movement with the combination of two or
more sensors. Typically, an IMU is
comprised of an accelerometer and a
gyroscope attached to the body of a person,
but other sensors such as magnetometer and
barometer can be included to increase the
movement estimation. Using IMU data,
different methods can be used to distinguish
between fall and non-fall events. In this
context, threshold-based and machine
learning methods can be highlighted as the
most frequently used classifiers for fall
detection. Fall detection methods based on
thresholds are very common, due to the
expected physical impact related to falls.
Different approaches for threshold setup on
fall detection solutions using
accelerometer-based method are evaluated. The tests were
performed considering the best specificity
for an ideal sensitivity (100%) in three
different body places: waist, head and wrist.
Evaluating the solution with data acquired
from two subjects who performed fall and
Activities of Daily Life (ADLs), it was
possible to achieve 100% of accuracy for the
solution located at head, but only 75% at
wrist. On the other hand, a threshold-based
method for fall detection using the
combination of accelerometer, gyroscope
Available online: https://pen2print.org/index.php/ijr/ P a g e | 390 device at user’s waist, the system was able
to identify different characteristics of a fall
event, including pre-fall analysis and
aftermath position. The applied sensor
fusion algorithm was the Madgwick’s
method, a simplification of Kalman-filter
approach. Tests were performed with ten
volunteers and the highest accuracy
presented was 90.37%.
2. TECHNOLOGIES USED
The system has two sets of approach
including the hardware system based on
Arduino UNO and a software simulation
with MATLAB. This work proposes a fall
detector based on a wrist-located wearable
device using IMU technology
(accelerometer, gyroscope and
magnetometer) that presents a reliable
classification accuracy, i.e., sensitivity of
100% and specificity equal or higher than
95% for fall detection, resulting in a final
accuracy higher than 95%. Additionally, an
extensive analysis of the spatial orientation
and movement decomposition in vertical
and non-vertical components as a feature
extraction stage for fall detection is
proposed. Besides that, different
classification methods based on threshold
analysis and machine learning classifiers are
compared, resulting in a suitable feature
extraction and classification method for fall
detection using a wrist wearable device.
Figure 1 Overview of the system
3. IMPLEMENTATION
For the movement signals acquisition, the
GY-80 IMU device designed for embedded
system application was employed. This IMU
is comprised of a triaxial accelerometer
(ADXL345 model), a triaxial gyroscope
(L3G4200D model), and a triaxial
magnetometer (HMC5883L model). The
ADXL345 (Analog Devices, Norwood, MA,
USA) is a low power digital accelerometer
(i.e., 23 μA and 0.1 μA in measurement and
standby mode, respectively) capable of
triaxial measurement in ranges from ±2G to
±16G with a sample rate up to 3200Hz. The
L3G4200D (ST Microelectronics, Geneva,
Switzerland) offers a triaxial angular
velocity measurement in three different
scales: 250, 500 and 2000 degrees per
second. Its 16-bit resolution allows a
Available online: https://pen2print.org/index.php/ijr/ P a g e | 391 available sampling rate (from 100Hz to
800Hz), allowing a proper configuration for
each application. The HMC5883L
(Honeywell, Morris Plains, NJ, USA) is a
triaxial magnetometer reliable for low
magnetic field measurements and able to
achieve sampling rates up to 160Hz, with a
12-bit resolution and sensor field range of
±8Gauss.
The accelerometer, gyroscope and
magnetometer signals were acquired from
different volunteers simulating six fall and
six non-fall activities as follow:
Falls: forward fall, backward fall, sideways
fall (to the side with the device), sideways
fall (to the side without the device), fall after
rotating the waist clockwise, and fall after
rotating the waist counterclockwise;
Non-Falls: walking, clapping hands,
opening and closing a door, moving an
object, tying shoes, and sitting on a chair.
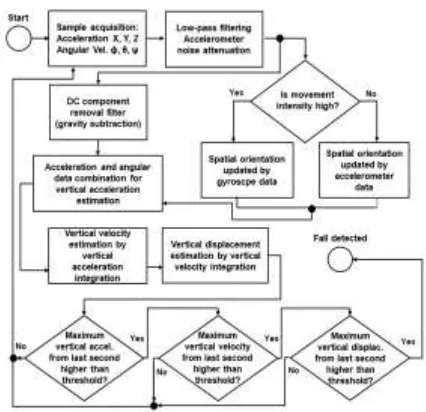
Figure 2 Flow chart of threshold-based
method
To identify the best combination of signals,
configuration parameters and thresholds
results in the best TBM fall detection
outcome, a comprehensive set of evaluations
was carried out. The following six signals
where evaluated to find the most relevant
signals for the TBM:
• Total acceleration (TA) assuming the
gravity removal;
• Vertical acceleration (VA) obtained from
TA, considering vertical components only;
Total velocity (TV) obtained from VA after
time window integration of TA;
• Vertical velocity (VV) obtained from time
window integration of VA;
• Total displacement (TD) from time
Available online: https://pen2print.org/index.php/ijr/ P a g e | 392 • Vertical displacement (VD) obtained from
time window integration of VV.
A few parameter setting also plays an
important role in the results. Therefore, tests
were performed to find the best value choice
for the following parameters:
• Time window for acceleration magnitude
(TWAM): the time window size applied on
the first time integration of the acceleration,
allowing the selection of the spatial
orientation data source (accelerometer or
gyroscope);
• Lowest Acceleration Value (LAV): the
smallest acceleration used for spatial
orientation estimation. For values below
LAV, the gyroscope data is used instead;
• Acceleration time window integration
(ATWI): the time window size applied in
the time integration of the acceleration (both
TA and VA) to calculate velocity;
• Velocity time window integration (VTWI):
the time window size applied in the time
integration of the velocity (both TV and
VV) to calculate displacement.
For the parameters investigation, an
evaluation is performed for: four different
values for TWAM, five for LAV, five for
ATWI, and five for VTWI. Therefore, a
total of 500 different parameters
combinations were tested.
For the threshold evaluation analysis, 500
threshold values where evaluated for each of
the signals, starting with a threshold where
100% of sensitivity is achieved and finishing
on a threshold where 100% of specificity is
achieved. Additionally, several signal
combinations were evaluated: fifteen2-by-2
signal sets, twenty 3-by-3 sets; fifteen
4-by-4 sets; six 5-by-5; and one 6-signals set.
Threshold-Based Method With
Madgwick’s Decomposition (TBM-MD)
The Madgwick’s Decomposition method
using accelerometer, gyroscope and
magnetometer data to calculate the unit
quaternion related to the spatial orientation
of a body presented in [9] was also
evaluated. The quaternion ˆq = [q1 q2 q3 q4]
is a four-dimensional number, where q1 is
the scalar part and q2, q3 and q4 are the
vector parts of a 4-D complex number.
Spatial orientation can be calculated from
the quaternion, allowing the identification of
fall detection angles in all three axes. The
quaternion orientation estimation at time t
(i.e., qest,t )
is computed using equation (1):
Available online: https://pen2print.org/index.php/ijr/ P a g e | 393
The ˆqest,t-1 is the estimate of the orientation
at a discrete time previous to T. The ˙qest,t is
the estimated orientation rate and ∆t is the
sampling period, here considered 10ms. The
estimated orientation rate, ˙qest,t, is
calculated by subtracting the gyroscope
orientation rate from the magnitude of
gyroscope measurement error, in the
direction provided by accelerometer and
magnetometer data. Given the quaternion
qest,t the Yaw, Pitch and Roll angles are
given in equations (2), (3) and (4),
respectively:
The advantage of this decomposition is that
it provides compensation for magnetic
distortion and gyroscope bias drift, besides
the significant reduction in computational
complexity, when compared to conventional
sensors fusion methods, such as the Kalman
filter [8], [9].
By applying the Madgwick’s method, the
vertical component of acceleration is
computed differently from TBM
decomposition and therefore, velocity and
displacement might present different results.
Figure 3 presents a flow chart related to the
proposed TBM-MD. The TBM-MD is
evaluated with the same threshold, signals
and parameters selection from TBM,
presented in Section II-B, to allow proper
comparisons.
4. PROPOSED SYSTEM
Machine Learning Methods (MLM)
The classification process with MLM
includes two stages: feature extraction and
the classification itself. Regarding the
features, three different scenarios were
evaluated. Initially, considering only the
accelerometer data, the selected features
were the mean and maximum values of the
TA, TV and TD signals. Also, the (TA, TV),
(TA, TD), (TV, TD), and (TA, TV, TD)
combinations of the signals were evaluated.
These tests allowed an evaluation of the
classification methods when no movement
decomposition was applied to the signals.
Then, the tests were performed including the
gyroscope data. So, the same movement
decomposition applied to the
threshold-based methods was applied to MLM,
allowing vertical components for feature
extraction. In this case, the selected features
were the mean and maximum values of VA,
Available online: https://pen2print.org/index.php/ijr/ P a g e | 394 (VA, VD), (VV, VD), and (VA, VV, VD)
were also evaluated.
Lastly, the magnetometer information was
included in the analysis. The Madgwick’s
method was also employed, offering a more
reliable movement decomposition. Thus, the
selected features for the MLM were the
mean and maximum values of VA, VV and
VD, but considering Madgwick’s method
spatial orientation. The combinations (VA,
VV), (VA, VD), (VV, VD), and (VA, VV,
VD) were also evaluated. Additionally, with
the Madgwick’s decomposition, it is
possible to include the three angles related
to the device spatial orientation, i.e., Yaw,
Pitch and Roll. With that, some tests were
performed considering the mean of sine and
cosine of these angles. This information
was also combined with the mean and
maximum of the VA, VV and VD values,
resulting in twelve features for classifiers
evaluation. Regarding the classification
methods, five of the most used
machine learning methods for fall detection
were evaluated in this work, such as:
• k-Nearest-Neighbors (k-NN): new cases
are classified according to their similarity, in
terms of Euclidean distance, to the training
examples. Therefore, the object is assigned
to the class most common among its
k-nearest neighbors.
• Linear Discriminant Analysis (LDA): this
method reduces the data to a lower
dimensional space, maximizing the
separation between classes, in order to
reduce its complexity and required
processing resource, as well as to avoid the
possibility of overfitting.
• Logistic Regression (LR): this approach
works with the relationship between the
proper classification for a dataset and the
different features evaluated from it, by
estimating probabilities using a logistic
distribution.
• Decision Tree (DT): DTs may be
considered one of the most common method
for fall detection solution presented in the
literature. In a DT-based method, different
binary classifications are performed,
considering different input features. These
classifications are concatenated in a tree
structure, where each node concerns about
each variable and parameter evaluation. In
the end, a combination of different
evaluations is performed in order to obtain
the final class label.
• Support Vector Machine (SVM): SVM
Available online: https://pen2print.org/index.php/ijr/ P a g e | 395 paradigm known as statistical learning. The
discrimination between pairs of classes is
performed using a maximal margin classifier
that is obtained by solving a convex
optimization problem. Additionally, SVMs
can be built in a non-linear approach, using
Mercer Kernels. In this work, the Gaussian
kernel was selected. The training and testing
sets are the same applied for the TBM and
TBM-MD algorithms. In all experiments,
the training examples are used to adjust the
parameters for each
classifier, by applying a five-fold
cross-validation, following the procedure
presented.With the best set of parameters
defined with the training set, each classifier
was evaluated for the testing set, allowing a
proper comparison among TBM, TBM-MD
and MLM.
DISADVANTAGES
The system can give false alarms
Practically, it can be ineffective
Wrist wearing can be a disturbance
5. EXPERMENTAL RESULTS
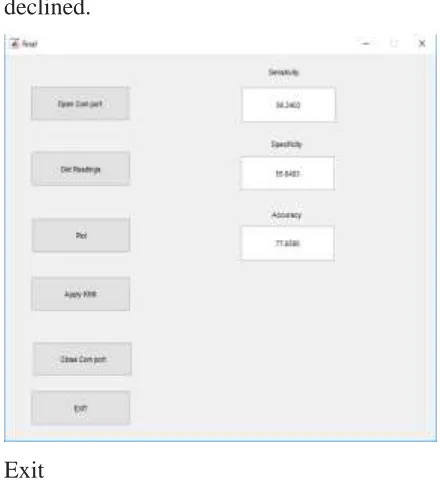
Modules incorporated in the MATLAB
portion is described below.
Open Com Port
The Arduino com port is opened in this step.
Port opening is required to take readings
from the sensor connected to the Arduino
Due. The sensor values are imported into
MATLAB. A message is displayed in the
command window regarding the opening of
Available online: https://pen2print.org/index.php/ijr/ P a g e | 396 Get Readings
Readings are collected from the sensor and a
message is displayed in the MATLAB
command window after the readings are
read from the port of Arduino.
Plot
The plot module enables plotting of graph
based on the readings from the sensor
collected from the Arduino. Message comes
to the command window of MATRLAB
after plotting the graph.
Apply KNN
Available online: https://pen2print.org/index.php/ijr/ P a g e | 397
corresponding values are displayed over the command window.
Close Com Port
The close com port option stops reading
from the Arduino and the process is
declined.
Exit
This step gives exit for the user to come out
of the system. Represents the end of the
system.
6. RESULTS AND DISCUSSIONS
In this section, the results and comparisons
for each proposed method (TBM, TBM-MD
and MLM) using the test set are presented.
Table I presents the best results for the
TBM, considering the threshold, signals and
parameters selection.
Table 1 Evaluation of different signal com
bination for TBM
The combination of total acceleration and
total velocity presents the best results with
95.8% of sensitivity and 82.3% of
specificity. A similar result is obtained when
the vertical acceleration is included. Since
the movement decomposition proposed for
the TBM employs only accelerometer and
gyroscope data, the results for vertical
components of movement may present
gimbal lock effect, and a better evaluation
can be done through the employment of a
magnetometer device and Madgwick’s
decomposition. In order to illustrate such a
Available online: https://pen2print.org/index.php/ijr/ P a g e | 398 Madgwick’s method contribution in the
movement decomposition.
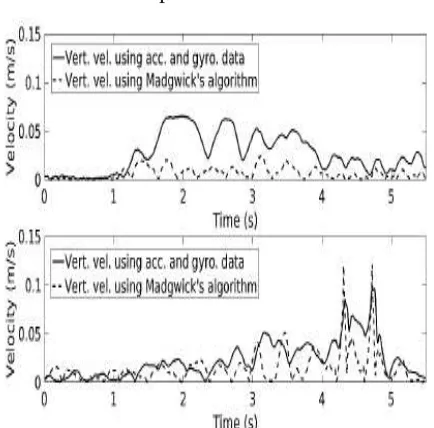
Figure 3 Comparison between two different
movement decomposition
For a non-fall signal (top), where less
vertical movement is involved, the
calculated vertical velocity must present
lower values than total. In that figure, a
better damping effect of the Madgwick’s
method is evidenced. On the other hand,
when a fall signal (bottom) is evaluated, a
higher vertical component is expected to be
measured. In the figure, the vertical velocity
peak values between four and five seconds
are still highlighted, while for the
decomposition method based on acceleration
and gyroscope data only, the peak values are
damped. The difference between four and
five seconds for fall and non-fall signals
emphasizes the relevance of the Madgwick’s
method for movement decomposition,
particularly for classification methods based
on threshold comparison, since the peak
values are greater and better characterized
using Madgwick’s decomposition. In order
to evaluate the possibility of increasing fall
detection accuracy by combining
threshold-based algorithms withMadgwick’s method
for spatial orientation calculation, all the
configurations presented in Table I, i.e. best
results for threshold-based method
employing accelerometer and gyroscope
data (TBM), were trained and tested
including magnetometer data and
Madgwick’s decomposition (TBM-MD).
Initially, the combination VA and TV was
evaluated and results are presented in Table
2.
Table 2 Evaluation of different signal
combinations for TBM MD
Comparing it with the previously achieved
Available online: https://pen2print.org/index.php/ijr/ P a g e | 399 sensitivity with a higher specificity is
observed. For the same configuration used
in TBM, the accuracy was increased from
87.0% to 91.1% in TBM-MD. Then, the
algorithm was trained and tested with the
(TA, VA, TV) configuration. The achieved
results were exactly the same than those
presented in Table I. That happened because
the TA information did not add any relevant
information to the final classification
process. So, it was not possible to increase
either sensitivity or specificity. A similar
result is observed for (TA, TV) and (TV)
combinations.
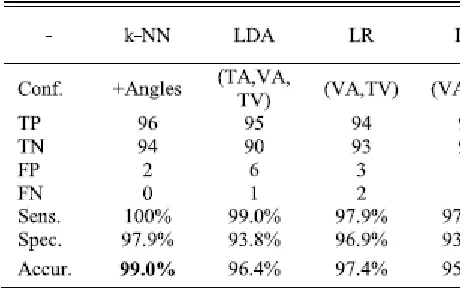
Table 3 EValuation of different signal
combination for MLM
Finally, the same configuration approached
in the initial threshold-based algorithm (VA,
VV, VD) was trained and tested again, in
order to evaluate the evolution of this
combination. The results are also presented
in Table 2. The achieved accuracy rate was
88%, a bit higher than the 84.4% presented
in Table I. Similar to the VA, TV
combination results, Madgwick’s algorithm
did not present an increase in sensitivity, but
only in specificity rate. Despite the
improvement on the fall detection accuracy,
TBM-MD was not able to allow the
proposed threshold method to achieve an
ideal sensitivity (100%) and the desired
specificity (larger than 95%). Even
employing the magnetometer data, the
highest accuracy achieved was 91.1%. The
misclassifications mainly included forward
falls and falls with waist rotating movements
that were classified as non-falls.
Such misclassifications occurred only in
8.3% of the analyzed signals. Additionally,
the ADL related to clapping hands was
classified as fall in 81.2% of the evaluated
cases, being the movement with worst
classification accuracy. When a person claps
hands, although the main part of the wrist
acceleration is parallel to the ground, some
acceleration peaks may also be measured in
all three directions as a consequence of the
physical impact. So, the employed threshold
method is not efficient to distinguish these
Available online: https://pen2print.org/index.php/ijr/ P a g e | 400 events. In order to circumvent this
limitation, we propose the use of machine
learning classifiers combined with
Madgwick’s decomposition (MLM). The
best results for the MLM evaluated
configurations are presented in Table 3.
The configuration “+Angles” corresponds to
the sine and cosine means from the three
angles related to the device spatial
orientation, additionally to the mean and
maximum values of the vertical acceleration,
velocity and displacement values calculated
with the Madgwick’s method. Such an
angular information appeared to be more
relevant for K-Nearest Neighbors method,
allowing it to achieve 100% and 97.9% of
sensitivity and specificity, respectively.
Logistic Regression and SVM methods also
presented relevant results: both achieved
97.4% of accuracy. LDA and Decision Tree
methods presented considerably better
results than those achieved by the
threshold-based algorithms. Although K-Nearest
Neighbors method required more input data
to achieve this result (i.e., VA, VV, VD and
spatial orientation angles), even when only
accelerometer data was employed, relevant
results can be achieved. For instance, the
Logistic Regression method was able to
achieve 97.9% and 95.8% of sensitivity and
specificity, respectively, using only the
maximum values information from
accelerometer.
The misclassifications for the best model
(k-NN with VA, VV, VD, and spatial
orientation angles) included sitting on a
chair and tying shoes. Such ADLs were
classified as falls in 6.25% of the evaluated
signals. This result is related to the number
of neighbors selected through the applied
fivefold cross-validation process, which was
one for lowest crossvalidation error,
resulting in the nearest neighbor classifier.
When only one neighbor is considered,
misclassifications can occur, since falls and
non-falls present overlap regions (classes are
not linearly separable) in this
twelve-dimensional feature space. By increasing the
number of neighbors, such
misclassifications can be corrected, but
others may occur, such as falls that are
classified as ADLs, which correspond to a
more critical error from the final solution
Available online: https://pen2print.org/index.php/ijr/ P a g e | 401
Table 4 Comparison of different IMU and
weist- based fall detection solution
Table IV presents a brief summary of
several IMU-based fall detection solutions
located at wrist described in the literature.
The results are expressed according to the
reported accuracy. The best reported result
was obtained, whose main proposal is a fall
detection and ADL classification using only
a digital accelerometer. The results
presented in this work are potentially an
improvement compared to those presented
considering our data set. The lack of a
standard protocol hampers a proper
comparison, but one can state that the
inclusion of the gyroscope and
magnetometer data combined with
acceleration, velocity and displacement
signals applying movement components
decomposition (vertical and non-vertical)
and machine learning classifiers can
improve the overall performance to achieve
ideal sensitivity (100%) and specificity
larger than 95%. Finally, the proposed fall
detector was evaluated for prolonged
periods using the best threshold-based
method and the machine learning
approaches, as presented, but with more
ADLs and longer duration. The tests were
performed by collecting data with a
volunteer wearing the fall detector in six
different one-hour periods. During these
periods, several ADLs were performed,
followed by an emulated fall in the end of
each period, as follows:
• Period 1: the volunteer watches TV sitting
on a couch for 10 minutes. Then, he makes a
meal for about 20 minutes. In the sequence,
he returns to the couch and watches TV for
another 30 minutes, alternating between
sitting and lying down. Finally, he lifts to
walk and after a few steps,
he emulates a frontal fall, lying on the
ground for about 2 minutes;
• Period 2: the volunteer starts lying in a bed
for a period of 25 minutes. Then, he goes to
the bathroom and returns to bed for another
25-minutes period. Finally, he rises to walk
and after a few steps, emulates a backward
Available online: https://pen2print.org/index.php/ijr/ P a g e | 402 • Period 3: the volunteer starts washing
dishes for 10 minutes. Then, he goes down
the stairs and cleans the house for 35
minutes. In the sequence, he works in front
of the computer for about 10 minutes.
Finally, he emulates a sideway fall, lying
down for 2 minutes;
•Period 4: the volunteer exercises for one
hour at the gym, including running, walking,
and sit-ups. Finally, he rises to walk and
after a few steps, emulates a backward fall,
lying down for about 2 minutes;
• Period 5: the volunteer performs heavy
cleaning for one hour. Then, he lifts to walk
and after a few steps, he emulates a frontal
fall, lying on the ground for about 2
minutes;
• Period 6: the volunteer takes a bath for 15
minutes. Then, he plays guitar for 45
minutes. Finally, he emulates a sideway fall,
lying down for about 2 minutes.
DISADVANTAGES
false alarms of 9.2 seconds were
observed when the volunteer moved
down the stairs
false alarms during physical
exercises
false alarms during the bath
during heavy cleaning - around 90
seconds of false alarms were
identified during this period
more false alarms were detected
during exercises
In the particular case of TBM-MD,
more than four minutes of false
alarms were observed during running
and sit-ups
7. CONCLUSION
This work proposed the development of a
fall detection system based on a wearable
system located at wrist. The wrist was
chosen for being considered the most
discrete and comfortable place to wear a
device 24 hours a day. It may also be less
associated to the stigma of using a health
device, allowing a higher acceptance by
users. In this sense, we presented two
different approaches. The first was related to
threshold-based algorithms. The best result,
in this case, was achieved when Madgwick’s
decomposition was employed for calculating
the device’s vertical acceleration, and
combining this information with the total
velocity of the system. With that, 95.8% and
86.5% of sensitivity and specificity were
achieved, respectively, leading to an
Available online: https://pen2print.org/index.php/ijr/ P a g e | 403 machine learning methods were also
evaluated, of which the best result was
presented by k-NN method: 100% of
sensitivity and 97.9% of specificity,
resulting in 99% of accuracy. The results
achieved by the machine learning methods
were considerably higher than those
achieved by the threshold-based algorithms.
A similar result was observed for prolonged
tests with a volunteer wearing the fall
detector and performing ADLs and emulated
falls. A period of around four minutes of
false alarms (ADLs classified as falls) were
observed for the SVM method and more
than six minutes for TBM-MD, in a six-hour
test. After evaluating many different
algorithms possibilities, this work concludes
that machine learning approaches with the
proposed movement decomposition are
potentially able to achieve ideal results for a
fall detection system based on a wrist-worn
device The exhaustive analysis of different
methods for fall detection solutions based on
wrist-worn devices, which is not a common
wearable configuration in literature,
followed by the conclusion of MLMs as a
robust approach for their development,
contributes significantly to the research and
development of these solutions, which allow
to improve and save people lives. The next
steps of this work are related to a deeper
evaluation of machine learning algorithms
for fall detection and a more extensive data
acquisition protocol, involving additional
nonfall activities, different fall events and
extensive prolonged tests. Additionally, an
optimized prototype will be developed,
including a detailed analysis and
optimization of the consumption, size,
enclosure, and other advanced prototyping
features.
REFERENCES
[1] United Nations, “World population ageing 2015,” Dept. Econ. Social Affairs,
Population Divis., New York, NY, USA,
Tech. Rep. ST/ESA/SER.A/390, 2015, pp.
1–164.
[2] World Report on Ageing and Health,
World Health Organization, Geneva,
Switzerland, 2015.
[3] J. Sri-On, G. P. Tirrell, J. F. Bean, L. A.
Lipsitz, and S. W. Liu, “Revisit, subsequent
hospitalization, recurrent fall, and death
within 6 months after a fall among elderly
emergency department patients,” Ann.
Emergency Med., vol. 4, no. 1, pp. 512–516,
Available online: https://pen2print.org/index.php/ijr/ P a g e | 404 [4] M. T. Aschkenasy and T. C. Rothenhaus,
“Trauma and falls in the elderly,”
Emergency Med. Clin. North Amer., vol. 24,
no. 2, pp. 413–432, May 2006.
[5] S. S. Khan and J. Hoey, “Review of fall
detection techniques: A data availability
perspective,” Med. Eng. Phys., vol. 39, no.
1, pp. 12–22, 2016.
[6] M. Mubashir, L. Shao, and L. Seed, “A
survey on fall detection: Principles and
approaches,” Neurocomputing, vol. 100, pp.
144–152, Jan. 2013.
[7] M. Kangas, A. Konttila, I. Winblad, and
T. Jamsa, “Determination of simple
thresholds for accelerometry-based
parameters for fall detection,” in Proc. 29th
Annu. Int. Conf. IEEE Eng. Med. Biol. Soc.,
vol. 1. Aug. 2007, pp. 1367–1370.
[8] P. Pierleoni, A. Belli, L. Palma, M.
Pellegrini, L. Pernini, and S. Valenti, “A
high reliability wearable device for elderly
fall detection,” IEEE Sensors J., vol. 15, no.
8, pp. 4544–4553, Aug. 2015.
[9] S. O. H. Madgwick, A. J. L. Harrison,
and R. Vaidyanathan, “Estimation of IMU
and MARG orientation using a gradient
descent algorithm,” in Proc. IEEE Int. Conf.
Rehabil. Robot., Jul. 2011, pp. 1–7.
[10] O. Aziz, M. Musngi, E. J. Park, G.
Mori, and S. N. Robinovitch, “A comparison
of accuracy of fall detection algorithms
(thresholdbased vs. machine learning) using
waist-mounted tri-axial accelerometer
signals from a comprehensive set of falls
and non-fall trials,” Med. Biol. Eng.