Quality Estimation for Automatic Speech Recognition
Matteo Negri(1) Marco Turchi(1)Jos´e G. C. de Souza(1,2) Daniele Falavigna(1) (1)FBK - Fondazione Bruno Kessler, Via Sommarive 18, 38123 Trento, Italy
(2) University of Trento, Italy
{negri,turchi,desouza,falavi}@fbk.eu
Abstract
We address the problem of estimating the quality of Automatic Speech Recognition (ASR) out-put at utterance level, without recourse to manual reference transcriptions and when information about system’s confidence is not accessible. Given a source signal and its automatic transcription, we approach this problem as a regression task where the word error rate of the transcribed utter-ance has to be predicted. To this aim, we explore the contribution of different feature sets and the potential of different algorithms in testing conditions of increasing complexity. Results show that our automatic quality estimates closely approximate the word error rate scores calculated over reference transcripts, outperforming a strong baseline in all the testing conditions.
1 Introduction
In recent years, the increasing usage of large vocabulary continuous speech recognition (LVCSR) systems to transcribe audio recordings from different sources (e.g. Youtube videos, TV programs, DVD movies, meetings, etc) has sparked the need of accurate, fast and cost-effective methods to estimate the quality of ASR output. This need contrasts with the fact that, after decades of progress in ASR research, the established evaluation protocol is based on computing word error rate scores (WER)1 over large test
sets of hand-crafted reference transcriptions. Indeed, despite its reliability, reference-based performance assessment has an evident drawback represented by the cost of acquiring manual transcripts. Besides increasing the cost-effectiveness of ASR evaluation routines, bypassing this bottleneck has several other motivations. From an application perspective, for instance, reference-free quality estimation methods could be used to: i)decide at run-time whether a given input signal has been properly recognized (e.g.
if a user spoken utterance needs to be repeated in a dialogue application), ii) decide if an automatic transcription is acceptable as is (e.g.if manual revision is needed in an automatic subtitling application), oriii)select the best transcription among options from multiple ASR systems.
When information about the inner workings of the system used to produce the transcriptions is acces-sible, current reference-freeconfidence estimation methods can supply ASR applications with reliable indicators about output reliability. This condition, however, does not always hold in the aforementioned scenarios. A clear motivating example is provided by the exponential growth of captioned TED Talks and Youtube videos,2 for which no information is available about how transcriptions have been
pro-duced. In this case, neither reference-based methods, nor standard confidence measures can be applied to obtain useful quality estimates. Nevertheless, in this scenario, supplying reliable indicators of tran-scription quality has a huge market potential (e.g. to reduce the costs of manual revision/translation) which motivates our research.
Focusing on these compelling needs,this paper investigates the automatic prediction of ASR out-put quality when: i)manual reference transcripts are not available andii)information about the
This work is licensed under a Creative Commons Attribution 4.0 International Licence. Page numbers and proceedings footer are added by the organisers. Licence details:http://creativecommons.org/licenses/by/4.0/
1The word error rate is the minimum edit distance between an hypothesis and the reference transcription. Edit distance is
calculated as the number of edits (word insertions, deletions, substitutions) divided by the number of words in the reference.
2Since 2009, Youtube videos in English can be automatically captioned. In 2012, for the 72 hours of video uploaded per
minute, such functionality was already available for 10 languages. Currently, more than 200 million Youtube videos have either automatic or human-created captions (source: http://goo.gl/9swYSS).
inner workings of the ASR system is not accessible. Casting the problem as a supervised regression task, we experiment in a range of testing conditions on a well-known LVCSR setting (i.e. the automatic transcription of TED talks). In this framework, we analyse the performance of various models (i.e.their capability to predict utterance-level WER scores) as a function of the different learning algorithms used, the proposed features, and the amount of training data available.
Our features are categorized according to the type of information they aim to capture. Since the na-ture of the proposed feana-tures is a relevant aspect for the applicability of our approach, an important distinction is made between “glass-box” and “black-box” features, which are respectively informed and agnostic about systems’ internal decoding strategies. The former can play an important role when all the intermediate processing steps are accessible (e.g. in the selection of the best possible transcription hy-pothesis). In contrast, black-box features have a wider applicability to situations where such information is not available (e.g.to estimate the quality of online video subtitles).
Another important aspect relevant to our study is the relation between the accuracy of utterance-level quality predictions and the degree of homogeneity of training and test data. Indeed, as in any supervised learning framework, the similarity between training and test data has a direct impact on (classification and regression) results. In order to fully understand the potential of our approach, we hence measure performance variations under different levels of similarity between the data used to train the regressor and the data used for evaluation. To this aim, our experiments account for a range of possible conditions. These vary from the situation in which training and test are fully homogeneous (i.e. same dataset, with training instances produced by the same ASR system) to the more challenging situation where training and test are not homogeneous (i.e.different datasets, with training instances produced by different ASR systems). Our results, obtained with two different state-of-the-art algorithms for regression, demonstrate that in all such variable conditions our ASR quality estimation models lead to accurate predictions (i.e.
close the word error rate scores calculated over reference transcripts).
To the best of our knowledge, this paper represents the first extensive investigation on reference-freeand system-agnostic automatic estimation of ASR output quality. Along this direction, our main contributions can be summarized as follows:
1. We propose a supervised, application-oriented approach to ASR quality estimation that bypasses the need of manual reference transcriptions and is system-independent.
2. We evaluate our method with different learning algorithms and in different conditions, showing that its estimates closely approximate the WER scores calculated over reference transcripts.
3. We perform feature analysis, isolating the contribution of each feature set in all the testing condi-tions.
4. We analyse the learning curves of our best models, investigating the relation between performance results and the amount of data needed for training.
Overall, these contributions provide useful insights about the feasibility of automatic ASR quality esti-mation, opening interesting research avenues relevant for system development and for ASR applications.
2 Related Work
As areference-freeautomatic evaluation method, our work introduces a valid application-oriented alter-native to the standard evaluation protocols used within current ASR evaluation campaigns such as IWSLT (Federico et al., 2011; Federico et al., 2012; Cettolo et al., 2013).3 Besides that, our approach to ASR quality estimation (QE) also differs from the well-established confidence estimation (CE) techniques proposed in previous ASR literature (Sukkar and Lee, 1996; Evermann and Woodland, 2000; Wessel et al., 2001; Sanchis et al., 2012; Seigel, 2013, inter alia). Such difference firstly relies in the fact that, while in CE is the system itself that provides an indicator of the reliability of its output transcriptions, QE aims to provide an external and more objective measure of goodness through WER predictions. A
second (related) difference is that, in contrast with previous CE methods that heavily rely on information about the internal behaviour of the ASR system, our technique does not necessarily depend on the access to such information. This extends its applicability to scenarios (out of the scope of CE research) where the quality of transcriptions produced by (possibly unknown) ASR systems has to be evaluated/compared solely based on information about the input audio signals and the output transcriptions.
An interesting approach exploiting ASR word accuracy estimates to automatically score the profi-ciency of non-native English speakers has been proposed by Yoon et al. (2010). To our knowledge this work is the most similar to the one presented here, although it differs in the application domain and sev-eral other aspects. First of all, similar to CE methods, it makes some use of glass-box features derived from knowledge about the ASR internal workings (e.g. word confidence and acoustic/language model probabilities). Secondly, the domain addressed is constrained to responses to prompted utterances, while in this paper we address a large unconstrained domain, namely the automatic transcription of lectures (TED talks) covering different topics. Finally, (Yoon et al., 2010) is based on a rather simple model whose performance is not carefully analysed from the learning point of view (e.g. by comparing the contribution different state-of-the-art algorithms) as we do here.
The problem of automating system evaluation without a gold standard has been addressed also in other NLP areas. For instance, (Louis and Nenkova, 2013) recently addressed the assessment of machine-generated summaries without model summaries. The strongest parallelism with our work, however, can be found in the Machine Translation (MT) evaluation field, where the goal of bypassing the need of manually-created reference translations has motivated a large body of research.4 Quality estimation
for MT and ASR have a number of commonalities. First, they both deal with a “source” (respectively a sentence in a language L and an acoustic utterance) and an “hypothesis” whose quality has to be estimated without references (respectively a translation in a languageL1and an automatic transcription of the audio signal). Second, they can be addressed at various granularities. Indeed, ASR output quality estimation is similar to its MT counterpart where research focused on quality predictions at word level (Ueffing and Ney, 2007; Bach et al., 2011), sentence level (Specia et al., 2009; Mehdad et al., 2012) and document level (Soricut and Echihabi, 2010). Third, both tasks are suitable for supervised machine learning methods, either for classification (Blatz et al., 2003; Quirk, 2004) or for regression (Specia et al., 2010; Specia, 2011). Finally, both tasks motivate efforts in designing features capable to capture the difficulty to process the source, the plausibility of the output hypothesis and (but not necessarily) the confidence of the decoding process (Felice, 2012; Rubino et al., 2013b).
3 Approach
We approach the automatic estimation of ASR output quality as a supervised regression problem. Given a training set of (signal,transcription,WER) instances, the task is to predict the WER of each instance in a test set of unseen (signal,transcription) pairs.
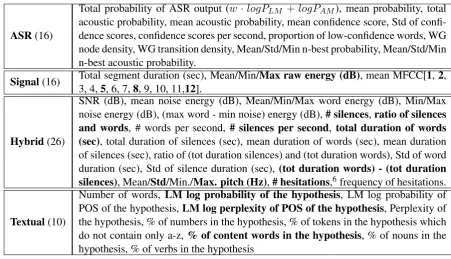
Features. As shown in Table 1, the features used in our experiments (68 in total) can be categorized in four main groups. The first group (ASR features) includes several glass-box features proposed in previous literature on ASR confidence estimation (Litman et al., 2000; Gabsdil and Lemon, 2004; Goldwater et al., 2010; Higgins et al., 2011). These features are suitable only for the ideal situation in which information about systems’ internal decoding strategies is available (as in the experiments discussed in§4.1). We use them as a term of comparison to evaluate the usefulness of the other three groups (signal, hybrid and
textual), which belong to the black-box type. These features, which are totally uninformed about the decoding process, have wider applicability to the system-independent ASR quality estimation tasks that represent our target scenario (see Sections 4.2 and 4.3). More in detail:
• ASR featuresaim to capture the confidence of the speech recognizer and the reliability of the whole decoding process. In our experiments, as we do not have access to decoders of other systems, they are computed only for the ASR system developed in our labs (Falavigna et al., 2013). These features 4For a complete overview of the current approaches to MT quality estimation we refer the reader to the WMT12 and WMT13
are extracted both from word graphs (WGs) andn-best lists (n=100). In Table 1 “Total probabil-ity” is the weighted sum of log Language Model (LM) and log Acoustic Model (AM) probabilities. LM probability is computed with a4-gram backoff LM, trained over about 5 billion words using the IRSTLM toolkit (Federico et al., 2008) and the modified shift-beta smoothing method. AM probability is computed using a set of tied-state triphone Hidden Markov Models having, as output state density, a mixture of Gaussian probability densities with diagonal covariance matrices. “Mean probability” is obtained dividing the total probability by the number of hypothesized ASR output items (words + silences). Confidence scores are computed averaging time posterior word proba-bilities (Evermann and Woodland, 2000). “Proportion of low confidence words” is the fraction of words having confidence values≤ 0.5. The remaining ASR features are directly extracted from word graphs andn-best lists scores.
• Signal featuresaim to capture the difficulty to transcribe a given input looking at the signal as a whole. They are computed from raw vectors extracted through frame analysis (we employ20ms
analysis window and10msanalysis step). For each analysed window, 12 Mel Frequency Cepstral Coefficients (MFCCs) are evaluated plus log energy. Then, for each given segment, minimum, maximum and mean values of raw energy, as well as the mean MFCCs values and total segment duration, are computed to form the signal feature vector.
• Hybrid featuresprovide a more fine-grained way to capture the difficulty of transcribing the signal. This is done by considering information about word and silence/noise regions, as well as their respective duration. These features are computed after having performed forced alignment between the input audio signal and the corresponding automatic hypotheses. Forced alignment is carried out with our ASR system (Falavigna et al., 2013), in order to detect audio segments related to words, hesitations and silences in the hypothesis. Pitch features have been computed with the Praat software tool (Boersma and Weenink, 2005).
• Textual featuresaim to capture the plausibility (i.e. the fluency) of an output transcription. To this aim, we consider surface information (such as the number of words and the percentage of numbers/content-words/nouns/verbs in the hypothesis) as well as information about LM perplexity and probability of the hypothesis (both at the level of words and parts of speech)5.
Feature selection is performed throughout all our experiments to maximize results and, at the same time, analyse the contribution of the proposed features. To this aim, we use Randomized Lasso, or stability selection (Meinshausen and B¨uhlmann, 2010), which re-samples the training data several times and fits a Lasso regression model on each sample. Features that appear in a given number of samples are considered more informative for the task at hand, and hence retained (those marked in bold in Table 1 are the most informative ones based on the experiments described in Sections 4.2 and 4.3).
Learning algorithms. To build our regression models we experimented with two non-parametric learn-ing approaches: Support Vector Machines (SVMs) (Shawe-Taylor and Cristianini, 2004) and Extremely Randomized Trees (XT) (Geurts et al., 2006). SVMsare non-parametric deterministic algorithms that have been widely used in several fields, in particular in NLP where they are the state-of-the-art for various tasks. Extra-Treesare a tree-based ensemble method for supervised classification and regression that were also successfully used for MT quality estimation (de Souza et al., 2013; de Souza et al., 2014a). In XTs each tree can be parametrized differently. When a tree is built, the node splitting step is done at ran-dom by picking the best split among a ranran-dom subset of the input features. The results of the individual trees are combined by averaging their predictions. Hyper-parameter optimization of the SVM (with Ra-dial basis function kernel – RBF) and XT models was performed using randomized search (Bergstra and Bengio, 2012). We used both learning methods as implemented in the Scikit-learn package (Pedregosa et al., 2011).
5The PoS LM has been obtained by processing with the TreeTagger (Schmid, 1995) the same data used for the word LM. 6Hesitations, such as“uhm”,“eh”and“ah”are found through matches with a predefined list. Consecutive repeated words
ASR(16)
Total probability of ASR output (w·logPLM +logPAM), mean probability, total
acoustic probability, mean acoustic probability, mean confidence score, Std of confi-dence scores, conficonfi-dence scores per second, proportion of low-conficonfi-dence words, WG node density, WG transition density, Mean/Std/Min n-best probability, Mean/Std/Min n-best acoustic probability.
Signal(16) Total segment duration (sec), Mean/Min/3, 4,5, 6, 7,8, 9, 10, 11,12]. Max raw energy (dB), mean MFCC[1,2,
Hybrid(26)
SNR (dB), mean noise energy (dB), Mean/Min/Max word energy (dB), Min/Max noise energy (dB), (max word - min noise) energy (dB),# silences,ratio of silences and words, # words per second, # silences per second, total duration of words (sec), total duration of silences (sec), mean duration of words (sec), mean duration of silences (sec), ratio of (tot duration silences) and (tot duration words), Std of word duration (sec), Std of silence duration (sec), (tot duration words) - (tot duration silences), Mean/Std/Min./Max. pitch (Hz),# hesitations,6frequency of hesitations.
Textual(10)
[image:5.595.70.522.59.318.2]Number of words, LM log probability of the hypothesis, LM log probability of POS of the hypothesis,LM log perplexity of POS of the hypothesis, Perplexity of the hypothesis, % of numbers in the hypothesis, % of tokens in the hypothesis which do not contain only a-z,% of content words in the hypothesis, % of nouns in the hypothesis, % of verbs in the hypothesis
Table 1: Full list of the 68 features used in our experiments, divided into four groups. The most predictive black-box features (resulting from feature selection in the§4.3 experiments) are marked in bold.
4 Experiments
To evaluate our approach we carried out three sets of experiments. In each set our feature groups are analysed: i)with the two learning algorithms,ii)in combination/isolation,iii)with/without feature se-lection. The three sets differ in terms of the difficulty of the quality estimation task from the learning point of view. To experiment with situations of increasing complexity, we alternate conditions in which all the features (glass-box and black-box) can be used, training and test sets are non-/homogeneous, the quality estimator is trained on transcriptions generated by the same/different ASR systems.
Data. The data used in the experiments consists of the audio recordings delivered for the IWSLT 2013 evaluation campaign (Cettolo et al., 2013). One of the tasks of IWSLT 2013 is the automatic tran-scription of English TED talks, a global set of conferences whose audio/video recordings are publicly available. The main challenges for ASR in these talks include: the large variability of topics (hence a large, unconstrained vocabulary), the presence of non-native speakers and a rather informal speaking style. Each IWSLT participant submitted one primary ASR output run for each of the talks included in the test set plus some optional contrastive ASR outputs. In addition, participants sent submissions for the ASR tracks delivered for the 2012 evaluation campaign. Our experiments have been carried out on the primary submissions, sent by 8 participants, related to the 2012 (consisting in 11 different talks) and 2013 (28 different talks) test sets. The 2012 test set has a total duration of around1h45sec, it contains
1,118reference sentences and18,613running words. On such dataset, participants’ primary submissions achieved a mean utterance WER ranging from 10.5% to 18.4% (in this work a WER score is computed for each reference sentence, and mean utterance WER represents the average of sentence WERs). The 2013 test set has a total duration of around3h55sec, it contains2,238reference sentences and41,545 run-ning words. On this dataset, primary participants’ submissions achieve a mean utterance WER ranging from 15.9% to 30.8%.
to ensure that each participant has the same number of ASR sentence hypotheses, an alignment with the reference manual segmentation has been performed in our experiments.
Evaluation. Our evaluation is carried out in terms of Mean Absolute Error (MAE), a standard metric for regression problems. The MAE is the average of the absolute errors ei = |fi −yi|, where fi is
the prediction of the model andyi is the actual WER for theith test instance. WER is calculated with
the NIST SCLITE Scoring Package.7 As it is a measure of error, lower MAE scores indicate that our
predictions are closer to the real WER calculated for each test instance against the reference transcripts. For each experiment, we report the mean and the standard deviation of the MAE achieved by the best performing QE models on the IWSLT 2013 test sets.
Baseline. Besides measuring performance in terms of global MAE, each model is compared against a common baseline for regression tasks. This baseline, which is particularly relevant in settings featuring different data distributions between training and test sets, is calculated by labelling each test instance with the mean WER score calculated on the training set. Previous works, also in MT quality estimation, demonstrated that its results can be particularly hard to beat (Rubino et al., 2013a).
4.1 Experiment 1
In the first set of experiments we consider the easiest situation from the learning perspective. In this setting we predict the WER of transcriptions produced by our ASR system (denoted byX), whose inner workings are known (thus enabling the use of glass-box features). To investigate the relation between prediction accuracy and the degree of homogeneity of training and test data, we experiment both with similar datasets (disjoint training and test sampled from IWSLT13) and different datasets (IWSLT12 for training and samples from IWSLT13 for test). Results are reported in Table 2, where the notation “LetterYear - LetterYear” indicates the systems and the datasets used for training and test (respectively our systemX, and data from IWSLT12and/or IWSLT13).
Train - Test ALL (glass-box + BB COMB) ASR (glass-box) BB COMB (Signal+Hybrid+Textual) Baseline X13 - X13 11.56±0.29 SVR 12.11±0.29 XT 15.17±0.06 XT 19.84±0.06 X12 - X13 12.61±0.13 XT 13.78±0.16 XT 16.78±0.18 XT 19.06±0.12
Train - Test Signal Hybrid Textual Baseline
X13 - X13 16.42±0.1 XT 17.61±0.12 XT 17.42±0.15 SVR 19.84±0.06 X12 - X13 18.85±0.09† XT 18.39±0.22 XT 17.58±0.15 XT 19.06±0.12
Table 2: MAE results using the same system on different datasets, with and without glass-box features.
As can be seen from the table, the two models using ALL the features achieve the largest improvements over the strong baseline used for comparison (up to8.2 MAE points in theX13 - X13setting). This is not surprising if we consider the high predictive power of ASR (glass-box) features that, when used in isolation, lead to a considerably lower MAE with respect to the other three groups. However, it’s worth observing that also the combination of only the black-box features (BB COMB) allows the QE predictors to significantly outperform the baseline (up to4.67MAE points inX13 - X13). Such improvements come from the joint contribution of each of the three groups, which achieve good results also in isolation. Indeed, except in one case where the gain over the baseline is not significant8(X12 - X13with the Signal
features), their MAE reduction ranges between0.67(X12 - X13Hybrid) and3.42MAE points (X13 -X13Signal). The good prediction capability of the black-box features is also shown by the fact that, when combined with the glass-box features, they lead to improvements between0.55and1.17 MAE points over the ASR features alone. Considering the privileged condition of the (system-informed) glass-box features, this is a remarkable result that suggests some complementarity between the two groups.
In general, our supervised approach is sensitive to the similarity between training and test. This is evidenced by higher MAE results when non-homogeneous datasets (i.e. X12 - X13) are processed. In
7http://www1.icsi.berkeley.edu/Speech/docs/sctk-1.2/sclite.htm
8Statistical significance is measured by considering the overlap of confidence intervals defined by the standard deviation
terms of algorithms, XT generally performs better than SVR, in particular when the QE model is trained and tested on non-homogeneous data. This can be explained by their higher generalization capability due to variance reductions as explained in (Hastie et al., 2009, Chapter 15).
4.2 Experiment 2
In this set of experiments we consider a situation of intermediate difficulty from the learning perspective. Our objective is to evaluate, on homogeneous datasets (sampled from IWSLT13), the output of ASR systems whose inner workings are not known (hence only black-box features can be used). To make our analysis more complete, we also evaluate the performance of models trained on a given ASR system to predict the WER of hypotheses produced by a different one. This situation is closer to application scenarios in which the evaluated ASR system is unknown and different from the one used to train the quality estimator. Two systems with very different performance are considered for this purpose: the best and the worst according to the official IWSLT 2013 ranking (respectively denoted byAandZ).
Train - Test BB COMB Signal Hybrid Textual Baseline
A13 - A13 11.18±0.22 SVR 11.91±0.23 SVR 12.76±0.18 SVR 12.57±0.13 SVR 14.35±0.1 Z13 - A13 16.01±0.23 SVR 18.04±0.22 SVR 17.24±0.22 SVR 18.01±0.2 XT 21.58±0.15 Z13 - Z13 15.52±0.6 XT 16.94±0.41 XT 17.04±0.56 SVR 17.84±0.4 XT 19.65±0.43 A13 - Z13 17.36±0.43 XT 18.7±0.53 XT 18.21±0.45 XT 19.38±0.45 XT 21.03±0.51
Table 3: MAE results using different systems on the same dataset, without glass-box features.
The results reported in Table 3 confirm that: i)the combination of black-box features (BB COMB) always leads to the best QE models, which significantly outperform the baseline, ii) the same holds also when each single group is used in isolation,iii)with less homogeneous training and test data, XT performs generally better than SVR.
In addition, it’s worth noting that when a QE model is trained and tested on data transcribed by the same ASR system the results are significantly better (the MAE is always about 1.0 - 6.0 points lower). Indeed, as also shown by the same behaviour of our baseline, this condition is simpler and more suitable for supervised learning methods. This depends on the fact that each ASR system has its own coherent behaviour, which results in transcriptions with similar characteristics that supervised models are able to learn (e.g. recurring errors, similar WER distributions). In contrast, when training and test data are produced by different ASR systems, supervised learning becomes more difficult and the output predictions less reliable. Each feature group is affected by this situation, but it is interesting to note that the Hybrid features are more robust than the other two groups to less homogeneous datasets. This can be explained by the fact that they are extracted after applying forced alignment by means of a third system, which is likely to normalise and reduce the difference between training and test data. Overall, also in this more complex scenario where the glass-box features cannot be used, our results demonstrate a good prediction capability of the QE models, which are still able to beat a strong baseline.
4.3 Experiment 3
In the third set of experiments we consider the hardest case from the learning point of view. In this setting the evaluated ASR systems are unknown and training/test data are non homogeneous (i.e.training from IWSLT12, test from samples of IWSLT13). Results are reported in Table 4.
Train - Test BB COMB Signal Hybrid Textual Baseline
A12 - A13 12.81±0.08 XT 13.57±0.13† XT 12.85±0.1 XT 13.25±0.23† XT 13.65±0.17
Z12 - A13 14.78±0.1 SVR 15.66±0.09† XT 13.56±0.09 SVR 13.63±0.24 SVR 15.51±0.35
Z12 - Z13 17.16±0.4 XT 19.34±0.32† XT 17.68±0.3 XT 19.59±0.11† XT 19.98±0.29
A12 - Z13 19.83±0.23 XT 21.85±0.2 XT 20.68±0.13 XT 22.62±0.08 XT 23.04±0.18
Table 4: MAE results using different systems on different dataset, without glass-box features.
0 10 20 30 40 50 60 70 80 90 100 12
14 16 18 20 22 24 26
% of Training Data
MAE
[image:8.595.175.412.74.267.2]A12 ï A13 A12 ï Z13 Z12 ï Z13 Z12 ï A13
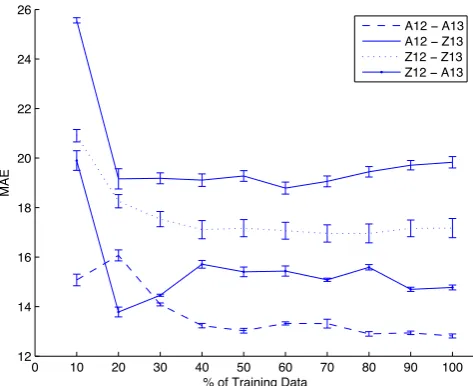
Figure 1: Learning curves for the best systems of “Experiment 3” (using BB COMB features).
black-box features (BB COMB) lead to the best QE models, which significantly outperform the baseline,
ii)this holds also when each single group is used in isolation (although not significantly in 5 out of 12 settings),iii)with less homogeneous training and test data, XT performs generally better than SVR.
Unsurprisingly, as also observed in the previous set of experiments, the low homogeneity of training and test data has an impact on the accuracy of the predictions. The effect of training and testing on less homogeneous data produced by different systems is now clearly visible. Except for the more robust Hybrid features, which in theZ12 - A13setting produce the best model, the results obtained with the two other groups decreased to the point that their improvement over the baseline is often not significant. Nev-ertheless, even under the challenging conditions posed by this realistic and application-oriented scenario, reference-free and system-agnostic ASR evaluation remains a feasible task.
5 Feature Analysis and Learning Curves
In order to gain additional insights about the effectiveness of our method, we performed a further analysis of the “Experiment 3” results. In such challenging scenario, the most interesting from the application perspective, we first identified the most predictive features among those in the BB COMB set. To this aim, we collected the features that are always chosen by the feature selection algorithm proposed in§3. The resulting list contains features from all the three black-box groups (marked in bold in Table 1). This confirms their complementarity in predicting the quality of a transcribed utterance.
6 Conclusion
We investigated the problem of automatically predicting the word error rate of an automatically-transcribed utterance in a large vocabulary continuous speech recognition setting. In such scenario, we proposed a supervised regression approach that bypasses the need of manual reference transcriptions and does not necessarily depend on information about system’s confidence (first contributionof the pa-per). Then, by evaluating models obtained with different state-of-the-art learning algorithms, we showed that our automatic predictions outperform a strong baseline and closely approximate the WER scores calculated over reference transcripts (second contribution). Different feature groups have been proposed and their contribution has been analysed in a range of testing conditions of increasing difficulty (third contribution). This made possible to isolate informative features that significantly contribute to the per-formance of our quality estimation models, and to get useful insights about the potential of our approach when different sources of information (glass-box, black box features) are available. Finally, analysing the relation between prediction performance and the size of the training set, we showed that the results obtained with 40% of the data are already comparable to our best MAE (fourth contribution).
Our analysis revealed a dependency between the performance of the quality estimation models and the degree of homogeneity between training and test data. This aspect is particularly relevant from the application perspective since in real working conditions the availability oflarge amountsof representa-tivetraining instances is far from being guaranteed. In quality estimation for machine translation (a task featuring strong similarities with ours), these issues have recently motivated studies on domain adapta-tion and online learning techniques (de Souza et al., 2014b; Turchi et al., 2014). This suggests, as a first direction for future work, the investigation of approaches capable to better exploit the available training data and mitigate the impact of large differences between training and test instances.
Acknowledgements
This work has been partially funded by the European project EU-BRIDGE (FP7-287658) and by the Autonomous Province of Trento, Italy, under the project Wikivoice (L.P. 6/1999).
References
Nguyen Bach, Fei Huang, and Yaser Al-Onaizan. 2011. Goodness: a Method for Measuring Machine Translation
Confidence. InThe 49th Annual Meeting of the Association for Computational Linguistics: Human Language
Technologies, Proceedings of the Conference, 19-24 June, 2011, Portland, Oregon, USA, pages 211–219. The Association for Computer Linguistics.
James Bergstra and Yoshua Bengio. 2012. Random Search for Hyper-Parameter Optimization. Journal of
Ma-chine Learning Research, 13:281–305.
John Blatz, Erin Fitzgerald, George Foster, Simona Gandrabur, Cyril Goutte, Alex Kulesza, Alberto Sanchis, and Nicola Ueffing. 2003. Confidence Estimation for Machine Translation. Summer workshop final report, JHU/CLSP.
Paul Boersma and David Weenink. 2005. Praat: Doing Phonetics by Computer (Version 4.3.01). Retrieved from
http://www.praat.org/.
Ondrej Bojar, Christian Buck, Chris Callison-Burch, Christian Federmann, Barry Haddow, Philipp Koehn, Christof Monz, Matt Post, Radu Soricut, and Lucia Specia. 2013. Findings of the 2013 Workshop on Statistical Machine
Translation. InEighth Workshop on Statistical Machine Translation, WMT-2013, pages 1–44, Sofia, Bulgaria.
Chris Callison-Burch, Philipp Koehn, Christof Monz, Matt Post, Radu Soricut, and Lucia Specia. 2012. Findings
of the 2012 Workshop on Statistical Machine Translation. InProceedings of the Seventh Workshop on Statistical
Machine Translation (WMT’12), pages 10–51, Montr´eal, Canada.
Mauro Cettolo, Jan Niehues, Sebastian St¨uker, Luisa Bentivogli, and Marcello Federico. 2013. Report on the 10th
IWSLT Evaluation Campaign. Proceedings of the International Workshop on Spoken Language Translation,
Jos´e G. C. de Souza, Christian Buck, Marco Turchi, and Matteo Negri. 2013. FBK-UEdin participation to the
WMT13 quality estimation shared task. InProceedings of the Eighth Workshop on Statistical Machine
Trans-lation, pages 352–358, Sofia, Bulgaria, August. Association for Computational Linguistics.
Jos´e G. C. de Souza, Jes´us Gonz´alez-Rubio, Christian Buck, Marco Turchi, and Matteo Negri. 2014a.
FBK-UPV-UEdin participation in the WMT14 Quality Estimation shared-task. InProceedings of the Ninth Workshop on
Statistical Machine Translation, Baltimore, MD, USA, June.
Jos´e G. C. de Souza, Marco Turchi, and Matteo Negri. 2014b. Predicting Machine Translation Quality
Esti-mation Across Domains. InProceedings of the 25th International Conference on Computational Linguistics,
COLING’14, Dublin, Ireland.
Gunnar Evermann and Philip C. Woodland. 2000. Large Vocabulary Decoding and Confidence Estimation Using
Word Posterior Probabilities. InProc. of ICASSP, pages 2366–2369, Istanbul, Turkey, June.
Daniele Falavigna, Roberto Gretter, Fabio Brugnara, Diego Giuliani, and Romain Serizel. 2013. FBK@IWSLT
2013 - ASR Tracks. InProceedings of the IWSLT 2013 workshop, Heidelberg, Germany.
Marcello Federico, Nicola Bertoldi, and Mauro Cettolo. 2008. IRSTLM: an Open Source Toolkit for Handling Large Scale Language Models. pages 1618–1621, Brisbane, Australia, September.
Marcello Federico, Luisa Bentivogli, Michael Paul, and Sebastian St¨uker. 2011. Overview of the IWSLT 2011
Evaluation Campaign. InInternational Workshop on Spoken Language Translation, pages 11–27.
Marcello Federico, Mauro Cettolo, Luisa Bentivogli, Michael Paul, and Sebastian St¨uker. 2012. Overview of the
IWSLT 2012 Evaluation Campaign. InProc. of the International Workshop on Spoken Language Translation,
Hong Kong, HK, December.
Mariano Felice. 2012. Linguistic Indicators for Quality Estimation of Machine Translations. Master’s thesis, University of Wolverhampton, UK.
Malte Gabsdil and Oliver Lemon. 2004. Combining acoustic and pragmatic features to predict recognition perfor-mance in spoken dialogue systems. pages 344–351.
Pierre Geurts, Damien Ernst, and Louis Wehenkel. 2006. Extremely randomized trees. Mach. Learn., 63(1):3–42,
April.
Sharon Goldwater, Dan Jurafsky, and Christopher Manning. 2010. Which words are hard to recognize? Prosodic, lexical, and disfluency factors that increase speech recognition error rates. 52(3):181–200.
Trevor Hastie, Robert Tibshirani, Jerome Friedman, T Hastie, J Friedman, and R Tibshirani. 2009. The elements
of statistical learning, volume 2. Springer.
Derrick Higgins, Xiaoming Xi, Klaus Zechner, and David Williamson. 2011. A three-stage approach for auto-mated scoring of spontaneous responses. (25):282–306.
Diane J. Litman, Julia B. Hirschberg, and Marc Swerts. 2000. Predicting Automatic Speech Recognition
Perfor-mance Using Prosodic Cues. InProceedings of NAACL, pages 218–225.
Annie Louis and Ani Nenkova. 2013. Automatically assessing machine summary content without a gold standard.
Computational Linguistics, 39(2):267–300.
Yashar Mehdad, Matteo Negri, and Marcello Federico. 2012. Match without a Referee: Evaluating MT Adequacy
without Reference Translations. InProceedings of the Machine Translation Workshop (WMT2012).
Nicolai Meinshausen and Peter B¨uhlmann. 2010. Stability selection. Journal of the Royal Statistical Society:
Series B (Statistical Methodology), 72(4):417–473.
F. Pedregosa, G. Varoquaux, A. Gramfort, V. Michel, B. Thirion, O. Grisel, M. Blondel, P. Prettenhofer, R. Weiss, V. Dubourg, J. Vanderplas, A. Passos, D. Cournapeau, M. Brucher, M. Perrot, and E. Duchesnay. 2011.
Scikit-learn : Machine Learning in Python.Journal of Machine Learning Research, 12:2825–2830.
Christopher B. Quirk. 2004. Training a Sentence-Level Machine Translation Confidence Measure. InProceedings
of LREC 2004.
Raphael Rubino, Jos´e GC de Souza, Jennifer Foster, and Lucia Specia. 2013a. Topic Models for Translation
Raphael Rubino, Joachim Wagner, Jennifer Foster, Johann Roturier, Rasoul Samad Zadeh Kaljahi, and Fred
Hol-lowood. 2013b. DCU-Symantec at the WMT 2013 Quality Estimation Shared Task. InProceedings of the
Eighth Workshop on Statistical Machine Translation, pages 392–397.
Alberto Sanchis, Alfons Juan, and Enrique Vidal. 2012. A Word-Based Naive Bayes Classifier for Confidence Estimation in Speech Recognition. 20(12):565–574.
Helmut Schmid. 1995. Improvements in Part-of-Speech Tagging with an Application to German. InProceedings
of the ACL SIGDAT-Workshop, pages 47–50, Dublin, Ireland.
Matthew Stephen Seigel. 2013. Condence Estimation for Automatic Speech Recognition Hypotheses. University
of Cambridge. PhD Thesis.
John Shawe-Taylor and Nello Cristianini. 2004.Kernel methods for pattern analysis. Cambridge university press.
Radu Soricut and Abdessamad Echihabi. 2010. TrustRank: Inducing Trust in Automatic Translations via Ranking. InProceedings of the 48th Annual Meeting of the Association for Computational Linguistics, ACL ’10, pages 612–621, Stroudsburg, PA, USA. Association for Computational Linguistics.
Lucia Specia, Nicola Cancedda, Marc Dymetman, Marco Turchi, and Nello Cristianini. 2009. Estimating the
Sentence-Level Quality of Machine Translation Systems. InProceedings of the 13th Annual Conference of the
European Association for Machine Translation (EAMT’09), pages 28–35, Barcelona, Spain.
Lucia Specia, Dhwaj Raj, and Marco Turchi. 2010. Machine Translation Evaluation versus Quality Estimation.
Machine translation, 24(1):39–50.
Lucia Specia. 2011. Exploiting Objective Annotations for Measuring Translation Post-editing Effort.Proceedings
of the 15th Conference of the European Association for Machine Translation, pages 73–80.
Rafic Antoon Sukkar and Chin-Hui Lee. 1996. Vocabulary Independent Discriminative Utterance Verification for Nonkeyword Rejection in Subword Based Speech Recognition. 6(6):420–429.
Marco Turchi, Antonios Anastasopoulos, Jos´e G. C. de Souza, and Matteo Negri. 2014. Adaptive Quality
Estima-tion for Machine TranslaEstima-tion. InProceedings of the 52nd Annual Meeting of the Association for Computational
Linguistics, ACL’14, Baltimore, MD, USA. Association for Computational Linguistics.
Nicola Ueffing and Hermann Ney. 2007. Word-Level Confidence Estimation for Machine Translation. Comput.
Linguist., 33(1):9–40, March.
Frank Wessel, Ralf Schl¨uter, Klaus Macherey, and Hermann Ney. 2001. Confidence Measures for Large Vocabu-lary Continuous Speech Recognition. 9(3):288–298.
Su-Youn Yoon, Lei Chen, and Klaus Zechner. 2010. Predicting word accuracy for the automatic speech