192
Optimization of Diesel Engine Parameters of
Performance and Emission by Taguchi Method
Pani Sharanappa
1, Mallinath.C. Navindgi
2, H V Mulimani
3Department of Mechanical Engineering, PDA College of Engineering, Kalaburagi, India1,2,3 Email: [email protected], [email protected], [email protected]
Abstract-The present work discuss the Taguchi technique to determine the optimum engine parameters at which
the diesel engine works effectively fuelled with diesel-biodiesel-ethanol (Ternary fuel) blends operating with different injection opening pressure, 180 bar, 200 bar and 220 bar. The three different Ternary fuel blends were used, B20, B30 and B40. In this technique L9 array is selected and three factors like IOP, Blend and load are analyzed. It was found that 200 bar IOP, B30 and 80% load are the optimum parameters at which DI diesel engine operates effectively. Experiment was conducted with the optimum parameters. The predicted values of brake thermal efficiency (BTE), brake specific fuel consumption (BSFC), exhaust gas temperature (EGT), carbon monoxide(CO), carbon dioxide (CO2), hydrocarbon (HC), and oxides of nitrogen (NO) are comparable
with experimental results.
Index Terms- Taguchi method; ternary fuel blend; optimum parameters
1. INTRODUCTION
Authors are encouraged to have their contribution checked for grammar. Taguchi method reduces the time consumption to conduct unnecessary experiments. It is used when engine operates with various parameters; Taguchi method is one of the easiest methods to optimize engine diesel parameters, then engine run with optimum parameters and experimental results are compared with the predicted values [1]
In this paper the engine parameters like injection opening pressure, load, exhaust gas recirculation and fuel blend ratios are optimized. Three levels are taken for each parameter. The three levels of injection opening pressure (IOP) are 180 bar, 200 bar and 220 bar. Three levels of exhaust gas recirculation (EGR) are 5%, 10% and 15%. The fuel blend levels are 20% (B20), 30% (B30) and 40% (B40). The three levels for power are 2kW, 3kW and 4kW (40%, 60% and 80% of full rated power). Performance, emission and combustion parameters are analyzed. Brake thermal efficiency (BTE), brake specific fuel consumption (BSFC), exhaust gas temperature (EGT), carbon monoxide (CO), carbon dioxide (CO2), hydrocarbon (HC), nitrous oxides (NOx), peak cylinder pressure and heat release are some of the parameters analyzed. The engine performance, emission and combustion parameters were analyzed on trial basis with different set of controlling factors.
Orthogonal array gives the effect of huge number factors on responses inside a small experimental matrix. Use of orthogonal array reduces the number of experiments and it provides shortest possible matrix in which all factors are varied over working range [2] The conclusions from the matrix are valid over entire range. L9 orthogonal array is selected from Taguchi design with three factors and three levels shown in Table 2.
Taguchi method employs the SNR (Signal to Noise ratio) for optimization of parameters. There are three criteria of SNR, larger the better, smaller the better and normal the best. Larger the better criteria is applied to brake thermal efficiency, peak cylinder pressure and maximum heat release. Smaller the better is applied to brake specific fuel consumption, exhaust gas temperature and exhaust gas emissions. [3-9]
S/N Ratios Formulations:
The lower-The better S/N = -10log (∑Y2/n) The higher-The better S/N = -10log (∑(1/Y2)/n) The more nominal-The better S/N = 10log (∑Ȳ2/S2)
Where n and Y is the number of repeated experiment and the measured value of the response variable, respectively.
Response curves are of two types, one is main effects plot for Means and another one is main effects plot for S/N ratio. First plot gives most influential parameter on the results by rating ranks as 1, 2 and 3. Delta values of the parameters is the difference between maximum and minimum value, the parameter having maximum delta value is ranked as 1 and subsequent as rank 2 and rank 3. The parameter having rank 1 influence more on the results than rank 2 and rank 3. S/N ratio plot gives the optimum parameter [10-14].
2. EXPERIMENTAL FUEL MATERIALS
AND METHODS
193
Diesel [70] + Biodiesel [20] + Ethanol [10]: [B20] Diesel [60] + Biodiesel [30] + Ethanol [10]: [B30] Diesel [50] + Biodiesel [40] + Ethanol [10] : [B40]
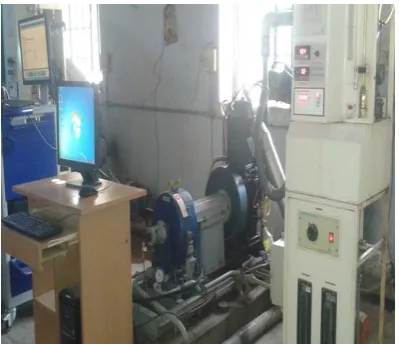
The pictorial view of the experimental set is shown in figure 1, and technical specification of the engine is shown in table 1. Engine was run with different IOP like, 180 bar, 200 bar and 220 bar, the injection pressure was set by adjusting the spring pressure and was calibrated.
[image:2.595.322.509.107.249.2]: [B40]
[image:2.595.73.273.245.417.2]Fig.1. Pictorial view of experimental set up
Table: 1. Engine specifications
Specifications Details
Make & model Kirlosker, TV 1 make
General details DI, water cooled, four stroke, single cylinder Power output 5.2 kW/ 7BHP
Bore x Stroke 87.5 mm x 110 mm Number of
cylinders One Constant speed 1500 RPM
Orifice diameter 20 mm Injection
pressure 180-220 Swept volume 661 cc Nozzle hole
diameter 0.223 mm Clearance
volume 38.35 cc Compression
ratio 17.5:1 Fuel injection
timing 23
0 CA bTDC
Connecting rod 238 mm
length
Valve diameter 34.2 mm Maximum valve
lift 10.1 mm
Fuel injection pump
MICO in line with mechanical governor and Flange mounted. Type of
combustion chamber
Hemispherical open combustion chamber
3. RESULTS AND DISCUSSIONS
Figure 3 (a, b), Figure 4 (a, b), figure 5 (a, b), figure 6 (a, b), figure 7 (a, b), figure 8 (a, b) and figure 9 (a, b) shows the Main effects plot for mean and S/N of BTE, BSFC, EGT, CO, CO2, HC and NOx respectively.
Table 4 to table 10 shows the response table for Mean and S/N ratio of BTE, BSFC, EGT, CO, CO2, HC,
[image:2.595.303.514.414.482.2]NOx. Theses tables show that the delta values are Maximum for Injection opening pressure and power. Hence IOP and power have more influence on the engine performance and emission. Major headings should be typeset in boldface with the words uppercase.
Table 2: Control factors and Levels of Trial-I
Factors Level 1 Level 2 Level 3
Blend 20 30 40
Injection pressure (bar)
180 200 220
Power (kW) 2 3 4
Table 3a: Orthogonal Array and Response parameters for performance parameters
Sl. No
Blend IOP Powe r
BTE BSFC EGT
1 20 180 2 21.79 0.41 354.8 2 20 200 3 31.00 0.24 288.4 3 20 220 4 20.80 0.37 352.0 4 30 180 3 27.00 0.36 275.0 5 30 200 4 32.30 0.29 358.0 6 30 220 2 21.96 0.41 262.0 7 40 180 4 28.00 0.34 341.2 8 40 200 2 23.50 0.44 248.3 9 40 220 3 24.63 0.37 289.7
Table 3b: Orthogonal Array and Response parameters for emission parameters
Sl. No
Blend IOP Po wer
CO CO2 HC NOx
[image:2.595.92.276.467.766.2]194
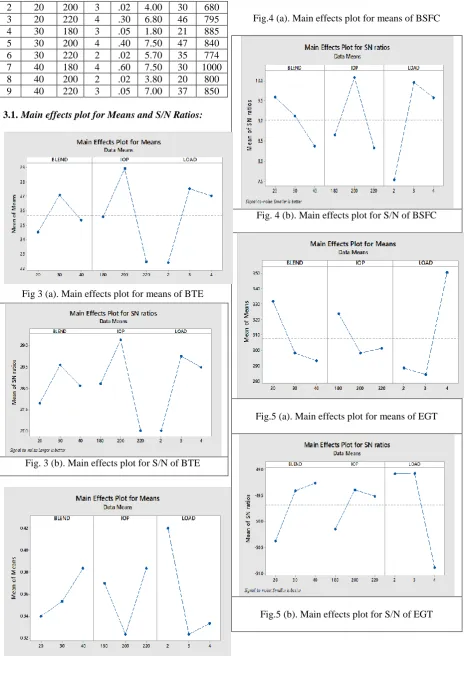
2 20 200 3 .02 4.00 30 680 3 20 220 4 .30 6.80 46 795 4 30 180 3 .05 1.80 21 885 5 30 200 4 .40 7.50 47 840 6 30 220 2 .02 5.70 35 774 7 40 180 4 .60 7.50 30 1000 8 40 200 2 .02 3.80 20 800 9 40 220 3 .05 7.00 37 850
3.1.Main effects plot for Means and S/N Ratios:
Fig 3 (a). Main effects plot for means of BTE
Fig. 3 (b). Main effects plot for S/N of BTE
Fig.4 (a). Main effects plot for means of BSFC
Fig. 4 (b). Main effects plot for S/N of BSFC
Fig.5 (a). Main effects plot for means of EGT
[image:3.595.69.534.108.783.2]195
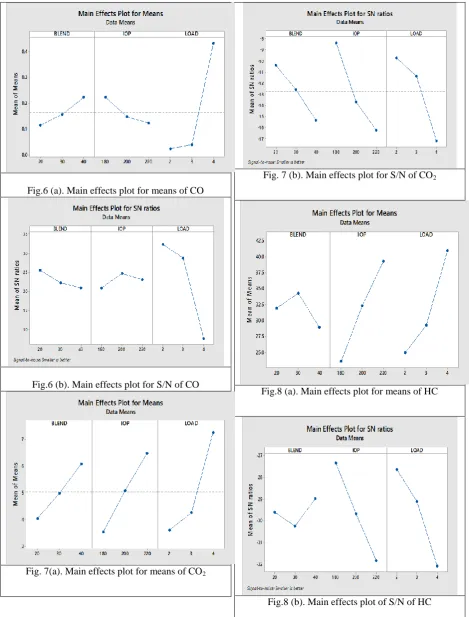
Fig.6 (a). Main effects plot for means of CO
Fig.6 (b). Main effects plot for S/N of CO
Fig. 7(a). Main effects plot for means of CO2
Fig. 7 (b). Main effects plot for S/N of CO2
Fig.8 (a). Main effects plot for means of HC
[image:4.595.66.536.107.725.2]196
Fig.9 (a). Main effects plot for means of NOx
Fig.9 (b). Main effects plot for S/N of NOx
An experiment was conducted on DI diesel engine fuelled with B30 with 200 bar IOP. Table 10 shows the comparison of predicted values and experimental values, which are close to each other. Figure 9 shows the graphical representation of predicted values and experimental values.
Fig.10. Comparison: predicted & Experimental values Table: 11. Comparison: predicted & Experimental
values
Parameters Predicted value
Experimental value
% Difference
BTE 31.724 29.2 7
BSFC 0.2688 0.24 10
EGT 296 288 2.7
CO 0.028 0.020 2.8
CO2 1.102 1.00 9.2
HC 21.444 20 6.7
NOx 797.44 680 14.6
Table: 4. Response table for Means and S/N Ratios for BTE
Response table for Means Response table for S/N Ratios
Level Blend IOP Power
(Load) Level Blend IOP
Power (Load)
L1 24.53 25.60 22.42 L1 27.65 28.11 27.01
L2 27.09 28.93 27.54 L2 28.65 29.14 28.76
L3 25.38 22.46 27.03 L3 28.06 27.01 28.50
Delta 2.56 6.47 5.13 Delta 0.90 2.14 1.75
Rank3 3 1 2 Rank 3 1 2
Table: 5. Response table for Means and S/N Ratios for BSFC
0 100 200 300 400 500 600 700
800 Predicted value
197
Response table for Means Response table for S/N Ratios
Level Blend IOP Power
(Load) Level Blend IOP
Power (Load)
L1 0.3400 0.3700 0.4200 L1 9.592 8.663 7.540
L2 0.3533 0.3233 0.3233 L2 9.123 10.093 9.969
L3 0.3833 0.3833 0.3333 L3 8.379 8.339 9.586
Delta 0.0433 0.0600 0.0967 Delta 1.213 1.754 2.429
Rank 3 2 1 Rank 3 2 1
Table: 6. Response table for Means and S/N Ratios for EGT
Response table for Means Response table for S/N Ratios
Level Blend IOP Power
(Load) Level Blend IOP
Power (Load)
L1 331.8 323.7 288.4 L1 -50.38 -50.15 -49.09
L2 298.4 298.3 284.4 L2 -49.41 -49.39 -49.08
L3 293.1 301.3 350.4 L3 -49.27 -50.89 -50.89
Delta 38.7 25.4 66.0 Delta 1.11 0.76 1.81
Rank 2 3 1 Rank 2 3 1
Table: 7. Response table for Means and S/N Ratios for CO
Response table for Means Response table for S/N Ratios
Level Blend IOP Power
(Load) Level Blend IOP
Power (Load)
L1 0.11500 0.225000 0.02433 L1 25.493 20.833 32.283
L2 0.15767 0.14833 0.04000 L2 22.248 24.660 28.674
L3 0.22500 0.12433 0.4333 L3 20.833 23.081 7.618
Delta 0.11000 0.10067 0.40900 Delta 4.660 3.827 24.665
Rank 2 3 1 Rank 2 3 1
Table: 8. Response table of Means and S/N Ratios for CO2
Response table for Means Response table for S/N Ratios
Level Blend IOP Power
(Load) Level Blend IOP
Power (Load)
L1 4.047 3.547 3.613 L1 -10.411 -8.383 -9.752
198
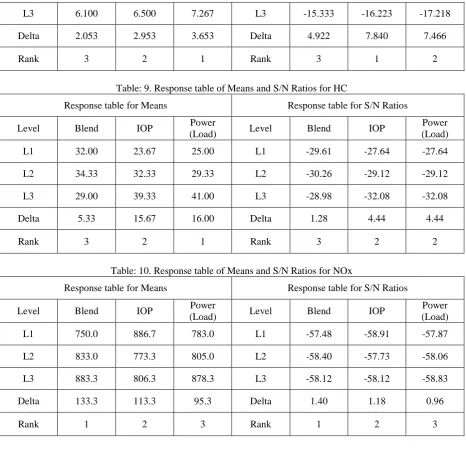
L3 6.100 6.500 7.267 L3 -15.333 -16.223 -17.218
Delta 2.053 2.953 3.653 Delta 4.922 7.840 7.466
[image:7.595.67.534.107.559.2]Rank 3 2 1 Rank 3 1 2
Table: 9. Response table of Means and S/N Ratios for HC
Response table for Means Response table for S/N Ratios
Level Blend IOP Power
(Load) Level Blend IOP
Power (Load)
L1 32.00 23.67 25.00 L1 -29.61 -27.64 -27.64
L2 34.33 32.33 29.33 L2 -30.26 -29.12 -29.12
L3 29.00 39.33 41.00 L3 -28.98 -32.08 -32.08
Delta 5.33 15.67 16.00 Delta 1.28 4.44 4.44
Rank 3 2 1 Rank 3 2 2
Table: 10. Response table of Means and S/N Ratios for NOx
Response table for Means Response table for S/N Ratios
Level Blend IOP Power
(Load) Level Blend IOP
Power (Load)
L1 750.0 886.7 783.0 L1 -57.48 -58.91 -57.87
L2 833.0 773.3 805.0 L2 -58.40 -57.73 -58.06
L3 883.3 806.3 878.3 L3 -58.12 -58.12 -58.83
Delta 133.3 113.3 95.3 Delta 1.40 1.18 0.96
Rank 1 2 3 Rank 1 2 3
4. CONCLUSIONS REFERENCES
Taguchi method is the easiest technique which saves time for the experiments; it says the optimum engine parameters at which engine can be run. In this present work the optimum parameters were, 30% blend, 200 bar IOP and 40% of full load (4kW power). The experiment was conducted with these engine parameters and found that, experimental values are close to the predicted values which are shown in table11 and figure 10.
The engine gives best performance and emission with 30% blend at 200 bar IOP and at 40% of full load than other fuel blends. B30 can save the diesel fuel by 40% by volume and 20-25% fuel cost.
[1] T. Ganapathy, et al. Performance optimization of jatropha biodiesel engine model using Taguchi approach. Applied energy, Elseivier, 86, 2009. 2476-2486.
[2] Horng-Wen Wu, et al. Using Taguchi method on combustion performance of adiesel engine with diesel/biodiesel blend and port inducing H2. Applied Energy, Elsevier, 104, 2013. 362-370.
[3] Kaliamoorthy, et al. Investigation on performance of a biodiesel engine through optimization technique. Technical science, 2013, vol.17, No1. 179-193.
199
method. Modern applied science, Vol. 4, No. 12. December 2010. 182-187.
[5] Vincent H Wilson, et al. Optimization of diesel engine parameters using Taguchi method and design of evolution. J. Of Brazil. Vol. 34, No. 4, 2012. 423-428.
[6] AshishKarnwal, et al. Multi response optimization of diesel engine performance parameters using tumba biodiesel-diesel blend by applying Taguchi method and Grey Relational analysis. International journal of Automotive technology. August 2011..
[7] Goutampohit and Diptenmishra. Optimization of performance and emission characteristics of diesel engine with Biodiesel using Grey-Taguchi method. Journal of engineering. Hindawipublishingcorporation. Vol. 2013. Article ID. 915357, 8 pages.
[8] M. I .Masood, A.N. Shaha, A. Aslam. Combustion and emission based optimization of Turbo charged diesel engine Run on biodiesel using Grey-Taguchi method. Technical journal, university of Engineering and Technology. [9] Nandkishor D Rao, Dr. B. Sudheerpremkumar.
Optimization of engine operating parameters. International journal of Mechanical
Engineering and Technology. Vol 5, issue 9, September 2014. 01-07.
[10] K. Sivaramakrishnan&P.Ravikumar. Performance optimization of karanja biodiesel engine using Taguchi approach and multiple regressions. ARPN Journal Engineering and Applied Science, April, 2012, Vol. 7. No.4, 506-516.
[11] Natraj.M, et al. Optimizing diesel engine parameters for low emissions using Taguchi method: Variation risk analysis approach Part-1. Indian journal of engineering and material science. Vol. 12,June 2005. 169-181.
[12] Marc Zellet, et al. Advancing modelling of DI Diesel engines: Investigation, high EGR level and multiple injection application to diesel combustion optimization. Proceedings of diesel engine emissions reduction. Conference, August, 21-25, 2005.
[13] Yang, B. Melkar, M and Chen, S.K. Multiple injections with EGR effects on NOx emissions for DI diesel engines analyzed using an engineering model. SAE paper. 2002-01-2774. [14] Murugesan. C, Umrani, R. Subramaian.