Linear Programming-Peed Manufacturing
PREFACE
This manual supplies basic information on the use of linear programming to solve feed manufacturing problems. Its primary purpose is to introduce feed manufacturers to the advantages provided by linear programming applications already in use. However, the principles formulated here are geared to the interest of the entire agricultural community. Spe-cifically, the manual provides an analysis of the feed manufacturing problem and illustrates the
CONTENTS
In.troduction • • • . . . • . . • . . . • • • • • 1
Problem Profile • . . . . . . • . . • • . 2
Problem Economics • . . . • • 2
Problem Description • • . . . • 2
Types of LP Models • . . . • . . . • • 2
Single Formula Model. . . • 3
Composite Formula Model. . . • • • 14
Multiformula Model • . . . • • 18
Programmed Profit Analysis Model • . . . • • • 22
Appendix: 1620/1311 LP System Output. . • • • 25
INTRODUCTION
The use of linear programming (LP) in feed manu-facturing necessitates a brief description of the nature of the industry, its key decisions, the use of the LP technique in making those deCiSions, and the potential advantages to be gained from such applica-tion. Particular emphasis is given to the use of the LP technique to:
• Reduce raw material procurement cost • Minimize feed formula cost
• Evaluate sensitivity of feed formulas to ingredient price changes
• Formulate feed of uniform quality
• Evaluate the cost of formulation specifications • Reduce inventory holding costs
• Determine most profitable product mix Linear programming is not a stranger to modern management. Its use first became commerCially significant in the early fifties, and the technique has become increasingly important in the last decade as a superior method of allocating the resources of business to achieve maximum profit or minimum cost. In fact, LP has become an indispensable aid to many firms that have successfully employed the technique in making important decisions.
Much of the effectiveness of the technique depends on how skillfully it is used. In this respect, the petroleum industry probably has led all others in the use of LP for gasoline blending and refinery sched-uling. Additional areas of successful commercial application include the following: meat packing, milk processing, steel fabricating, airline sched-uling, etc. (see reference 1).
Within the feed manufacturing industry, many of the major manufacturers use LP to reduce formula costs. In fact, companies that do not use the tech-nique frequently cannot be cost-competitive with those that do. Moreover, LP users generally have
better product quality control because of the tech-nical knowledge they have gained from programmed analysis of feed formulas.
Despite these advantages, the use of LP in the feed manufacturing industry has been relatively limited and restricted mainly to formulation prob-lems In fact, in many respects its application is still in its infancy. Fully effective use has been hindered by several major factors.
First, a lack of understanding has prevailed as to the amount of mathematical proficiency needed to use the technique. Despite popular impreSSions, it is not necessary to have a staff of highly trained LP specialists. It is important to have people who can understand the basiC elements of what the technique does, how problems can be formulated, and what all linear programming solutions mean in terms of management decisions. But all this does not require a high degree of mathematical dexterity. Instead, the main requirement for successful LP use is an intimate knowledge of the problem to be solved. Accurate representation must be given to the physical operations conSidered, to the economic performance criteria used, and to the overall managerial policies of the firm. Within such context, this manual is designed to provide the necessary background for development of LP models.
PROBLEM PROFILE
The feed formulation problem is one of determining the least-cost combination of feedstuff ingredients that can be used to meet predetermined product formulation specifications. The dimensions of the problem vary widely from company to company depending upon such factors as size of firm, ingre-dient availability, operating capaCity, product mix, and market position. For many firms, the problem is closely interrelated with raw material procure-ment policy, inventory policy, production scheduling, and product mix and price strategies. In such cases, the basic LP formulation model can be expanded to include this wide range of interdependent decis ion areas.
The maj or part of this manual deals with the basic formulation problem. The interrelated areas also are discussed but in less detail.
PROBLEM ECONOMICS
The use of LP makes savings possible in the numer-ous areas mentioned above. The most apparent benefit is the direct reduction in feed formula cost, which could run at a minimum of $2 per ton (see reference 3). This saving does not include the economic benefits accruing from improved feed quality and uniformity, or the longer-run benefits accruing from more accurate experimental formu-lation data.
Increased efficiency and allied benefits in other areas of feed manufacturing related to formulation also are important. Those most obvious include cost reductions in raw material procurement, inven-tory expense, and production scheduling. Normally, an LP formulation model of the major manufacturing operations includes over 90 percent of the costs associated with those operations, and the model can bring about cost reduction of up to $4 per ton of feed manufactured.
PROBLEM DESCRIPTION
The first problem analyzed is that of determining the least-cost formula for a complete broiler ration. Of
the 18 ingredients or feedstuffs that can be used in this ration, nine must fall within specified minimum and/or maximum rates of utilization. The remaining
feedstuffs can be used in any proportion desired as long as the other formulation specifications are met. Those specifications consist of 18 requirements relating to such factors as energy level, protein, fat, fiber, and amino acids.
The ingredients are assumed to be available in unlimited quantities at prevailing market prices. Delivery charges, processing, handling, and other costs associated with using ingredients directly from purchase or out of inventory are included in the ingredient costs used in the model.
The second problem analyzed is that of determin-ing least-cost formulas for a series of cattle, dairy, and hog supplements. In this case the model is similar to that developed initially but is designed to analyze sequentially a series of distinct formulas using one basic matrix. The model permits a greatly reduced computation time per formula and is the type that would be used on an operating bas is by feed manufacturers.
The third problem involves the development of a multiformula model where availability of ingredients is limited. The same basic model can be used to analyze manufacturing operations with other restric-tions, such as limitations in production and storage capacity.
The fourth problem also involves a multiformula model with various production and procurement restrictions. In addition, the problem is designed to analyze decisions relating to product mix and pricing strategy.
TYPES OF LP MODELS
A linear programming model is developed for each of the four types of managerial problems outlined in the preceding section. The models are mathematical representations of all known and estimated factors that influence the cost and/or profit of selected operations in feed manufacturing. They are repre-sentative of types of LP models currently being used within the industry, and they have proven commer-cial feasibility.
SINGLE FORMULA MODEL
The single formula model is designed to determine the least-cost combination of ingredients that can be used to meet predetermined product specifications. Today the most widespread application of LP in the feed manufacturing industry involves variations of this model. Because it is initially simple in con-cept, the single formula model forms the basis for development of more elaborate models. In this sense it is anecessary starting point for programmed analysis of feed formulation and related areas of manufacturing and marketing.
INFORMATION NEEDED
At minimum, three major areas must be considered in the initial analysis: (1) ingredient availability and cost, (2) ingredient composition, and (3) formula-tion specificaformula-tions for feed products. Much of the basic data is available from purchasing, accounting, and nutritional research. But problems exist involving variability in ingredient composition, rapidly changing ingredient prices, and competitive specifications for feed formulas. Moreover, it is important that such data accurately reflect company practice and policy relating to procurement, manu-facturing, and marketing. Significant discrepancies between the mathematical representation of the problem and actual company policy can destroy the effectiveness of the system.
INGREDIENT COST AND AVAILABILITY
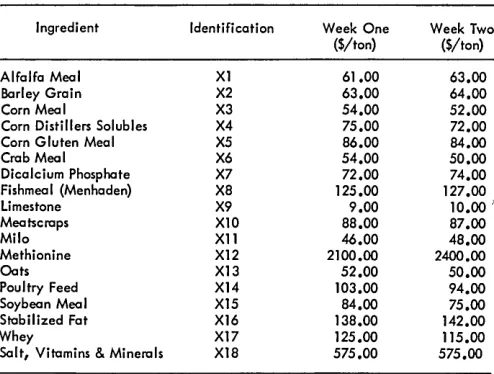
For purposes of discussion, 18 ingredients are assumed to be available for feed formulation (Figure
1). Supplies are adequate to meet the production needs of any ingredient. Two price situations are analyzed; they are referred to hereafter as !!week one" and !!week two" prices (Figure 1).
Least-cost formula guides are computed for each price situation, and the computations, in turn, demonstrate the sensitivity of feed cost and formula changes to changes in ingredient prices. Ingredient prices are based on management's best estimate of net procurement cost or disposal value, adjusted for delivery charges, handling, and other associated costs.
INGREDIENT COMPOSITION
Variation in composition is a continuing problem in feed formulation. In particular, variations in the levels of protein, fiber, amino acids, and certain physical characteristics are of prime importance. However, such problems are not unique to LP
Ingredient Identification Week One Week Two
($/ton) ($/ton)
Alfalfa Meal Xl 61.00 63.00
Barley Grain X2 63.00 64.00
Corn Meal X3 54.00 52.00
Corn Distillers Solubles X4 75.00 72.00
Corn Gluten Meal X5 86.00 84.00
Crab Meal X6 54.00 50.00
Dicalcium Phosphate X7 72.00 74.00
Fishmeal (Menhaden) X8 125.00 127.00
Limestone X9 9.00 10.00 )
Meatscraps Xl0 88.00 87.00
Milo Xll 46.00 48.00
Methionine X12 2100.00 2400.00
Oats X13 52.00 50.00
Poultry Feed X14 103.00 94.00
Soybean Meal X15 84.00 75.00
Stabilized Fat X16 138.00 142.00
Whey X17 125.00 115.00
[image:8.612.320.567.95.282.2]Salt, Vitamins & Minerals X18 575.00 575.00
Figure 1. Ingredient prices
formulation. They must be faced without regard to the methods used in determining formulas. Com-position measurement and control of ingredient quality are a difficult but necessary part of effective LP use.
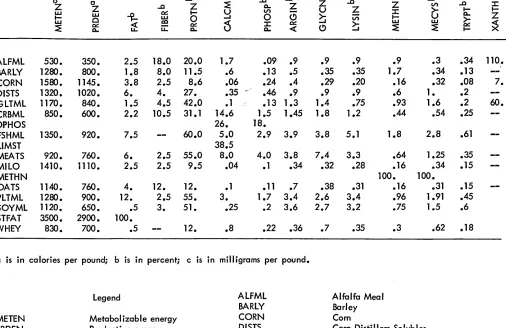
In this analYSiS, it is assumed that ingredient composition is constant (Figure 2), but in actual practice, management will have to update composi-tion indices periodically. Modern instrumentacomposi-tion and sampling techniques permit accurate and eco-nomic measurement of the nutrient content of ingredients. However, the cost of determining nutrient content must be .balanced against the loss experienced when a safety margin is added to mini-mum nutritional requirements, and this will vary widely with individual ingredients and requirements.
FORMULATION SPECIFICATIONS
Despite fundamental agreement within the industry on necessary formulation specifications, obvious differences of opinion exist among competing com-panies and nutritional experts. Generally recom-mended nutrient levels may not meet the needs of a particular market area or of competitive strategy. Non-nutrient standards also may vary from firm to firm.
In evaluating the given area, the LP analyst must gain consensus within his own company. All stand-ards must be clearly specified. The specifications that are built into the LP model must not err on either side of desired or actual operating practice.
...c ...c ...c ...c ...c ...c u
0 0 ...c
~ Z ...c
Z ...c :I:
Z ...c Z Q. Z V')
Z
u
Z~
l - I-w ~ I - U V') :I:
Q.
I - w ~ w 0 - I 0 C) ~ in I - Z
w 0
~ co
6
:I: ~~ w w ~
~
~ ~
u:
~4: C) ~ ~
Q. Q. Q. I
-AlFMl 530. 350. 2.5 18.0 20.0 1.7 .09 .9 .9 .9 .9 • 3 .34 110 •
·BARlY 1280. 800. 1.8 8.0 11.5 .6 .13 .5 .35 .35 1.7 .34 .13
CORN 1580. 1145. 3.8 2.5 8.6 .06 .24 .4 .29 .20 • 16 .32 .08
DISTS 1320. 1020. 6. 4. 27. .35 ~ .46 .9 .9 • 9 .6 1 • .2
GLTML 1170. 840. 1.5 4.5 42.0 .1 .13 1.3 1.4 .75 .93 1.6 .2
CRBMl 850. 600. 2.2 10.5 31.1 14.6 1.5 1.45 1.8 1.2 .44 .54 .25
DPHOS 26. 18.
FSHML 1350. 920. 7.5 60.0 5.0 2.9 3.9 3.8 5.1 1.8 2.8 .61
lIMST 38.5
MEATS 920. 760. 6. 2.5 55.0 8.0 4.0 3.8 7.4 3.3 .64 1.25 .35
MILO 1410. 1110. 2.5 2.5 9.5 .04 .1 .34 .32 .28 .16 .34 .15
METHN 100. 100.
OATS 1140. 760. 4. 12. 12. .1 .11 .7 .38 .31 .16 .31 .15
PlTMl 1280. 900. 12. 2.5 55. 3. 1.7 3.4 2.6 3.4 .96 1.91 .45
SOYML 1120. 650. • 5 3 • 51. .25 .2 3.6 2.7 3.2 .75 1.5 .6
STFAT 3500. 2900. 100.
WHEY 830. 700. • 5 12 • .8 .22 .36 .7 .35 .3 .62 .18
a is in calories per pound; b is in percent; c is in milligrams per pound.
Legend ALFML Alfalfa Meal
BARlY Barley
METEN Metabolizable energy CORN Com
PRDEN Productive energy DISTS Corn Distillers Solubles
FAT Fat GlTML Corn Gluten Mea I
FIBER Fiber CRBML Crab Meal
PROTN Protein DPHOS Dicalcium Phosphate
CAlCM Calcium FSHML Fi sh Mea I Menhaden
PHOSP Phosphorus lIMST Limestone
ARGIN Arginine MEATS Meatscraps
GlYCN Glycine MilO Milo
lYSIN Lysine METHN Methionine
METHN Methionine OATS Oats
MECYS Methionine and Cystine PlTMl Pou I try Mea I
TRYPT Tryptophane SOYML Soybean Mea I
XANTH Xanthophyll STFAT Stabilized Fat
WHEY Whey
Figure 2. Ingredient composition, single formula model
Where nutrient standards are not well defined, manufacturers in certain cases have specified, as a precautionary measure, minimum levels of use of key ingredients. For example, several uniden-tified growth factors can be expressed in terms of minimum levels of fish meal, whey, alfalfa meal, or other ingredients.
7 •
60.
Nutrient standards of the formula are defined in terms of such factors as protein (crude), fat, fiber, amino acids, and energy. Most of these require-ments are met by an acceptable combination of ingredients. However, vitamin and mineral require-ments usually are met only partially by feed ingre-dients. For purposes of simplification, it is assumed in this example, that a fixed amolUlt of
salt, vitamin, and mineral premixes is to be added
to the ration to guarantee that minimum needs are met in those areas.
[image:9.612.49.555.74.402.2]the non-nutrient factors in each ingredient. Unfor-tunately, however, to date such indices have not been precisely quantified. As a workable approach in the interim, non-nutrient standards are met through the imposition of maximum and/or minimum use levels of specific ingredients.
MODEL FORMULATION
The difficult task of model building lies in obtaining an accurate definition of the actual operating condi-tions under study. Careful calculation of the rele-vant cost, composition, and formulation specifica-tions data usually is more time consuming than the mathematical statement of the model or the actual processing of the model data.
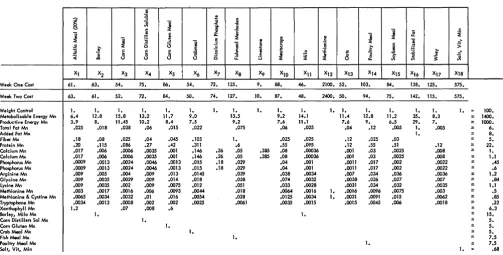
For the problem discussed above, the LP model or matrix is stated as shown in Figure 3. Each of the ingredients used in feed production is expressed as a matrix column or activity; formulation specifi-cations are stipulated by the rows and elements of the right-hand-side (RHS) column.
For initial analysis, production of 100 tons of feed is assumed. The cost row coefficients are expressed in terms of dollars per ton. With the exception of energy and xanthophyll requirements, coefficients of the row equations are expressed in terms of percent or portion of process volume of feed produced. For energy control, row coefficients are scaled to give control in terms of calories per
a
~
::g ~l
j -8~
1
{l
~ ~l
~ .~J! C i3 1i 1i
:2 J'
J
J
J
15 '8~
:( .8 8 c
Xl X2 X3 X4 X5 X6 X7 X8
Week One Cost 61. 63. 54. 75. 86. 54. 72. 125.
Week Two Cost 63. 61. 52. 72. 84. SO. 74. 127.
Weight Control 1. 1. 1. 1. 1. 1. 1. 1.
Metabolizable Energy Mn 6.4 12.8 15.8 13.2 11.7 9.0 13.5
Productive Energy Mn 3.9 8. 11.45 10.2 8.4 7.5 9.2
Total Fat Mn .025 .018 .038 .06 .015 .022 .075
Added Fat Mx
Fiber Mx .18 .08 .025 .04 • 045 .105 1 •
Protein Mn .20 • 115 .086 .27 .42 .311 .6
Caleium Mn .017 .006 .0006 .0035 .001 .146 .26 .05
Calcium Mx .017 .006 .0006 .0035 .001 .146 .26 .05
Phosphorus Mn .0009 .0013 .0024 .0046 .0013 .015 .18 .029
Phosphorus Mx .0009 .0013 .0024 .0046 .0013 .015 .18 .029
Arginine Mn .009 .005 .004 .009 .013 .0145 .039
Glycine Mn .009 .0035 .0029 .009 .014 .018 .038
Lysine Mn .009 .0035 .002 .009 .0075 .012 .051
Methionine Mn .003 .0017 .0016 .006 .0093 .00404 .018
Methionine & Cystine Mn .0065 .0034 .0032 .01 .016 .0054 .028
Tryptophane Mn .0034 .0013 .0008 .002 .002 .0025 .0061
Xanthophyll Mn 1.2 .07 .008 .6
Barley, Milo Mx 1.
Carn Distillers Sal Mx 1.
Cam Gluten Mx 1.
Crab Meal Mx 1.
Fish Meal Mx 1.
Poultry Meal Mx
Salt, VIt, Min
Figure 3. Matrix tableau, single formula model
pound for each pound of feed in the total volume processed. For xanthophyll control, row coeffi-cients are scaled to give control in terms of milli-grams per pound for each pound of feed in the total volume processed.
As formulated, the model provides for finding the minimum of the cost row function (formula cost), subject to the formulation specification constraints. The formula cost and formulation specifications are expressed as functions of the amounts of ingredients used. Ingredient utilization is represented by the symbols Xl.
Formula Cost Control
The cost per ton for each ingredient is given in the cost row. This row constrains the formula chosen to that combination of ingredients that satisfies all formulation specifications at the minimum possible cost. The equation may be stated as follows:
61.00 Xl + 63.00 X
2 + • •••• +575.00 XIS
(1-1)
=
minimumThus, alfalfa meal cost ($61) times amount used (Xl) plus barley cost ($63) times amount used (X2) plus ••••• plus salt, vitamin, and mineral premix cost ($575) times amount used (XIS) must equal a minimum.
l
of ~II
l
~ c
]
~'8
!
:>~ 0
~
l! t1
:;- -"~ ~ 8 ~ ~ ~
~ XIO X11 X12 X13 X14 X15 X16 X17 X18
9. 88. 46. 2100. 52. 103. 84. 138. 125. 575.
10. 87. 48. 2400. SO. 94. 75. 142. 115. 575.
1. 1. 1. 1. 1. 1. 1. 1. 1. 1. = 100.
9.2 14.1 11.4 12.8 11.2 35. 8.3
,.
1400.7.6 11.1 7.6 9. 6.5 29. 7. '" 1000.
.06 .025 • 04 .12 .005 1 • .005 '" 6.
1. s 8.
.025 .025 .12 .025 .03 s 5.
.55 .095 .12 .55 .51 .12 ,. 22 •
.385 .08 .00036 .001 • 03 .0025 .008 '" 1 •
.385 .08 .00036 .001 .03 .0025 .008 s 1.1
.04 .001 .0011 .017 .002 .0022
,.
.45.04 .001 .0011 .017 .002 .0022 s .6
.038 .0034 .007 .034 .036 .0036 '" 1.2
.074 .0032 .0038 .026 .027 .007 '" .84
.033 .0028 .0031 .034 .032 .0035 '" 1.1
.0064 .0016 1. .0016 .0096 .0075 .003 2: .5
.0125 .0034 1. .0031 .0091 .015 .0062 '" .85
.0035 .0015 .0015 .0045 .006 .0018
,.
.222: 6.3
1. s 15.
s 5.
s 5.
s S. s 7.S
1. s 7.S
[image:10.615.65.569.443.698.2]Process Volume
Process volume may be set at any desired level. Frequently, computations are made on a per ton or per pound basis. In this analysis, a 100-ton volume is used. Computer solutions may be interpreted in terms of tons of different ingredients in 100 tons of feed, or in terms of percentages of different ingre-dients in 100 percent of a ton of feed. This volume control may be formulated as follows:
Xl + X
2 + .•••• + X18
=
100 (1-2)That is, amount of alfalfa meal used (Xl) plus amount of barley used (X2) plus ..••. plus amount of salt; vitamin, and mineral premix used (X18) shall equal 100 tons.
Fat Content
Fat content is specified at a minimum level of six percent of finished product. Thus, for every 100 tons of feed produced, there must be a minimum fat level of six tons. The constraint is stated as follows:
• 025 Xl + .018 X2 + •.••. + .005 X
17::: 6 (1-3)
This specifies that fat level (2.5 percent) in alfalfa meal times amount used (Xl) plus fat level (1.8 per-cent) in barley meal times amount used (X2)
plus •.... plus fat level (.5 percent) in whey times amount used (X17) shall be equal to or greater than six tons out of the total production volume of 100 tons. For purposes of computer analysis, it may be necessary to convert the inequality statement (1-3) to an equality statement as follows:
.025 Xl + .018 X
2 + ••.. + .005 X17 - XNS
=
6(1-4)
This specifies that the amount of fat in the ingre-dients used (Xl ••.. X 17) less any excess (X negative slack or XNS) is equal to six. Any acceptable com-bination of ingredients must contain at least six tons of fat. If a least-cost combination of ingredients contains more than.six tons, the negative slack variable (XNS) takes the value of the excess, thereby maintaining a balance in the fat control constraint. other equal to or greater than inequalities are handled in a similar manner.
Generally, IBM LP systems accept inequalities and automatically generate slacks.
Protein Control
Crude protein content is specified at a minimum level of 22 percent of finished product or 22 tons of crude protein for every 100 tons of broiler ration produced. This control is established as follows:
.20 Xl + .115 X
2 + .... + .12 X17 ::: 22 (1-5) In other words, protein level (20 percent) in alfalfa meal times amount used (Xl) plus protein level (11.5 percent) in barley meal times amount used (X2) plus ... plus protein level (12 percent) in whey times amount used (X17) shall be equal to or greater than 22 tons for every 100 tons of feed produced.
other Nutrient Controls
other nutrient standards are handled in a similar manner. Note that most requirements are stated in terms of minimum levels of the various nutrient standards. However, maximum constraints are necessary for such items as fiber and calcium.
Individual Ingredient Controls
Utilization rates of individual ingredients may be controlled for nutritional or non-nutritional reasons . Generally, such controls are concerned with appear-ance, flavor, texture, odor, and possibly the growth factor. This type of constraint may be expressed as follows:
Barley, milo control
(1-6)
That is, barley used (X2) plus milo used (XII) shall be equal to or less than 15 tons. This inequality statement (1-6) is converted to an equality state-ment as follows:
X
2 + XII + XPS
=
15 (1-7)This specifies that the amount of barley (X2) plus the amount of milo (XII) plus the positive slack (XPS) must equal 15. Thus, barley and/or milo may constitute up to 15 percent of the ration. If the ingredients account for less than 15 percent, the positive slack variable takes the value of the differ-ence, thereby maintaining the balance in the barley, milo control equation.
Premix Control
and mineral needs are met. The control is ex-pressed as follows:
X
18
=
.68 (1-8)PROBLEM SOLUTION
The solution to the LP problem described above yields a wide range of data useful in feed manu-facturing, which in this initial model include the following:
1. Least-cost feed formula guides
2. Measurement of the sensitivity of least-cost formulas to changes in ingredient prices
3. Ingredient procurement guides
4. Measurement of the cost of formulation specifications
Too frequently, LP users are concerned solely with the basic least-cost formula data, while much or all of the collateral data is overlooked.
FORMULA GUIDES
Least-cost formula guides are supplied for each set of market conditions and formulation specifications analyzed. From these guides, management can quickly determine the particular formula that
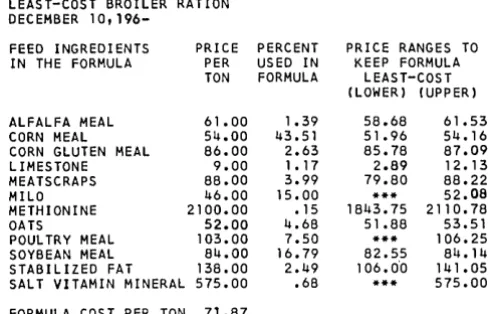
minimizes ingredient cost while meeting formulation specifications. For the problem under considera-tion, column 1 in Figure 4 lists the ingredients to be included in the least-cost formula; column 2 lists the cost of each ingredient to be used; and column 3 lists the percent of each ingredient to be used.
It may be seen that twelve of a possible 18 ingre-dients are included in the least-cost formula. Utilization rates range from a high of 43.51 percent for corn meal (X3) to 1.17 percent (Xg) for lime-stone. Utilization rates of micro ingredients range from .68 percent for the premixes (X18) to .15 per-cent for methionine (X12).
Note that Figures 4 and 5 are reports generated entirely by the computer and that copies can be made available for management within minutes after the least-cost formula problem has been entered into the machine. These particular reports stem from the IBM 1620 (4). Most other IBM machines have similar capacity.
In terms of the teclmical LP language, the amounts of ingredients specified for use are the activity levels or the values of the basis variables when an optimum solution has been obtained. These values may be read directly from the unedited com-puter output or may be transposed by clerical assistants. However, in most cases computer editing or report writing is the most effective way of getting decision guides that management can use directly.
LEAST-COST BROILER RATION DECEMBER
10,196-FEED INGREDIENTS PRICE PERCENT PRICE RANGES TO IN THE FORMULA PER USED IN KEEP FORMULA
TON FORMULA LEAST-COST (LOWER) (UPPER) ALFALFA MEAL 61.00 1.39 58.68 61.53 CORN MEAL 54.00 43.51 51.96 54.16 CORN GLUTEN MEAL 86.00 2.63 85.78 87.09
LIMESTONE 9.00 1.17 2.89 12.13
MEATSCRAPS 88.00 3.99 79.80 88.22
MILO 46.00 15.00 *** 52.08
METHIONINE 2100.00 .15 1843.75 2110.78
OATS 52.00 4.68 51.88 53.51
POULTRY MEAL 103.00 7.50 *** 106.25 SOYBEAN MEAL 84.00 16.79 82.55 84.14 STABILIZED FAT 138.00 2.49 106.0'0 141.05 SALT VITAMIN MINERAL 575.00 .68 *** 575.00 FORMULA COST PER TON 71.87
Figure 4. Least-cost broiler ration
RESERVE INGREDIENT BUY GUIDE DECEMBER
10,196-FEED INGREDIENTS PRICE PENALTY HIGHEST
NOT IN FORMULA PER COST FEASIBLE
TON PRICE
BARLEY 63.00 18.05 44.95
CORN DISTILLERS SOL 75.00 1.66 73.34
CRAB MEAL 54.00 .98 53.02
DICALCIUM PHOSPHATE 72.00 11 .00 61.00 FISH MEAL MENHADEN 125.00 • 15 124.85
WHEY 125.00 71.33 53.67
Figure 5. Reserve ingredient buy guide
Price Sensitivity
Sensitivity of least-cost formulas to changes in ingre-dient prices is indicated in Figure 4. These values are computed through a parametric analYSis of ingredient costs and measure the amount of ingre-dient price change that can occur (one at a time) without necessitating a change in the formula.
Cost ranges are given for each feedstuff included in the formula (columns 4 and 5). For example, alfalfa meal, priced at $61 per ton, is used at the rate of 1.3 9 percent in the formula. This utilization rate remains least-cost as long as the alfalfa meal price does not go below $58.68 per ton or above $61.53 per ton. Prices below $58.68 per ton bring an increase in use of alfalfa meal. Prices above $61.53 per ton cause alfalfa meal to be dropped from the formula. Similar ranges are given for all other feedstuffs included in the least-cost formula.
[image:12.615.327.572.69.226.2]other ranges may be relatively wide, but if either side of a given price range falls close to the market price, the particular ingredient becomes price sensitive. Meats craps , for example, has a price range of $79.80 to $88.22 per ton for the 3.99 per-cent utilization rate. However, the market price is $88 per ton. Thus, a slight upward pressure on the market price causes meats craps : to be dropped from the ration.
In certain cases, either side of the range may be unlimited. For example, consider poultry meal, priced at $103 per ton, with a utilization rate of 7.5 percent. Recall that poultry meal use (X14) is limited to a maximum level of 7.50 percent, that is:
(1-9)
Thus, the utilization rate in the least-cost ration already is at the maximum allowable level. The lower price range is unlimited (indicated by
***,
Figure 4). This means that the 7.50 percent utili-zation rate cannot be increased regardless of how much the price is lowered. The upper range indi-cates that the 7.50 percent utilization rate continues only as long as the price does not exceed $106.25 per ton.
It is important to remember that price ranges are valid only if they are considered one at a time. Usually, this is not unduly restrictive, since major price fluctuations frequently center around only one or two key ingredients. This is particularly true if the major concern is with those ingredients that make up the bulk of the ration. Of course, when price changes are more widespread, it is necessary to compute a new least-cost formula.
Procurement Guides
Ingredient procurement guides are supplied for each feed formula specified. An aggregation of each formula times volume produced gives the overall total use required. This aggregate use can be tallied from individual formula models, or from a multiformula model (as explained in later sections). The related questions of safety stocks, inventory capacity, material-in-process, and delivery lag times, also can be included in LP models.
A second type of procurement information avail-able from the single formula model is shown in Figure 5. Ingredients not included in the least-cost ration (nonbasis variables) are given along with the penalty cost (D / J values) of introducing those ex-cluded ingredients. For example, the use of barley increases the formula cost by $.1805 per ton for each one percent used in the formula.
Obviously, such information is of value to man-agement. Surpluses or shortages of available ingredients may raise the question of ingredient substitution. For example, fish meal does not come into the ration; however, if the ingredient is introduced to the formula, the increased cost is only $.15 per ton used. Thus, if other compelling reasons actually force its use, the penalty cost is sufficiently low to make it a desirable ingredient to include in the formula.
Furthermore, the penalty cost information also can be used for bargaining purposes. For example, given a market price of $75 per ton for corn dis-tillers solubles, and a penalty cost of $1.66 per ton, the highest feasible price (basis value) to pay for corn distillers solubles is $73.34 per ton ($75.00 -$1.66). At $73.34 per ton or less it is a good buy. At any higher price it is cheaper to use some other ingredient in the ration.
Cost of Formulation Specifications
The costs of individual formulation specifications are indicated in Figure 6. These are of direct use both to the nutritionist and to sales personnel. Specifically, the information provides an accurate guide to the cost of meeting both nutrient and non-nutrient standards. Furthermore, the range over which the calculated cost of the constraint is appli-cable also is given.
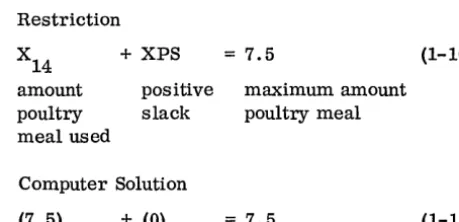
Upper Limit Constraints
Upper limit constraints specify the maximum allow-able level of use of an ingredient or of fiber or some other factor in the ration. For example, maximum use of poultry meal is limited to 7. 5 percent; fiber content is held to a maximwn level of five percent; etc.
Checking the computer solution values against the poultry meal restriction, we have the following:
Restriction
+
XPS amountpoultry meal used
positive slack
Computer Solution (7.5) + (0)
=
7.5maximum amount poultry meal
=
7.5(1-10)
[image:13.620.314.544.564.675.2]Constraint Amount Slack Unit Cost*
Mn Met Energy 14.00cal/lb 0 • 49
Mn Prd Energy 1000.cal/lb 29. 0
Mn Fat 6.00% 0 87.29
Mx Fiber 5.00% 1.80 0
Mn Protein 22.00% 0 22.42
Mn Calcium 1.00% .10 0
Mx Calcium 1.10% 0 63.32
Mn Phosphorus .45% 0 244.93
Mx Phosphorus .60% .15 0
Mn Arginine 1.20% .12 0
Mn Glycine .84% .34 0
Mn Lysine 1.10% 0 58.48
Mn Methionine .50% .0033 0
Mn Meth, & Cystine .85% 0 2066.62
Mn T ryp top ha n e .22% .003 0
Mn Xanthophyll 6.3mg/lb 0 3.90
Mx Barley, Milo 15.00% 0 6.08
Mx Corn Dist Sol 5.00% 5.00 0
Mx Corn Gluten 5.00% 2.37 0
Mx Crab Meal 5.00% 5.00 0
Mx Fish Meal 7.50% 7.50 0
Mx Pou I try Mea I 7.50% 0 3.25
Mx Stab Fat 8.00% 5.00 0
Salt, Premixes .60% 0 541.62
* Cents per ton per unit of restriction.
Figure 6. Specification costs week one
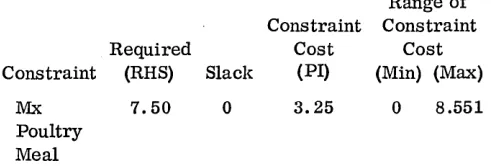
The collateral information given by the computer may be summarized as follows:
Required Constraint (RHS)
Mx Poultry Meal 7.50 Constraint Cost Slack (PI)
o
3.25Range of Constraint
Cost (Min) (Max)
o
8.551Colunms 1 and 2 indicate each constraint and its required amoWlt.
Colunm 3 indicates whether the constraint has become restrictive. If the slack variable comes into solution at a zero value as in the case of poultry meal use, the constraint is limiting. If the slack variable comes into solution at a positive value, the constraint is not limiting.
Colunm 4 indicates the cost of including the restriction in the model and is known technically as the marginal cost. In the case of the poultry meal maximum constraint, the cost is 3.25 cents per per-cent per ton. That is, for each perper-cent of relaxa-tion in the constraint, the cost is decreased by 3.25 cents per ton.
Minimum Maximum Value Value
1366. 1417 •
*** 1030.
5.256 10.430
3.186 ***
21.337 22.155
*** 1.100
1.000 1.550
.404 .494
.450 ***
*** 1.316
*** 1.185
1.084 1.149
*** .502
.848 2.019
*** .223
4.476 8.358
6.555 23.788
0 ***
2.634 ***
0 ***
0 ***
0 8.551
2.486 ***
0 1.849
Colunms 5 and 6 indicate the range over which the cost is applicable. In this case, the 3.25 cent cost holds from zero utilization (Minimum) to utilization at the 8.551 percent level (Maximum). Similar information is given for the other upper limit constraints (Figure 6). It should be noted that many of the upper limits on ingredient utilization are not limiting.
Lower Limit Constraints
Lower limit constraints specify the minimum allow-able level of use of an ingredient, or of fat, protein, or some other nutrient in the ration. Most of the restrictions are of this type and concern levels of fat, protein, energy, and amino acids. Consider the following:
AmoWlt Constraint
Constraint Required Slack Cost Fat
Protein Glycine
6.000 0 22.000 0
.840 .340
87.29 22.42 0.00
Range of Constraint
Cost (Min) (Max)
[image:14.613.61.307.456.539.2]Meeting the minimum fat requirement costs 87 . 29 cents per percent of the fat requirement per ton from a minimum of 5.256 percent to a maximum of 10.430 percent. Thus, lowering the fat requirement from six percent to five percent decreases per ton costs by 87.29 cents. Similarly, the protein constraint costs 22.42 cents per percent per ton from the 21.337 per-cent level to the 22.155 perper-cent level. other con-straints, such as glycine (excess of .340), do not become limiting. In this case, the constraint is without cost from a range of zero up to the 1.185 percent level.
Price Variations
For purposes of illustration, the initial broiler ration problem was analyzed under conditions of week two prices. All other parameters are identical to those of the initial problem. Management guides, developed for the new price conditions, form a basis for measuring the impact of price changes.
Relative price changes between week one and week two are not very great. The overall price level is lower for week two, and the relative position of selected ingredients is changed. However, the over-all pattern is typical of the types of changes that evolve from week to week.
MANAGEMENT GUIDES
[image:15.613.305.546.200.291.2]Formula cost decreased from $71. 87 per ton in week one (Figure 4) to $69.26 per ton in week two
(Figure 7). Major ingredient changes included significant increases in soybean meal, alfalfa meal, and crab meal. Corn gluten meal was dropped from the ration, and utilization of oats was cut back sharply. other changes were of more modest proportions.
LEAST-COST BROILER RATION DECEMBER
17,196-FEED INGREDIENTS PRICE IN THE FORMULA PER
TON ALFALFA MEAL 63.00
CORN MEAL 52.00
CRAB MEAL 50.00
DICALCIUM PHOSPHATE 74.00
LIMESTONE 10.00
MILO 48.00
METHIONINE 2400.00
OATS 50.00
POULTRY MEAL 94.00 SOYBEAN MEAL 75.00 STABILIZED FAT 142.00 SALT VITAMIN MINERAL 575.00 FORMULA COST PER TON 69.26
PERCENT USED IN FORMULA 2.70 43.73 1.63 .72 .82 15.00 .15 1.93 7.50 22.37 2.77 .68
Figure 7. Least-cost broiler ration
PRICE RANGES TO KEEP FORMULA
LEAST-COST (LOWER) (UPPER)
53.09 65.72 50.44 54.42 47.79 56.78 34.34 103.92 *** 16.76 *** 49.69 1869.26 2854.22 48.17 51.49 *** 98.38 71.87 76.83 11 O. 24 203.04 *** 575.00
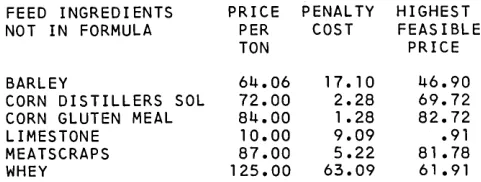
The least-cost formula for week one is generally more sensitive to upward price pressure than is the formula for week two. The absolute price changes are of similar magnitudes for both weeks; however, week one upper limits are closer to market prices than are those of week two. Penalty costs (D/ J values) for ingredient substitution are generally prohibitive in both weeks (see Figure 8).
RESERVE INGREDIENT BUY GUIDE DECEMBER
17,196-FEED INGREDIENTS PRICE PENALTY HIGHEST
NOT IN FORMULA PER COST FEASIBLE
TON PRICE
BARLEY 64.06 17.10 46.90
CORN DISTILLERS SOL 72.00 2.28 69.72 CORN GLUTEN MEAL 84.00 1.28 82.72
LIMESTONE 10.00 9.09 .91
MEATSCRAPS 87.00 5.22 81 .78
WHEY 125.00 63.09 61 .91
Figure 8. Reserve ingredient buy guide
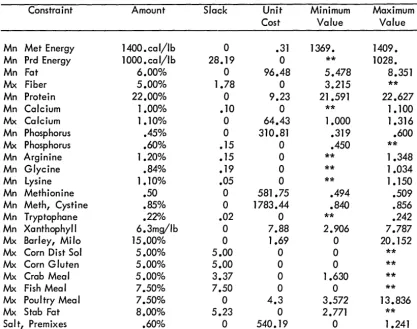
Changes in the costs of nutrient formulation restrictions partially reflect decreases in the over-all price level. However, increases in marginal costs occurred in the cases of fat, calcium, methio-nine, and xanthophyll. Changes in costs of non-nutrient specifications are traceable more directly to ingredient price changes (see Figure 9).
As a matter of practical application, if meaning-ful interpretation is to be given, it is necessary to analyze marginal costs over a series of weeks. For most feed formulas, some marginal costs are relatively stable, while for others they are very sensitive and unstable. Hence, the need for a com-pOSite analysis of values over a given period.
MODEL VARIATIONS
In addition to the usual model constraints discussed in connection with the single formula model, it may be necessary to use constraints of the following type: (1) ratio constraints, (2) dual constraints, (3) feed density constraints, and (4) blocking con-straints. In general, these serve to increase the effectiveness of the LP technique.
Ratio Constraints
[image:15.613.43.283.547.696.2]Constraint Amount Slack
Mn Met Energy 1400.cal/lb 0
Mn Prd Energy 1000. cal/lb 28.19
Mn Fat 6.00% 0
Mx Fiber 5.00% 1.78
Mn Protein 22.00% 0
Mn Calcium 1.00%
.10
Mx Calcium 1 .100/0 0
Mn Phosphorus .450/0 0
Mx Phosphorus .60% .15
Mn Arginine 1.20% .15
Mn Glycine .84% .19
Mn Lysine 1.10% .05
Mn Methionine .50 0
Mn Meth, Cystine .85% 0
Mn Tryptophane .22% .02
Mn Xanthophyll 6.3mg/lb 0
Mx Barley, Mi
10
15.00% 0Mx Corn Dist Sol 5.00% 5.00
Mx Corn Gluten 5.00% 5.00
Mx Crab Meal 5.00% 3.37
Mx Fish Meal 7.50% 7.50
Mx Pou I try Mea I 7.50% 0
Mx Stab Fat 8 .. 00% 5.23
Sal t, Premixes
.60%
0Figure 9. Specification costs, week two
(for example, fish meal, X8i meatscraps, X10i and poultry meal, X14) must be equal to or less than 18 percent of the plant origin, high protein ingredient (soybean meal, X15). This constraint may be stated as follows:
(1-12)
That is, the amount of fish meal (XS) plus the amount of meats craps (X 10) plus the amount of poultry meal (X14) shall be equal to or less than IS percent of the amount of soybean meal (X15). For purposes of computer analysis, the right-hand-side term (.18 X15) is transposed to the left-hand-side to give the following:
(1-13)
This type of constraint permits accurate control of the overall use of a group of ingredients in the formula without unduly restricting the use of indi-vidual ingredients. Maximum flexibility of ingre-dient substitution is also allowed in meeting the overall formulation specifications.
Unit Minimum Maximum
Cost Value Value
.31 1369. 1409.
0
**
1028.96.48 5.478 8.351
0 3.215
**
9.23 21.591 22.627
0
**
1.10064.43 1.000 1.316
310.81 .319 .600
0 .450
**
0
**
1.3480
**
1.0340
**
1.150581.75 .494 .509
1783.44 .840 .856
0
**
.2427.88 2.906 7.787
1.69 0 20.152
0 0
**
0 0
**
0 1.630
**
0 0
**
4.3 3.572 13.836
0 2.771
**
540.19 0 1.241
Dual Constraints
The use of a dual constraint is illustrated in the single formula model in connection with the methio-nine and cystine requirements. These are typical of the type of nutritional interrelationships that need to be controlled with a dual constraint. The problem arises from the fact that methionine can satisfy the cystine requirement, but cystine cannot satisfy the methionine requirement. Formulation models that include only a methionine requirement and a cystine requirement overlook this important nutritional interrelationship, thereby imposing an economic penalty on the formula. Recognition is not given to the dual role being performed by methionine. This problem is solved through the use of a dual constraint.
Thus, in addition to the methionine requirement constraint, a dual constraint for methionine and cystine is included as follows:
Methionine Requirement
.003 Xl + .0017 X
2 + .... + .003 X17 ~.5 (1-14)
[image:16.623.64.481.55.384.2]Methionine and Cystine Requirement .0065 Xl + .0034 X
2 + .... + .0062 X17 :! .85 (1-15) The omission of the latter dual constraint can increase formula costs by as much as $1 per ton.
Feed Density Constraints
The use of feed density constraints is a relatively recent development in the feed manufacturing
industry. Nutrient requirements are stated in terms of each calorie of metabolizable energy in the feed. This ensures a uniform density of all essential nutrients for each calorie of metabolizable energy.
Formulas are chosen by the model to give a mini-mum cost for total nutrients. The follOwing illus-trates the type of constraints being used:
Conventional Energy Control
Weight:
Xl + X
2 + .... + X17
=
100 (1-16a) Total ingredient use must equal 100 percent of a ton.Metabolizable Energy:
6.4 Xl + 12.8 X
2 + .... + 8.3 X17 :! 1400 (1-16b) Caloric content of the feed must equal at least 1400 calories per pound or 2,800,000 calories per ton of feed. In equation (1-16b), the coefficients on the metabolizable energy restraint have been scaled to give energy control in terms of calories per pound for each pound of the ton of feed. Should the analyst desire to state the restraint in terms of calories per ton, he would express it as follows:
12,800 Xl + 25,600 X2 + ....
+16,600 X17 ~ 2,800,000 (1-16c)
Both equations (1-16b and 1-16c) provide identical restraint on the formulation model. The latter equation (1-16c) specifies the number of calories required in a ton of feed. The former equation (1-16b) speCifies the number of calories required in each pound of the ton of feed. For discussion purposes, the per pound form of the equation is used.
All other nutrient requirements of the formula may be expressed as a percent or portion of the weight of the feed.
Variable DenSity Energy Control
Metabolizable Energy:
6.4 Xl + 12.8 X
2 + .... + 8.3 X17
- X18
=
0 (1-16d)X18
=
1400 (1-16e)The total energy level in the formula is given by the value of variable X18 (1-16d). This level is set at 1400 calories (1-16e). No specification is made as to the weight of the feed containing the 1400 calories. Depending on relative ingredient costs, it may not take a pound of feed to obtain that calorie level. The model is designed to get 1400 calories with the least-cost combination of ingredients, sub-ject to the other formulation restraints. Thus, it is possible for the calorie/weight ratio to exceed the previous 1400 calories per pound relationship.
The important ratios in this case are those relating to nutrient requirements. A uniform amount of all essential nutrients must be provided for each calorie of metabolizable energy in the feed. This is accomplished in the follOwing manner:
Arginine Control:
.009 Xl + .005 X
2 + .... + .0036 X17
~ .00085 X18 (1-17) Arginine content must be equal to or greater than a specified fraction of total energy (X18)'
Glycine Control:
.009 Xl + .0035 X2 + .... + .007 X17
~.0006 X
18 (1-18) GlYCine content must be equal to or greater than a specified fraction of total energy (X18)'
When the model gives formulas with over 1400 calories per pound (it takes less than a pound of feed to get 1400 calories), the cost of total nutrients is reduced. Thus, the cost of feeding performance is reduced for a given nutrient input.
Blocking Constraints
Blocking constraints can be used to exclude quickly from the formula ingredients that are already built into a model. Only one constraint is needed for each model. The role of the constraint is to pro-hibit the use of any ingredient that is not available or that management does not wish to include in the formula. For example, if alfalfa meal (Xl), crab
meal (X6), and milo (X11) are to be excluded, the blocking constraint can be stated as follows:
COMPOSITE FORMULA MODEL
Greatly increased computational efficiency is achieved through the use of the composite formula model. Normally, a feed manufacturer develops a small number of composite models to generate formulation guides for his entire line of feeds. Each composite model is used to represent a group of feeds that have much in common in terms of formu-lation specifications and ingredients used. To illustrate the use of this type of model, formulas for a group of six cattle, dairy, and hog supple-ments are analyzed.
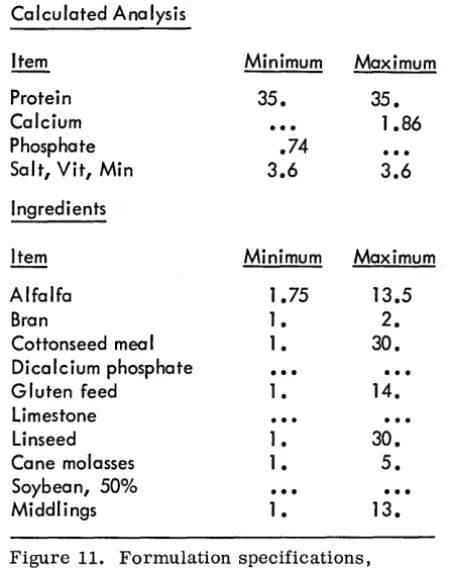
FORMULA TION SPECIFICATIONS
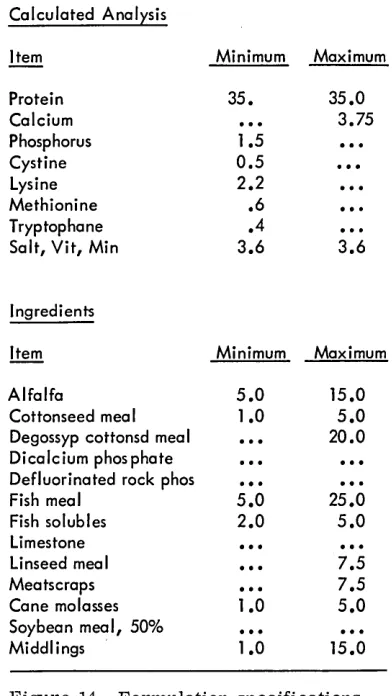
For this series of feed supplements, formulation specifications are given in Figures 10 through 15. The formulas, including the high protein, urea formulas, are designed to provide a supplement to feed grains. Specifications on ingredient utilization rates are used to control, in addition to protein, calCium, and phosphorus requirements, the formu-lation of cattle and dairy supplements. The hog supplements have additional requirements in terms of minimum levels of selected amino acids.
Calculated Analysis
Item Protein Calcium Phosphate Salt, Vit, Min
Ingredients
Item Alfalfa
Bran
Cottonseed mea I Dicalcium phosphate Gluten feed
Limestone Linseed Cane molasses Soybea n,
50%
Middlings Urea
Sodium sulphate
Minimum Maximum
55.
55.
3.
1 .2
3.B
3.B
Minimum Maximum
1.75
13.5
1.
2.
1.
30.
...
1 •
lB.
1 •
30.
1 •
5.
...
1 •
13.
9.
9.
1.2
1.2
Figure 10. Formulation specifications,
55% cattle supplement
Calculated Analysis
Item Protein Calcium Phosphate Salt, Vit, Min Ingredients
Item Alfalfa Bran
Cottonseed mea I Dicalcium phosphate Gluten feed
Limestone Linseed Cane molasses Soybean,
50%
[image:19.618.278.521.87.712.2] [image:19.618.299.526.92.376.2]Middlings Minimum
35.
.74
3.6
Minimum1.75
1 •
1 •
1 •
1 •
1 •
1 •
Maximum35.
1.B6
3.6
Maximum13.5
2.
30.
14.
30.
5.
13.
Figure 11. Formulation specifications,
35% cattle supplement Calculated Analysis
Item Minimum Maximum
Protein
55.
55.
Calcium
3.
Phosphate
1.2
Salt, Vit, Min
3.B
3.B
Ingredients
Item Minimum Maximum
Alfalfa
1.75
13.5
Bran
1.5
3.
Cottonseed mea I
1 •
30.
Dicalcium phosphate
Gluten feed
1 •
lB.
Limestone
...
Linseed
1 •
30.
Cane molasses
1 •
5.
Soybean,
50%
. ..
Middlings
1 •
13.
Urea
9.
9.
Sodium su Iphate
1.2
1.2
Figure 12. Formulation specifications,
Calculated Analysis
Item Minimum Maximum
Protein 35. 35.
Calcium 1.86
Phosphate .74
Salt, Vit, Min 3.6 3.6 Ingredients
Item Minimum Maximum
Alfalfa 1.75 13.5
Bran 1 • 3.
Cottonseed mea I 1 • 30. Dicalcium phos phate
Gluten feed 1 • 14.
Limestone
Linseed 1 • 30.
Cane molasses 1 • 5.
Soybean, 50%
Middlings 1 • 13.
Figure 13. Formulation specifications, 35% dairy supplement
Calculated Anallsis
Item Minimum Maximum
Protein 35. 35.0
Calcium 3.75
Phosphorus 1.5
Cystine 0.5
Lysine 2.2
Methionine .6
Tryptophane .4
Salt, Vit, Min 3.6 3.6
Ingredients
Item Minimum Maximum
Alfalfa 5.0 15.0
Cottonseed mea I 1.0 5.0 Degossyp cottonsd mea I 20.0 Dicalcium phos phate
Defluorinated rock phos
Fish meal 5.0 25.0
Fish solubles 2.0 5.0 Limestone
Li nseed mea I 7.5
Meatscraps 7.5
Cane molasses 1.0 5.0 Soybean meal, 50%
Middlings 1.0 15.0
Figure 14. Formulation specifications, 35% hog grower supplement
Calculated Anal~sis
Item Minimum Maximum
Protein 35. 35.0
Calcium 3.75
Phosphorus 1.5
Cystine 0.5
Lysine 2.2
Methionine .6
Tryptophane .4
Salt, Vit, Min 3.6 3.6
Ingredients
Item Minimum Maximum
Alfalfa 1.0 15.0
Cottonseed mea I 5.0
Degossyp cottonsd mea I 20.0 Dicalcium phosphate
Defluorinated rock phos
Fish meal 5.0 25.0
Fish solubles 2.0 5.0 Limestone
Linseed meal 7.5
Meatscraps 22.5
Cane molasses 1.0 5.0 Soybean meal, 50%
[image:20.612.331.525.63.393.2]Middlings 1.0 15.0
Figure 15. Formulation specifications, 35% hog finisher supplement
The information needed for composite model building is identical to that required for the single formula model. Each of the ingredients us ed in the feed formula is expressed as a matrix colunm or activity. Formulation specifications are stipulated by the rows and the elements of the right-hand-side (RHS) colunm. A unique right-hand-side colunm is provided for each supplement formula considered. Specifically, the first RHS gives the requirements for Cattle Supplement 55, the second RHS gives the requirements for Cattle Supplement 35, and so on (Figure 16).
[image:20.612.64.257.66.308.2] [image:20.612.63.259.350.698.2]... (S.
~ "R
"M m
..
(S. ~ ~(S. ~ ] --:0
(S.
..,
'CO 1l€
?f'
1i 1iI
j ~ (S. .! -0 €~ ~ ~ €
1i
1i c
..,
;: c1l g
1
:g ~~ £
..
l
~ ~2 2
J! 'u :g (;
..,
:E 1i
~
~ '8j
.r. ~~
::<
~ a15 tE 2
u u: u ::;
Cost Control 58. 34. 66. 70. 82. 74. 127. 75. 40. 10. 64.
Weight Control 1. 1. 1. 1. 1. 1. 1. 1. 1. 1. 1.
Protein Control .2 .15 .42 .42 .6 .31 .222 .351
Calcium M.x .017 .001 .0015 .0015 .23 .339 .05 .0014 .004 .38 .0033
Phosphorus Mn .0009 .012 .011 .011 .187 .146 .025 .0065 .008 .0081
Cystine Mn .0017 .0019 .0085 .0085 • 01 .003 .0051 .0065
Lysine Mn .009 .006 .0155 .0155 .051 .021 .008 • 013
Methionine Mn .003 .0019 .0058 .0058 • 018 .0093 .0031 .0078
Tryptophane Mn .0034 .0021 .005 .005 .0061 .0036 .0022 .0052
Alfalfa Mn 1.
Alfalfa M.x 1.
Wheat Bran Mn 1.
Wheat Bron M.x 1.
Cattanseed Mn 1.
Cottanseed M.x 1.
Cottanseed Deg. M.x 1.
Fish Meal Mn 1.
Fish Meal M.x 1.
Fish Solubles Mn 1.
Fish Salubles M.x 1.
Corn Gluten Mn 1.
Corn Gluten M.x 1.
linseed Mn 1.
linseed M.x 1.
Meatscraps M.x
Middlings Mn Middlings M.x
Molasses Mn
Molasses M.x
Urea Control Salt, Vit, Min
Figure 16. Matrix tableau, composite formula model
processed. For xanthophyll control, row coeffi-cients are scaled to give control in terms of milli-grams per pound for each pound of feed in the total volume processed.
PROBLEM ANALYSIS
In the actual problem analysis, a least-cost formula is found for each of the RHS or formula specifica-tions. Thus, in the case of Cattle Supplement 55, the least-cost combination of ingredients must con-tain 55 percent protein, a maximum of three percent calcium, and a minimum of 1.2 percent phosphorus (Figure 16). Specifications also are given in terms of utilization of individual ingredients: for example, alfalfa meal has a minimum use rate of 1.75 percent and a maximum of 13.5 percent; bran has a mini-mum use rate of one percent and a maximini-mum of two percent; etc.
After the least-cost formula has been computed for this first RHS, another least-cost formula is calculated to meet the needs of the second RHS.
"M
?5 "iO "'j;.
?5 ?5
'N
.~
€ ~ It') :q
l
c It') It') :q~ ?5 ~ It')
~ B. ~ -:0
J
8: 8: 8:~
e ~ -~ J:
2
€ :> ..il ..il ~~ 2 1i is ~ ~ -~
..
..
~ ~ ~~ ~ ~ ]
8
8
8
8
8' 8'~ :> :I: :I:
104. 34.5 45. 75. 100. 78.
1. 1. 1. 1. 1. 1. = 100. 100. 100. 100. 100. 100. .499 .158 .03 .51 2.6 = 55. 35. 55. 35. 35. 35. .11 .001 .006 .0025 :$ 3. 1.86 3. 1.86 3.75 3.75 .06 .008 .0008 .002 2: 1.2 .74 1.2 .74 1.5 1.5 .006 .0019 .008 2: O • O. O. O. .5 .5
• 035 .007 • 032 2: O • O • O • O. 2.2 2.2
• 007 .002 • 0075 "2: O • O • O • O. .6 .6 • 0031 .002 • 006 2: O. O • O • O. .4 .4
1.
2: 1.75 1.75 1.75 1.75 5. 1.
:$ 13.5 13.5 13.5 13.5 15. 15.
2: 1. 1. 1.5 1. O. O.
:$ 2. 2. 3. 3. O. O.
2: 1. 1. 1. 1. 1. O.
:$ 30. 30. 30. 30. 5. 5.
:$ 0.- O. O. O. 20. 20.
2: O. O. O. O. 5. 5.
:$ O. O. O. O. 25. 25.
2: O. O. O. O. 2. 2.
:$ O. O. O. O. 5. 5.
2: 1. 1. 1. 1. O. O.
:$ 18. 14. 18. 14. O. O.
2: 1. 1. 1. 1. O. O.
:$ 30. 30. 30. 30. 7.5 7.5
:$ O. O. O. O. 7.5 22.5
1. 2: 1. 1. 1. 1. 1. 1.
1. :$ 13. 13. 13. 13. 15. 15.
1. 2: 1. 1. 1. 1. 1. 1.
1. :$ 5. 5. 5. 5. 5. 5.
I. :$ 9. O. 9. O. O. O. 1. = 3.8 3.6 3.8 3.6 3.6 3.6
This process is continued until least-cost formulas have been calculated for each RHS or feed.
The major reduction in computational time arises from the fact that the selected group of supplements uses common ingredients and has similar specifica-tions. The least-cost formula for the first RHS is similar to the least-cost formula for the second RHS; the least-cost formula for the second RHS is similar to the least cost formula for the third RHS; etc. Once the initial least-cost formula has been obtained, a comparatively small amount of additional computing time is required to determine the remain-ing formulas. Analysis of the management guides data for these supplements reveals their inherent similarities (Figures 17 through 22).
[image:21.613.38.548.70.365.2]LEAST-COST CATTLE SUPPLEMENT 55 LEAST-COST DAIRY SUPPLEMENT 35
DECEMBER 10,196- DECEMBER
10,196-FEED INGREDIENTS PRICE PERCENT PRICE RANGES TO FEED INGREDIENTS PRICE PERCENT PRICE RANGES TO IN THE FORMULA PER US ED IN KEEP FORMULA IN THE FORMULA PER USED IN KEEP FORMULA
TON FORMULA LEAST-COST TON FORMULA LEAST-COST
(LOWER) (UPPER) (LOWER) (UPPER)
ALFALFA MEAL 58.00 1.75 35.53 *** ALFALFA MEAL 58.00 1. 75 36.81 *** WHEAT BRAN 34.00 1.00 33.51 *** WHEAT BRAN 34.00 3.00 *** 35.05
COTTONSEED MEAL 66.00 30~00 *** 67.13 COTTONSEED MEAL 66.00 30.00 *** 67.49
DICALCIUM PHOSPHATE 82.00 3.43 59.40 90.00 DICALCIUM PHOSPHATE 82.00 .64 45.50 92.39
CORN GLUTEN FEED 40.00 18.00 *** 41.04 CORN GLUTEN FEED 40.00 14.00 *** 42.26
LIMESTONE 10.00 2.64 8.03 10.76 LIMESTONE 10.00 3.89 *** 12.34
LINSEED MEAL 64.00 1.00 57.32 *** LINSEED MEAL 64.00 1.00 57.99 *** WHEAT MIDDLINGS 34.50 1.00 32.98 *** WHEAT MIDDLINGS 34.50 8.12 33.46 45.20
MOLASSES 45.00 1.00 14.09 *** MOLASSES 45.00 1.00 16.17 *** SOYBEAN MEAL 75.00 27.38 73.63 76.66 SOYBEAN MEAL 75.00 33.00 73.02 78.35
UREA 100.00 9.00 *** 337.45 SALT VITAMIN MINERAL 78 .• 00 3.60 *** *** SAL T VITAMIN MINERAL 78.00 3.80 *** ***
FORMULA COST PER TON 59.79
FORMULA COST PER TON 65.36
Figure 17. Least-cost 55% cattle supplement Figure 20. Least-cost 35% dairy supplement
LEAST-COST CATTLE SUPPLEMENT 35
DECEMBER 10,196- LEAST-COST HOG GROWER SUPPLEMENT 35
DECEMBER
10,196-FEED INGREDIENTS PRICE PERCENT PRICE RANGES TO
IN THE FORMULA PER USED IN KEEP FORMULA FEED INGREDIENTS PRICE PERCENT PRICE RANGES TO TON FORMULA LEAST-COST IN THE FORMULA PER USED IN KEEP FORMULA
(LOWER) (UPPER) TON FORMULA LEAST-COST
(LOWER) (UPPER) ALFALFA MEAL 58.00 1.75 36.81 ***
WHEAT BRAN 34.00 2.00 *** 35.05 ALFALFA MEAL 58.00 5.00 52.24 *** COTTONSEED MEAL 66.00 30.00 *** 67.49 COTTONSEED MEAL 66.00 1.00 57.76 *** DICALCIUM PHOSPHATE 82.00 .66 45.50 92.39 DICALCIUM PHOSPHATE 82.00 5.45 25.07 101.52
CORN GLUTEN FEED 40.00 14.00 *** 42.26 FISH MEAL 127.00 6.81 112.27 242.29
LIMESTONE 10.00 3.88 *** 12.34 FISH SOLUBLES 75.00 5.00 *** 81.36
LINSEED MEAL 64.00 1.00 57.99 *** LIMESTONE 10.00 5.01 *** 46.10 WHEAT MIDDLINGS 34.50 9.13 33.46 45.20 LINSEED MEAL 64.00 1.96 46.87 74.04
MOLASSES 45.00 1.00 16.17 *** WHEAT MIDDLINGS 34.50 15.00 *** 53.50
SOYBEAN MEAL 75.00 32.98 73.02 78.35 MOLASSES 45.00 2.52 31.21 55.98
SAL T VITAMIN MINERAL 78.00 3.60 *** *** SOYBEAN MEAL 75.00 48.65 26.04 88.56 SAL T VITAMIN MINERAL 78.00 3.60 *** *** FORMULA COST PER TON 59.80
FORMULA COST PER TON 67.78 Figure 18. Least-cost 35% cattle supplement
Figure 2l. Least-cost 35% hog grower supplement
LEAST-COST DAIRY SUPPLEMENT 55
DECEMBER
10,196-FEED INGREDIENTS PRICE PERCENT PRICE RANGES TO LEAST-COST HOG FINISHER SUPPLEMENT 35 IN THE FORMULA PER USED IN KEEP FORMULA DECEMBER
10,196-TON FORMULA LEAST-COST FEED INGREDIENTS PRICE PERCENT PRICE RANGES TO (LOWER) (UPPER) IN THE FORMULA PER USED IN KEEP FORMULA ALFALFA MEAL 58.00 1. 75 35.53 *** TON FORMULA (LOWER) (UPPER) LEAST-COST
WHEAT BRAN 34.00 1.50 33.51 *.;t*
COTTONSEED MEAL 66.00 30.00 *** 67.13 ALFALFA MEAL 58.00 1.00 52.24 ***
DICALCIUM PHOSPHATE 82.00 3.40 59.40 90.00 DICALCIUM PHOSPHATE 82.00 5.49 25.07 1Q1.52
CORN GLUTEN FEED 40.00 18.00 *** 41.04 FISH MEAL 127.00 6.38 112.27 242.29
LIMESTONE 10.00 2.32 8.03 10.76 FISH SOLUBLES 75.00 5.00 *** 81.36
LINSEED MEAL 64.00 1.00 57.32 *** LIMESTONE 10.00 5.17 *** 46.10
WHEAT MIDDLINGS 34.50 1.00 32.98 *** LINSEED MEAL 64.00 3.71 46.87 74.04
MOLASSES 45.00 1.00 14.09 *** WHEAT MIDDLINGS 34.50 15.00 *** 53.50
SOYBEAN MEAL 75.00 27.23 73.63 76.66 MOLASSES 45.00 4.42 31.21 55.98
UREA 100.00 9.00 *** 337.45 SOYBEAN MEAL 75.00 50.23 26.04 88.56
SAL T VITAMIN MINERAL 78.00 3.80 *** *** SAL T VITAMIN MINERAL 78.00 3.60 *** *** FORMULA COST PER TON 65.36 FORMULA COST PER TON 67.47
[image:22.612.60.569.48.723.2] [image:22.612.74.569.73.233.2] [image:22.612.313.575.83.229.2] [image:22.612.327.569.312.460.2]MULTIFORMULA MODEL
Whenever limitations arise in ingredient supplies, in plant production capacity, or in any other common component of the manufacturing operation, the use of a multiformula model becomes a necessity. In such situations it is necessary to allocate the limited resources among alternative products. Many of the important allocation and related operating problems facing management are left unanswered by the use of a single formula model. Arbitrary allocation of limited inputs inevitably leads to suboptimization with its attendant higher cost. Clearly, a need exists for the simultaneous analysis of allocation alternatives as provided by the multiformula model.
MATRIX SIZE CONSIDERATIONS
Excessive matrix size constitutes a potential prob-lem in the use of the multiformula model. It is all too easy to develop a model for which computational costs become prohibitive. Fortunately, matrix reduction can usually be accomplished without appreciable loss of accuracy. Among the obvious areas of reduction are the following: trivial restric-tions, arbitrary restricrestric-tions, and the inclusion of fixed-level ingredients. Reduction in other areas inevitably becomes possible as the analyst becomes better acquainted with the operations represented by the model. Moreover, the use of high speed com-puters and advanced LP programs enables the analyst to solve problems containing over :}.OO equa-tions in less than two minutes. Current industry use indicates that with respect to computational cost per formula, multiformula models can be competi-tive with single or compOSite formula models. In light of the additional management guides they pro-vide, multiformula models are unquestionably superior where ingredient or production limitations exist.
For purposes of initial discussion, assume that a multiformula model is built for a firm that uses six ingredients to produce three feeds (Figure 23). The ingredients are available in given quantities from two sources, namely: (1) regular order rail delivery, or (2) special order truck delivery. Of the three feeds manufactured, cattle supplement and hog grower ration have formulation specifica-tions similar to those discussed previously. The third feed, goat ration, must use one of two stand-ard formulas. Production requirements for all feeds also are specified.
Ingredients Available
Regular Delivery
Item Price Quantit~
(dollars/ton) (tons) Alfalfa Meal 59.00 300
Corn Meal 54.00 500
Cottonseed Mea I 66.00 425 Soybean Meal 79.00 500
Meatscraps 86.00 375
Middlings 35.00 175
Special Delivery
Alfalfa Meal 61.00 150 Soybean Mea I 82.00 200
Meatscraps 89.00 125
Formulation Specifications Cattle Supplement
1. Ingredients used: alfalfa meal, cottonseed meal, soybean meal, middlings
2. Minimum protein of 20% of supplement 3. Maximum fiber of 10% of supplement
Hog Grower Ration
1. Ingredients used: alfalfa meal, corn meal, cottonseed meal, soybean meal, meatscraps
2. Minimum protein of 17% of ration 3. Maximum fiber of 9% of ration
Goat Ration
Formula One: corn meal, 65%; cottonseed meal, 10%; soybean meal, 25%
Formula Two: corn meal, 50%; cottonseed meal, 15%; soybean meal 35%
Cattle Supplement Hog Grower Ration Goat Ration
Production Requirements
800 tons 950 tons 75 tons
[image:23.612.299.527.107.301.2]MODEL FORMULATION
The multiformula model developed for this simplified problem is given in Figure 24. Its major components are summarized in the following submatrices:
ingredient supply, ingredient use, formulation con-trol, and production requirements control.
Ingredient Supply
The ingredient supply submatrix has as activities or columns all ingredients that are available to the firm. This includes six regular purchase, rail-delivered ingredients and three special purchase, truck-delivered ingredients. Constraints on the permissible level of purchase are placed on each ingredient to reflect the amounts available to the firm.
ALFML CORN COTTN Xl Z~ OZ ;:::~ vw ~"" 0 -O~ ",,0 "-~ X2 X3
Cost Control
Alfalfa RP Supply Corn RP Supply Cottonseed RP Supply Soybean RP Supply Meatscraps RP Supply Middlings RP Supply Alfalfa SP Supply Soybean SP Supply Meatscraps SP Supply Alfalfa Transfer Corn Transfer Cottonseed Transfer Soybean Transfer Meatscraps Transfer Middlings Transfer Weight, Cattle Supply Protein, Cattle Supply Fiber, Cattle Supply Weight, Hog Grow Protein, Hog Grow Fiber, Hog Grow Cattle Supply Production Hog Grow Production Goat Ration Production
~ ..E :E 4: XI 59. I. I. SOYML X4
"-"" c:
0
v X2 X3
54. 66.
I. I.
I. 1.
MEAT MIDDS RlIS :S 300 :S 500 ::: 425
::: 500
X5 ::: 375
X6 ::: 175 (2-1)
"-
"-O<! "- Vl
"- a O<!
"-a
O<!
.~ e; Vl
c:
~ c:
g
0 ..E g
'" "U 15
..c 1i :E ..c
>. "U >.
'"
.5l ::: :E 4: .5l ::: X4 X5 X6 X7 X8 X9
79. 86. 35.