O R I G I N A L R E S E A R C H
Fasting Serum Levels of Potassium and Sodium in
Relation to Long-Term Risk of Cancer in Healthy Men
This article was published in the following Dove Press journal: Clinical Epidemiology
Ragnhild S Falk 1 Trond Heir2,3
Trude E Robsahm 4 Steinar Tretli 4 Leiv Sandvik1 Jan E Erikssen2 Jan E Paulsen 5
1Oslo Centre for Biostatistics and
Epidemiology, Oslo University Hospital,
Oslo, Norway;2Oslo Ischemia study,
Oslo University Hospital, Oslo, Norway;
3Institute of Clinical Medicine, Faculty of
Medicine, University of Oslo, Oslo,
Norway;4Department of Research,
Cancer Registry of Norway, Oslo,
Norway;5Department of Food Safety and
Infection Biology, Norwegian University of Life Sciences, Oslo, Norway
Purpose:To examine whether serum levels of potassium and sodium were associated with long-term cancer risk in initially healthy men.
Patients and Methods:A cohort of 1994 initially healthy men with no use of medication, aged 40–59 years, was followed for cancer during 40 years of follow-up. Associations between fasting electrolyte levels and cancer risk were assessed with incidence rates and Cox proportional hazards models.
Results: Potassium, but not sodium, was linearly associated with cancer risk. This association remained significant after adjustment of several potential confounding factors, and also after excluding the first 10 years of follow-up. The age-adjusted risk of all-site cancer increased with 16% for each SD increase in potassium level. Men with hyperka-lemia showed an incidence rate that was 40% higher than for men with normal potassium levels.
Conclusion: Fasting serum potassium level in healthy men was positively associated with long-term cancer risk. Potassium or potassium ion channels may have a role in cell proliferation or differentiation. These findings might imply future cancer strategies for targeting individuals with high serum potassium levels.
Keywords:cancer incidence, cell proliferation, electrolyte levels, epidemiology, prospective cohort study
Introduction
Electrolyte levels of potassium and sodium have been a topic of interest in the aetiology of cancer for many years. In the 1980s, several observations aroused suspicion of cancer being associated with dietary or body content of potassium and sodium.1,2More recently, the nature and function of specific ion channels have been suggested to be involved in tumor development and progression.3–8
Moreover, elevated levels of potassium and lowered levels of sodium have been found in patients with various types of cancer,3,9–11 probably due to oxidative damage12 or cancer cell lysis.13,14 Thus, extracellular electrolyte concentration may be linked to the diagnosis of cancer, either because the electrolyte composition may facilitate cancer development or result from an ongoing undetected cancer disease. However, the associations between potassium or sodium and development of cancer have not been studied in healthy individuals.
In the current study, we aimed to prospectively examine relationships between fasting serum levels of sodium and potassium in initially healthy middle-aged and the incidence of cancer during 40 years of follow-up.
Correspondence: Ragnhild S Falk Oslo Centre for Biostatistics and Epidemiology, Oslo University Hospital, Pb 4950 Nydalen, Oslo 0424, Norway Tel +47 23 06 60 13
Email rs@ous-hf.no
Clinical Epidemiology
Dove
press
open access to scientific and medical research
Open Access Full Text Article
Clinical Epidemiology downloaded from https://www.dovepress.com/ by 118.70.13.36 on 24-Aug-2020
Materials and Methods
Data Sources
The Oslo Ischemia Study is a comprehensive health survey that was established in 1972 aimed to examine risk factors for coronary heart disease and other cardiovascular dis-eases in a healthy male population. A total of 2341 male employees infive companies in Oslo, Norway, aged 40–59
years, were invited to participate in the period
August 1972–March 1975. Inclusion of the study required the absence of any disorders and no use of medication last 14 days. Among those invited, 2014 (86%) agreed to participate and completed the study protocol. At inclusion, all participants underwent a comprehensive review of medical history, clinical and physical examinations (including measurements of body height and weight), a panel of blood tests, and a maximal exercise tolerance bicycle test. In addition, information on lifestyle variables (eg, smoking habits) was collected with a questionnaire. Detailed selection and implementation procedures have previously been reported.15–17
The outcome of the study was the incidence of all-site cancer- and site-specific cancers. Information on cancer and vital status were obtained by linking the cohort data to the Cancer Registry of Norway using the 11-digit per-sonal identification number assigned all Norwegian citi-zens after 1960. The Cancer Registry has registered data on all cancer diagnosed since 1953. Mandatory reporting on all malignancies from several independent sources ensures data completeness and high data quality, whereof the proportion of morphologically verified cases was 94%.18 The cancer data obtained comprised information on cancer site based on the 7th (in the former period; 1970–1992) and 10th (in the latter period; 1993-present) edition of the World Health Organization’s International Classification of Diseases and date of diagnosis.
At inclusion, all participants provided informed consent according to the Declaration of Helsinki. In the 1990s, after increased awareness of privacy, the Data Protection Authority retrospectively reviewed the inclusion process for the Oslo Ischemia Study and judged participation to be in accordance with provisions on written informed consent. The study has further been approved by the Regional Committees for Medical and Health Research Ethics, Norway.
Variables
Blood samples for determination of sodium and potas-sium were performed after at least 12 h fasting and 8
h abstaining from smoking. Repeated analysis of the blood samples showed high accuracy.15 The electrolytes were considered both as continuous and as categorical variables. The continuous relationship was given per 1 standard deviation (SD) increase. Potassium level below the normal range was categorized as hypokalemia (≤3.5 mmol/L), and as hyperkalemia if above (>5.0 mmol/L).19 Sodium levels were categorized as hyponatremia if <136
mmol/L20 and as hypernatremia if >145 mmol/L.21
Normal levels were divided into three equally spaced categories both for potassium (3.6–4.0, 4.1–4.5, and 4.6–5.0 mmol/L) and sodium (136–138, 139–142, and 143–145 mmol/L). The ratio of sodium to potassium was calculated as a measure of the electrical potential of the cell.
Body mass index was calculated based on the indivi-dual’s measured body height and weight at baseline (kg/ m2). Physical fitness was measured as the total work (ie, sum of the work performed in a bicycle test) divided by body weight (kJ/kg). Information on smoking habits was collected by questionnaire, and individuals were categor-ized as “never”, “former”, or “present” smokers. The erythrocyte sedimentation rate was determined by the Westergren method (mm/hour). In addition, serum creati-nine (mg/dL), triglyceride (mmol/L), and total cholesterol (mmol/L) were measured in all subjects.
The cohort of men was followed for cancer throughout 2012. Of the 2014 men included, we excluded two men with
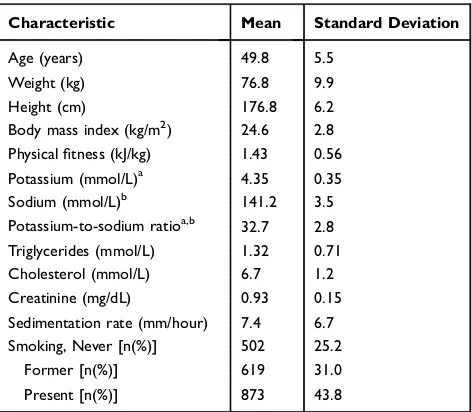
Table 1Baseline Characteristics of the Study Cohort, N=1994 Initially Healthy Men
Characteristic Mean Standard Deviation
Age (years) 49.8 5.5
Weight (kg) 76.8 9.9
Height (cm) 176.8 6.2
Body mass index (kg/m2) 24.6 2.8
Physicalfitness (kJ/kg) 1.43 0.56
Potassium (mmol/L)a 4.35 0.35
Sodium (mmol/L)b 141.2 3.5
Potassium-to-sodium ratioa,b 32.7 2.8
Triglycerides (mmol/L) 1.32 0.71
Cholesterol (mmol/L) 6.7 1.2
Creatinine (mg/dL) 0.93 0.15
Sedimentation rate (mm/hour) 7.4 6.7
Smoking, Never [n(%)] 502 25.2
Former [n(%)] 619 31.0
Present [n(%)] 873 43.8
Notes: Data are mean (standard deviation) unless otherwise stated. a Missing information for potassium in 5 men.bMissing information for sodium in 88 men.
Clinical Epidemiology downloaded from https://www.dovepress.com/ by 118.70.13.36 on 24-Aug-2020
missing vital status data and 15 men due to cancer diagnosis prior to the date of the examination. Further, three men did not obtain values for neither potassium nor sodium. Thus, 1994 men remained in the cohort for statistical analyses.
Statistical Analyses
Descriptive analyses were conducted for baseline char-acteristics and presented as frequencies, proportions, mean, SD, and range. Test for trend across ordered categories of potassium and sodium was performed by a Wilcoxon test.
The men were followed longitudinally from the date of examination (baseline) to the date of cancer diagnosis,
death, emigration, age of 85 years, or the end of follow-up, whichever occurredfirst.
The absolute risk of all-site cancer by levels of elec-trolyte concentration was presented as age-adjusted inci-dence rates per 1000 person-years. Graphically, the cumulative incidence of all-site cancer in the presence of competing risk was obtained through the Aalen-Johansen estimator.
The relative risk of all-site cancer was explored through a set of Cox-regression models. To explore the potential bias caused by death as a competing event, a similar set of regres-sion model was performed with death without previous cancer as the event of interest.
Table 2Baseline Characteristics of the Study Cohort Stratified by Fasting Level of (A) Potassium and (B) Sodium (mmol/L) in Five Groups
A
Characteristic
Hypokalemia ≤3.5
n=19
Normal-Low 3.6–4.0 n=330
Normal-Intermediate 4.1–4.5
n=1155
Normal-High 4.6–5.0 n= 435
Hyperkalemia >5.0
n=50
Age (years) 48.8 (5.1) 48.6 (5.6) 49.8 (5.5) 50.6 (5.3) 51.6 (4.5)
Weight (kg) 75.9 (7.9) 77.1 (10.1) 77.3 (9.7) 75.6 (10.3) 74.4 (9.8)
Height (cm) 174.6 (5.7) 177.0 (6.4) 176.8 (6.2) 176.5 (6.1) 177.3 (5.8)
Body mass index (kg/m2) 24.9 (2.2) 24.6 (2.9) 24.7 (2.7) 24.2 (2.7) 23.6 (2.7)
Physicalfitness (kJ/kg) 1.52 (0.64) 1.53 (0.63) 1.43 (0.56) 1.38 (0.52) 1.32 (0.44)
Triglycerides (mmol/L) 1.39 (0.67) 1.27 (0.66) 1.37 (0.76) 1.25 (0.64) 1.27 (0.48)
Cholesterol (mmol/L) 7.1 (1.4) 6.5 (1.2) 6.7 (1.2) 6.6 (1.3) 6.7 (1.1)
Creatinine (mg/dL) 0.98 (0.13) 0.92 (0.16) 0.93 (0.15) 0.93 (0.16) 0.97 (0.16)
Sedimentation rate (mm/hour) 7.3 (7.2) 6.2 (5.1) 7.3 (6.6) 8.2 (7.2) 8.7 (8.5)
Sodium (mmol/L) 139.6 (2.6) 140.8 (3.5) 141.2 (4.5) 141.6 (3.5) 143.0 (4.5)
Smoking, Never [n(%)] 11 (57.9) 105 (31.8) 278 (24.1) 98 (22.5) 8 (16.0)
Former [n(%)] 2 (10.5) 123 (37.3) 374 (32.4) 107 (24.6) 13 (26.0)
Present [n(%)] 6 (31.6) 102 (30.9) 503 (43.6) 230 (52.9) 29 (58.0)
B Hyponatremia
<136 n=55
Normal-low 136–138 n=331
Normal-intermediate 139–142
n=927
Normal-high 143–145 n=411
Hypernatremia >145
n=182
Age (years) 50.0 (5.2) 50.1 (5.3) 49.6 (5.6) 49.6 (5.4) 49.9 (5.4)
Weight (kg) 78.1 (10.4) 76.8 (10.3) 76.9 (9.5) 77.0 (10.5) 76.0 (9.9)
Height (cm) 176.0 (6.5) 176.7 (6.4) 176.9 (6.2) 177.2 (6.2) 175.8 (5.8)
Body mass index (kg/m2) 25.1 (2.5) 24.6 (2.8) 24.6 (2.8) 24.5 (2.8) 24.6 (2.7)
Physicalfitness (kJ/kg) 1.33 (0.55) 1.44 (0.60) 1.46 (0.56) 1.45 (0.56) 1.39 (0.53)
Triglycerides (mmol/L) 1.44 (0.89) 1.43 (0.94) 1.29 (0.64) 1.32 (0.67) 1.31 (0.57)
Cholesterol (mmol/L) 6.8 (1.3) 6.8 (1.2) 6.6 (1.2) 6.6 (1.2) 6.5 (1.1)
Creatinine (mg/dL) 0.90 (0.15) 0.91 (0.15) 0.92 (0.15) 0.94 (0.16) 0.97 (0.16)
Sedimentation rate (mm/hour) 9.5 (9.2) 7.9 (8.7) 7.3 (6.0) 7.1 (6.0) 6.5 (5.9)
Potassium (mmol/L) 4.2 (0.30) 4.3 (0.34) 4.3 (0.35) 4.4 (0.33) 4.5 (0.39)
Smoking, Never [n(%)] 15 (27.3) 79 (23.9) 251 (27.1) 88 (21.4) 48 (26.4)
Former [n(%)] 13 (23.6) 96 (29.0) 300 (32.4) 129 (31.4) 53 (29.1)
Present [n(%)] 27 (49.1) 156 (47.1) 376 (40.6) 194 (47.2) 81 (44.5)
Notes:Data are mean (standard deviation) unless otherwise stated. Missing information for potassium in 5 men and for sodium in 88 men.
Clinical Epidemiology downloaded from https://www.dovepress.com/ by 118.70.13.36 on 24-Aug-2020
For each of the regression models, hazard ratios (HR) with 95% confidence intervals (CI) were calculated. Crude models and age-adjusted models were performed, in addition to models were the following potential con-founding covariates were included: body mass index, smoking, physicalfitness, triglycerides, cholesterol, crea-tinine, and sedimentation rate, all measured at baseline. Additionally, the level of sodium or potassium was included in the model to investigate the independent effects of the electrolytes. The proportionality of hazards assumption was met for all covariates, except smoking. Thus, we performed a stratified Cox model on smoking, where the baseline hazards were allowed to differ between never, former and present smokers. No interac-tions between the exposure of interest (potassium and sodium) and the adjusting covariates were observed.
To explore the continuous relationship between the electrolytes and all-site cancer risk we presented graphi-cally the smoothed age-adjusted risk estimate from Cox-regression analysis. Restricted cubic spline function with four knots chosen according to Harrell’s recommended percentiles was used for this purpose.
When studying potassium, two secondary analyses were performed. First, to explore the possibility of reverse causality (ie, where high levels of potassium result from an ongoing cancer disease) we performed an analysis restricted to men that remained alive and cancer-free 10 years after baseline, ie, thefirst 10 years of observation were excluded and the new time zero was set 10 years after the initial baseline. Secondly, we calculated the risk for the most prevalent cancer sites in the study cohort by levels of potassium. The Cox model adjusted for age was used for this purpose due to the small number of events in several of the cancer sites.
Finally, the association between sodium-to-potassium ratio and cancer risk was explored in a similar manner to explore the electrical potential of the cell.
An association was considered statistically significant when p <0.05. All statistical analyses were performed using Stata.22
Results
Mean age at inclusion into the study was 49.8 years (SD 5.5 years). The mean levels of potassium and sodium were 4.3 mmol/L (SD 0.35, range 1.9–7.0) and 141 mmol/L (SD 3.5, range 107–161), respectively (Table 1). During fol-low-up (median 26.4 years, range 0.1–40.3 years), 710 men were diagnosed with cancer, and 1248 deaths occurred (739 without previous cancer).
The level of potassium was positively associated with age, sedimentation rate, sodium and presence of smoking, and negatively associated with body mass index and fi t-ness while the level of sodium was positively associated with creatinine and potassium and negatively associated with sedimentation rate (Table 2).
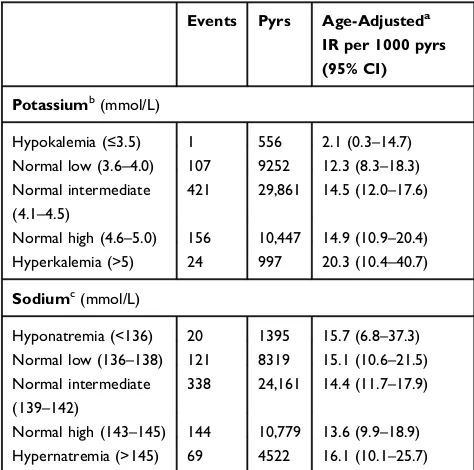
An increase in level of potassium increased the abso-lute risk of all-site cancer; the age-adjusted incidence rate was 2.1, 12.3, 14.5, 14.9, and 20.3 per 1000 person-years for potassium levels ≤3.5, 3.6–4.0, 4.1–4.5, 4.6–5.0, and >5.0 mmol/L, respectively (Table 3). Men with hyperka-lemia showed an incidence rate that was 40% higher than for men with normal potassium levels. The cumulative incidence of all-site cancer increased continuously during the study period (Figure 1). In particular, among men with hyperkalemia, the cumulative incidence of all-site cancer started to deviate from lower levels of potassium at 5 years. For sodium, no differences in absolute risk were observed (Table 3,Figure 1).
The age-adjusted HR of all-site cancer showed a linear relationship with the increasing level of potassium (Figure 2). For each increase of 1 SD (0.35 mmol/L), a 16% increase in all-site cancer risk was observed (HR 1.16, 95% CI
Table 3Number of All-Site Cancer Cases (Events), Person-Years (Pyrs) and Age-Adjusted Incidence Rates (IR) with 95% Confidence Intervals (CI) Among Initially Healthy Men During 40 years of Follow-Up by Fasting Level of Potassium and Sodium at Baseline
Events Pyrs Age-Adjusteda IR per 1000 pyrs (95% CI)
Potassiumb(mmol/L)
Hypokalemia (≤3.5) 1 556 2.1 (0.3–14.7)
Normal low (3.6–4.0) 107 9252 12.3 (8.3–18.3)
Normal intermediate (4.1–4.5)
421 29,861 14.5 (12.0–17.6)
Normal high (4.6–5.0) 156 10,447 14.9 (10.9–20.4)
Hyperkalemia (>5) 24 997 20.3 (10.4–40.7)
Sodiumc(mmol/L)
Hyponatremia (<136) 20 1395 15.7 (6.8–37.3)
Normal low (136–138) 121 8319 15.1 (10.6–21.5)
Normal intermediate
(139–142)
338 24,161 14.4 (11.7–17.9)
Normal high (143–145) 144 10,779 13.6 (9.9–18.9)
Hypernatremia (>145) 69 4522 16.1 (10.1–25.7)
Notes:a
Age-adjusted according to the age-distribution (5-year groups) in the total cohort at baseline.bMissing information for potassium in 5 men, of which one with cancer.c
Missing information for sodium in 88 men, of which 18 with cancer.
Clinical Epidemiology downloaded from https://www.dovepress.com/ by 118.70.13.36 on 24-Aug-2020
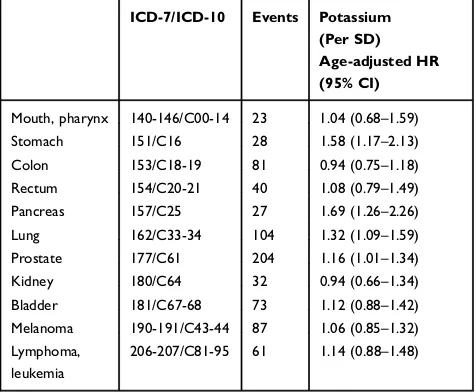
1.08–1.25) (Table 4). The HR remained significant after additional adjustment of several potential confounding fac-tors (see methods). Further, the association was independent of level of sodium, as shown in the last regression model, where the risk increased 15% per SD (HR 1.15, 95% CI 1.06–1.24). Excluding thefirst 10 years of the study period did not affect the findings in the regression analyses. Moreover, the site-specific analyses showed positive associa-tions for cancer in the stomach (HR 1.58, 95% CI 1.17–2.13), pancreas (1.69, 1.26–2.26), lung (1.32, 1.09–1.59), and pros-tate (1.16, 1.01–1.34) (Table 5). Studying competing death as the outcome, the HR also increased by increasing the level of potassium (Table S1).
For sodium, no association with cancer risk was observed (Figure 2, Table 4). Sodium-to-potassium ratio was negatively associated with the risk of all-site cancer (Table S2). However, after adjustment for baseline level of potassium (the last regression model), no independent effect of the ratio was observed.
Discussion
In this prospective study, we investigated whether fasting serum levels of potassium and sodium in initially healthy middle-aged men was related to cancer risk during 40 years of follow-up. A continuous linear relationship was observed between serum potassium and cancer risk. For each increase in potassium level by 1 SD, the age-adjusted risk of all-site cancer increased with 16%; the incidence increase was seen for cancers of pancreas (69%), stomach (58%), lung (32%), and prostate (16%). Individuals with hyperkalemia showed the highest cancer risk, which was found already after 5 years of follow-up. The association was evident after adjusting for a series of baseline characteristics (body mass index,fitness, smoking, triglycerides, cholesterol, creatinine, and sedimen-tation rate) and also after excluding the first 10 years of follow-up. Serum levels of sodium were not associated with cancer risk.
To our knowledge, the present study is thefirst to report that higher levels of serum potassium in healthy individuals
0
.1
.2
.3
.4
.5
0 10 20 30 40
Time since examination (years)
K 3.6−4.0 K 4.1−4.5
K 4.6−5.0 K >5.0
Potassium
0
.1
.2
.3
.4
.5
0 10 20 30 40
Time since examination (years)
Na <136 Na 136−138
Na 139−142 Na 143−145
Na >145
Sodium
Figure 1Cumulative incidence of all-site cancer by levels of potassium and sodium. K≤3.5 is not present due to only one cancer event.
Clinical Epidemiology downloaded from https://www.dovepress.com/ by 118.70.13.36 on 24-Aug-2020
are associated with subsequent cancer incidence. However, this study cannot reveal whether the relationship between individual serum level of potassium and cancer risk is causal, and several hypotheses can be suggested for future research. Firstly, higher level of serum potassium by itself may pro-mote cancer development and growth through immune mechanisms. For example, it has been shown that potassium suppresses the activity of T cells, leading to a reduced ability to prevent cancer development.23
Secondly, individuals with elevated serum potassium may have an undiscovered cancer diagnosis at baseline resulting in potassium release from necrotic cancer cells (reverse causation).13 Our finding of a persistent increase in cancer risk after excluding thefirst 10-years of observa-tion does not support this hypothesis. However, as it may
take several years to develop a cancer disease,24we cannot rule out the possibility of reverse causation.25
Thirdly, there may be some inherent individual factors that contribute to the regulation of serum potassium that also facilitate cancer processes. For example, genetic variation in ion channels and pumps that are involved in potassium home-ostasis may also be associated with genes that have a role in cell proliferations and differentiation. The SCNN1B gene is associated with serum potassium26as well as gastric cancer9 and the KCNQ1 gene, which provides information for potas-sium channels,27is also associated with the risk of colon,28 colorectal,29and pancreatic cancer.30Also, a polymorphism in the KCNJ4 gene, which encodes another potassium channel, is associated with prostate cancer.4The research on membrane channels and transporters in cancer is still in the initial phase and canfill more gaps in the years to come.
The study has several strengths. First, the men were apparently healthy at inclusion that was confirmed by physi-cal examination and review of mediphysi-cal records, and the men did not use any medication last 14 days. The examinations took place in the morning hours and the level of the 0.0
0.2 0.4 0.6 0.8 1.0 1.2 1.4 1.6 1.8 2.0 2.2 2.4
Age−adjusted HR of all−site cancer
3.3 3.5 3.7 3.9 4.1 4.3 4.5 4.7 4.9 5.1 5.3 Level of potassium at baseline (mmol/L)
0.0 0.2 0.4 0.6 0.8 1.0 1.2 1.4 1.6 1.8 2.0 2.2 2.4
Age−adjusted HR of all−site cancer
132 134 136 138 140 142 144 146 148 150 152 154 Level of sodium at baseline (mmol/L)
Figure 2Hazard ratio for all-site cancer by levels of potassium and sodium. Bars indicate 95% confidence intervals. Restricted cubic spline function of potassium and sodium with four knots chosen according to Harrell’s recommended percentiles. For potassium, the reference group was set to K=4.3 mmol/L. Estimates for values ≤3.2 and≥5.4 were not presented due to low numbers. Dashed lines indicate the cut-off values for hypokalemia (≤3.5) and hyperkalemia (>5.0). For sodium, refer-ence group was set to Na=140 mmol/L. Estimates for values≤131 and≥155 were not presented due to low numbers. Dashed lines indicate the cut-off values for hyponatremia (<136) and hypernatremia (>145).
Table 4 Hazard Rate (HR) of All-Site Cancer Among Initially Healthy Men During 40 years of Follow-Up by Fasting Level of Potassium and Sodium at Baseline. The Standard Deviations (SD) for the Electrolytes Were 0.35 Mmol/L for Potassium and 3.5 mmol/L for Sodium
HR (95% CI)
Potassium(n=1989)
Crude potassium (per SD) 1.21 (1.12–1.30)
Age-adjustedapotassium (per SD) 1.16 (1.08–1.25)
Adjustedbpotassium (per SD) 1.15 (1.07–1.25)
Adjustedcpotassium (per SD) 1.15 (1.06–1.24)
Potassium
Excludingfirst 10 years of follow-up (n=1823)
Crude potassium (per SD) 1.21 (1.11–1.31)
Age-adjustedapotassium (per SD) 1.16 (1.07–1.26)
Adjustedbpotassium (per SD) 1.16 (1.07–1.26)
Adjustedcpotassium (per SD) 1.16 (1.07–1.26)
Sodium(n=1906)
Crude sodium (per SD) 1.00 (0.93–1.08)
Age-adjustedasodium (per SD) 1.02 (0.95–1.10)
Adjustedbsodium (per SD) 1.03 (0.95–1.11)
Adjusteddsodium (per SD) 1.01 (0.93–1.09)
Notes:a
Adjusted for age at baseline.b
Additionally adjusted for body mass index, fitness, smoking, triglycerides, cholesterol, creatinine and sedimentation rate, all measured at baseline. c
Additionally adjusted for fasting sodium at baseline; d
Additionally adjusted for fasting potassium at baseline.
Clinical Epidemiology downloaded from https://www.dovepress.com/ by 118.70.13.36 on 24-Aug-2020
electrolytes was measured fasting. Several potential con-founding factors were adjusted for in the analysis (eg,
phy-sical fitness, smoking, and diet (approximated by
triglycerides, cholesterol, and body mass index)), and the individuals were followed for cancer for until 40 years. The cohort was representative of the age-group of men within the given time-period, with regard to cancer incidence in their counties of residence.31Thus, the results are considered to be generalizable to healthy men in northern Europe.
Some limitations should be noted. The study protocol included men only and was originally not designed for inves-tigating the aim of the present study. The study sample was relatively small and no information on social status, alcohol intake, diet and genetic variations was available. Lack of repeated measures may cause bias due to change in potentially confounding exposures (e.g. physicalfitness and use of med-ication) during follow-up. Due to the small number of events of site-specific cancers, these results should be interpreted with caution. Moreover, due to the long follow-up time, the risk of competing death could potentially preclude the interpretation of the results from Cox-regression analysis for all-site cancer. However, since the risk of competing death also increases by the level of potassium this bias is expected to be minor.
Conclusion
Thefinding that fasting serum potassium was strongly asso-ciated with long-term cancer risk in healthy individuals points
to further research in several directions, eg, the influence of potassium in cancer-fighting immune mechanisms or the role of potassium or potassium ion channels in cell proliferation and differentiation. The strength of the association suggests possible clinical implications, eg, medical surveillance strate-gies of individuals with high levels of potassium.
Availability of Data and Material
Data are from the Oslo Ischemia Study. Public availability would compromise the privacy of the respondents. According to the approval from the Norwegian Regional committees for medical and health research ethics, the data is to be stored properly and in line with the Norwegian Law of privacy protection. Aggregated data are available on request.
Author Contributions
All authors contributed toward data analysis, drafting and critically revising the paper, gave final approval of the version to be published, and agree to be accountable for all aspects of the work.
Disclosure
The authors report no conflicts of interest in this work.
References
1. Jansson B. Dietary, total body, and intracellular potassium-to-sodium ratios and their influence on cancer. Cancer Detect Prev.
1990;14:563–565.
2. Jansson B. Potassium, sodium, and cancer: a review. J Environ Pathol Toxicol Oncol.1996;15:65–73.
3. Jiang S, Zhu L, Yang J, et al. Integrated expression profiling of potassium channels identifys KCNN4 as a prognostic biomarker of pancreatic cancer. Biochem Biophys Res Commun.
2017;494:113–119. doi:10.1016/j.bbrc.2017.10.072
4. Kim YS, Kim Y, Choi JW, Oh HE, Lee JH. Genetic variants and risk of prostate cancer using pathway analysis of a genome-wide associa-tion study.Neoplasma.2016;63:629–634. doi:10.4149/neo_2016_418 5. Huang X, Jan LY. Targeting potassium channels in cancer. J Cell
Biol.2014;206:151–162. doi:10.1083/jcb.201404136
6. Litan A, Langhans SA. Cancer as a channelopathy: ion channels and pumps in tumor development and progression.Front Cell Neurosci.
2015;9:86. doi:10.3389/fncel.2015.00086
7. Peruzzo R, Biasutto L, Szabò I, Leanza L. Impact of intracellular ion channels on cancer development and progression. Eur Biophys J.
2016;45:685–707.
8. Cázares-Ordoñez V, Pardo LA. Kv10.1 potassium channel: from the brain to the tumors. Biochem Cell Biol. 2017;95:531–536. doi:10.1139/bcb-2017-0062
9. Qian Y, Wong CC, Xu J, et al. Sodium channel subunit SCNN1B suppresses gastric cancer growth and metastasis via GRP78 degradation. Cancer Res. 2017;77:1968–1982. doi:10.1158/0008-5472.CAN-16-1595
10. Wang SH, Wang KL, Yang WK, Lee TH, Lo WY, Lee JD. Expression and potential roles of sodium-potassium ATPase and E-cadherin in human gastric adenocarcinoma.PLoS One.2017;12: e0183692. doi:10.1371/journal.pone.0183692
Table 5Hazard Rates (HR) for the Most Frequent Cancer Sites in the Cohort of Initially Healthy Men Followed for 40 Years. The Standard Deviation (SD) for Potassium Was 0.35 mmol/L
ICD-7/ICD-10 Events Potassium (Per SD) Age-adjusted HR (95% CI)
Mouth, pharynx 140-146/C00-14 23 1.04 (0.68–1.59)
Stomach 151/C16 28 1.58 (1.17–2.13)
Colon 153/C18-19 81 0.94 (0.75–1.18)
Rectum 154/C20-21 40 1.08 (0.79–1.49)
Pancreas 157/C25 27 1.69 (1.26–2.26)
Lung 162/C33-34 104 1.32 (1.09–1.59)
Prostate 177/C61 204 1.16 (1.01–1.34)
Kidney 180/C64 32 0.94 (0.66–1.34)
Bladder 181/C67-68 73 1.12 (0.88–1.42)
Melanoma 190-191/C43-44 87 1.06 (0.85–1.32)
Lymphoma, leukemia
206-207/C81-95 61 1.14 (0.88–1.48)
Notes: ICD-7/ICD-10= the 7th and the 10th edition of the World Health Organization’s International Classification of Diseases codes for cancer; Events=number of cancer cases.
Clinical Epidemiology downloaded from https://www.dovepress.com/ by 118.70.13.36 on 24-Aug-2020
11. Ramírez A, Vera E, Gamboa-Domínguez A, Lambert P, Gariglio P, Camacho J. Calcium-activated potassium channels as potential early markers of human cervical cancer.Oncol Lett.2018;15:7249–7254. doi:10.3892/ol.2018.8187
12. Kolanjiappan K, Manoharan S, Kayalvizhi M. Measurement of ery-throcyte lipids, lipid peroxidation, antioxidants and osmotic fragility in cervical cancer patients. Clin Chim Acta. 2002;326:143–149. doi:10.1016/S0009-8981(02)00300-5
13. Wilson FP, Berns JS. Tumor lysis syndrome: new challenges and recent advances. Adv Chronic Kidney Dis. 2014;21:18–26. doi:10.1053/j.ackd.2013.07.001
14. Mirrakhimov AE, Ali AM, Khan M, Barbaryan A. Tumor lysis syndrome in solid tumors: an up to date review of the literature. Rare Tumors.2014;6:5389. doi:10.4081/rt.2014.5389
15. Erikssen J, Skrede S. Serum lipids and latent coronary insufficiency. Scand J Clin Lab Invest. 1977;37:243–250. doi:10.1080/ 00365517709091489
16. Erikssen G, Liestøl K, Bjørnholt J, Thaulow E, Sandvik L, Erikssen J. Changes in physical fitness and changes in mortality. Lancet.1998;352:759–762. doi:10.1016/S0140-6736(98)02268-5 17. Falk RS, Tretli S, Paulsen JE, Sandvik L, Erikssen J, Heir T.
Response to intravenous glucose-tolerance test and risk of cancer: a long-term prospective cohort study. EBio Med. 2017;21: 117–122.
18. Larsen IK, Småstuen M, Johannesen TB, et al. Data quality at the cancer registry of Norway: an overview of comparability, complete-ness, validity and timeliness. Eur J Cancer. 2009;45:1218–1231. doi:10.1016/j.ejca.2008.10.037
19. Gumz ML, Rabinowitz L, Wingo CS. An integrated view of potas-sium homeostasis. N Engl J Med. 2015;373:60–72. doi:10.1056/ NEJMra1313341
20. Adrogué HJ, Madias NE. Hyopnatremia. N Engl J Med.
2000;342:1581–1589. doi:10.1056/NEJM200005253422107
21. Adrogué HJ, Madias NE. Hypernatremia. N Engl J Med.
2000;342:1493–1499. doi:10.1056/NEJM200005183422006 22. StataCorp. Stata Statistical Software: Release 15. College Station,
TX: StataCorp LCC;2017.
23. Eil R, Vodnala SK, Clever D, et al. Ionic immune suppression within the tumour microenvironment limits T cell effector function.Nature.
2016;537:539–543. doi:10.1038/nature19364
24. Mooi WJ, Peeper DS. Oncogene-induced cell senescence–halting on the road to cancer.N Engl J Med.2006;355:1037–1046. doi:10.1056/ NEJMra062285
25. Friberg S, Mattson S. On the growth rates of human malignant tumors: implications for medical decision making. J Surg Oncol.
1997;65:284–297. doi:10.1002/(ISSN)1096-9098
26. Gaukrodger N, Avery PJ, Keavney B. Plasma potassium level is associated with common genetic variation in the beta-subunit of the epithelial sodium channel.Am J Physiol Regul Integr Comp Physiol.
2008;294:R1068–72. doi:10.1152/ajpregu.00732.2007
27. Abbott GW. Biology of the KCNQ1 potassium channel.New J Sci.
2014;2014:1–26. doi:10.1155/2014/237431
28. den Uil SH, Coupé VM, Linnekamp JF, et al. Loss of KCNQ1 expression in stage II and stage III colon cancer is a strong prognostic factor for disease recurrence. Br J Cancer. 2016;115:1565–1574. doi:10.1038/bjc.2016.376
29. Than BL, Goos JA, Sarver AL, et al. The role of KCNQ1 in mouse and human gastrointestinal cancers.Oncogene.2014;33:3861–3868. doi:10.1038/onc.2013.350
30. Kuruma S, Egawa N, Kurata M, et al. Case-control study of diabetes-related genetic variants and pancreatic cancer risk in Japan. World J Gastroenterol.2014;20:17456–17462. doi:10.3748/wjg.v20. i46.17456
31. Heir T, Falk RS, Robsahm TE, Sandvik L, Erikssen J, Tretli S. Cholesterol and prostate cancer risk: a long-term prospective cohort study.BMC Cancer.2016;16:643. doi:10.1186/s12885-016-2691-5
Clinical Epidemiology
Dove
press
Publish your work in this journal
Clinical Epidemiology is an international, peer-reviewed, open access, online journal focusing on disease and drug epidemiology, identifi ca-tion of risk factors and screening procedures to develop optimal pre-ventative initiatives and programs. Specific topics include: diagnosis, prognosis, treatment, screening, prevention, risk factor modification,
systematic reviews, risk & safety of medical interventions, epidemiol-ogy & biostatistical methods, and evaluation of guidelines, translational medicine, health policies & economic evaluations. The manuscript management system is completely online and includes a very quick and fair peer-review system, which is all easy to use.
Submit your manuscript here:https://www.dovepress.com/clinical-epidemiology-journal
Clinical Epidemiology downloaded from https://www.dovepress.com/ by 118.70.13.36 on 24-Aug-2020