EXPLORING OPTIMAL CEREAL CROP SEQUENCE USING CULTIVATED
LAND UTILIZATION INDEX AND YIELD IN KATIHAR DISTRICT, INDIA: A
SUB DIVISION LEVEL ANALYSIS
Vinay Prasad Mandal a
Raihan Ahmad a
Sufia Rehman a
Md Masroor a,
Haroon Sajjad a
a
Department of Geography, Faculty of Natural Sciences, Jamia Millia
Islamia, New Delhi, India
[email protected](Corresponding author)
ARTICLE HISTORY:
Received: 08-Feb-2019
Accepted: 16-Apr-2019 Online Available: 03-May-2019
Keywords:
Crop sequence,
cultivation land utilization index,
yield, NPK, Katihar
ABSTRACT
The present study attempts to identify the suitable crop sequences in an agriculturally productive district of Bihar, India. Rice-vegetables, maize-rice, maize-maize, maize-jute, rice-pulse-rice, rice-pulse-jute, rice-pulse-potato, and maize-maize-rice were found to be the suitable crop sequences in the area under study. Findings revealed that most of the blocks were found suitable for suggested crop sequences, while only two blocks (namely Balrampur and Barsoi) showed low potential in the rice-maize-rice sequence. Use of farm machinery, application of efficient farm inputs, and irrigation is required to maximize the yield and achieve long-term agricultural sustainability in this district.
Contribution/ Originality
This study intends to identify the suitable cropping sequence for achieving a long-term sustainability in agriculture, in the Katihar district of Bihar, India. This study tried to establish the relationship of yield with cultivated land utilization index (CLUI), soil bulk density, and NPK, for suggesting suitable crop sequence for sustainable agricultural development in the district.
DOI: 10.18488/journal.1005/2019.9.1/1005.1.62.81 ISSN (P): 2304-1455/ISSN (E):2224-4433
How to cite: Vinay Prasad Mandal, Raihan Ahmad, Sufia Rehman, Md Masroor and Haroon Sajjad (2019). Exploring optimal cereal crop sequence using cultivated land utilization index and yield in Katihar district, India: a sub division level analysis. Asian Journal of Agriculture and Rural Development, 9(1), 62-81.
© 2019 Asian Economic and Social Society. All rights reserved.
Asian Journal of Agriculture and Rural Development
Volume 9, Issue 1 (2019): 62-81
1. INTRODUCTION
Agriculture has always been an important source of livelihood to the rural masses in India. Increasing population pressure on resources has been a barrier to achieving agricultural sustainability, especially in rural areas. Identification of suitable crop sequence and efficacious measures to increase agricultural yield, is necessary for sustainable agricultural development. Agriculture has gone through many stages over time. It does not only provide livelihood, but also plays a key role in the manufacturing and industrial sectors (Sajjad et al., 2014). Agriculture has made rapid strides over the years, and many countries like Russia federation, India, China, Brazil and Indonesia, have started participating in international agricultural markets. Export of agricultural commodities in these nations have increased from 9.4% to 20% between 2000 and 2015. A similar pattern was also observed in imports (FAO, 2018). However, at the same time agriculture has also been affected by urbanization, industrialization and climate change. The reducing level of GHGs, has also increased conflict for land and water resources (FAO, 2017). Nearly 33% farms in dry lands have been highly degraded affecting overall livelihood, health of the ecosystem, food security and impoverishment of farming communities, globally (FAO, 2014). Hence, achieving agricultural sustainability with less resource intensification is a great challenge, particularly for developing countries like India. Fulfilling the demand of 10 billion people for fibre, fuel and food by 2050 is a difficult task. For achieving long-term sustainability in agricultural production, it must be grown at an average rate of 1.75% by 2050 (Global Agricultural Productivity Index, 2018). It is also anticipated that food demands would reach 60% by 2050. Therefore, effectual farming practices are essential to make production sustainable (Liebisch et al., 2014).
Characterization of farming system refers to the assessment of nature and traits of farming system, in terms of inputs like irrigation, fertilizers, high yielding variety of seeds, insecticides, pesticides, land use and quality of soils, etc. It is also essential to assess the cropping pattern, crop combination, crop intensity, crop diversification, utilization of cultivated land and yield, when suggesting long term sustainability of agricultural systems. Characterization of a farming system is significant, especially in a diversified farming system. Adoption of new techniques play an important role in achieving such characterization (Timler et al., 2014). Indian agriculture has experienced tremendous changes in the previous century. Increase in food production exceeded the population growth since in the 1960s (Sajjad et al., 2014). Earlier, the emphasis were laid on ensuring self-sufficiency in production, which was somehow achieved. This massive production resulted to various socio-environmental implications, ranging from social lamentation to degrading land and natural resources (Abrol and Sangar, 2006). The size of most of the landholdings in India are small, resulting to meagre income of the farmers. Of the total landholdings, nearly 86% of the farmers belong to the small and marginal farmers’ category (Iqbal, 2018). Characterization of farming system requires assessment of land use/land cover modification. Land cover transformation affects fallow cycles, cropping pattern, crop rotation, etc. The main features of land cover modification are increasing land use production and intensification of land use. This land intensification has direct impact on cropping intensity which simultaneously helps in understanding the relationship between natural resources, people and sustainable land resource management (Zhang and Li, 2016). Agricultural sustainability at farm level can be helpful in creating a holistic perspective of ecological, social and economic development (Sajjad and Nasreen, 2016).
the crop yield and derived benefits (Amejo et al., 2019). Cropping intensity is mainly defined as the ratio of output and input in an agricultural system (Ruiz-Martinez et al., 2015). Assessment of cropping intensity will also help in attaining agricultural productivity, while maintaining the sustainability of the environment (Fan et al., 2014). It is generally believed that agriculture may lead to environmental problems, which is not usually the case. Prudent agricultural activities can significantly provide solutions to various environmental problems, but monitoring has several implications. However, agricultural monitoring is more difficult than other economic sectors (Dumanski and Pieri, 2000). Various scholars have examined agricultural intensity in terms of single components like micronutrients (Kleijn et al., 2008; Overmars et al., 2014) and pesticides (Ruiz-Martinez et al., 2015). Several consensuses among scientific studies were made to characterize the farming system (Hess and Hoskinson, 1996; Van et al., 2010; Alemu, 2016). Bembridge (1987) analysed the various constraints of a farming system namely, unscrupulous inputs, technological barriers and small landholdings. Knowledge of crops with adequate technological support were identified as the two important determinants of a crop farming system.
Remote sensing data is playing an important role in identifying the cropping types, cropping intensity and plant phenology at various scales (Fan et al., 2014). Geospatial techniques have emanated as significant tools to prepare spatial inventory of cropping pattern, land use characteristics, examining the biophysical characters and land resources (Choudhury et al., 2006). Various indices obtained from high resolution satellite data as leaf area index (LAI), leaf water content (LWC), canopy cover (CC), plant chlorophyll content and normalized difference vegetation index (NDVI), etc. can help in identifying inherent cropping characteristics (Liebisch et al., 2014). Chatterjee et al. (2015) characterized the farming system and farm typology, using multivariate statistical, cluster and principal component analyses. They emphasized that identification of farm typology may significantly reduce the problems of farmers and can be indelible to provide better livelihood opportunities. Assessment of soil and land use characteristics are indispensable for increasing the productivity. NDVI and assessment of ground cover derived from satellite data, provides empirical information regarding the land and soil quality (Sheffield and Morse-McNabb, 2015). Land suitability is carried out when assessing the sustainability of agriculture. It is focused on the assessment of the potentiality of land, for specific utilization (Jamil et al., 2018a). Zhang and Li (2016) examined the agrarian land use intensity of varied characteristics using principal component and energy analyses in Beijing, China. Jamil et al. (2018b) examined the cropland suitability through GIS based multi-criteria decision-making, using site-specific parameters in the Bijnor district of Uttar Pradesh, India. Singh et al. (2013) characterized the farming system in southern arid lands of Rajasthan, using field derived samples. They identified that lack of farming techniques and planting methods hindered the farming efficiency. Sajjad et al. (2014) examined the spatial and temporal variability of agricultural sustainability in the Vaishali district, using sustainable livelihood security index (SLSI) at block level. Bio-intensive farming requires appropriate cropping pattern, techniques and agricultural inputs in order to maintain the output sustainability. Sajjad and Prasad (2014) evaluated the crop diversification in the Jalandhar district of Punjab, India using the Gibs and Martin index. They identified that, declining crop diversification may affect farmers’ income, nutrients, natural resources and ground water, etc. Rajbhandari (2011) evaluated the efficiency and relationship among land utilization index (LUI), rotational intensity and yield efficiency for analysing the bio-intensive farming system.
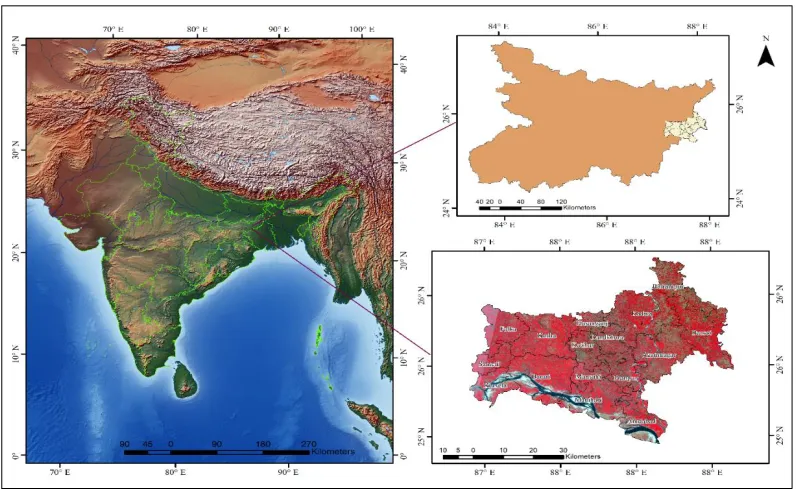
1.1. Study area
Katihar is a district in Bihar, India covers an area of 3057 km2 lies between 25°13' to 25°53' north latitudes and 87°12' to 87°04' east longitudes (Figure 1). The district comprises 16 blocks (administrative division of the district). It relishes a warm temperate climate with three distinct seasons winter, summer and rainy seasons. Average temperature and rainfall of the district is 24 °C and 1281 mm. Monsoon showers take place during June to September which leads to increase in water level up to 50 times higher causing devastating floods. Numerous tributaries of Kosi and
Mahananda Rivers flow across the study area. Major soils in the district are Haplic Fluvisols,
Stagnic Cambisols, Fluvic Cambisols, Haplic Cambisols, Endogleyic Cambisols and Haplic Arenosols (Reza et al., 2017). Nearly 2.41 lakhs people reside in the district. Agricultural population comprises nearly 11279 and marginal workers around 13049 (Census, 2011). Agriculture is the major source of livelihood to the rural masses as this district lies in Mid Gangetic plane region of agro-climate zone. Of the total area of district (291 ha) nearly 146 ha are cultivable and 39 hac are non-agricultural lands while 10 ha came under miscellaneous tree crops and groves, 22 ha under barren and uncultivable and 1.7 ha area came under forest (Agriculture Contingency Plan for District, 2012). Katihar is one of the agriculturally advanced districts of Bihar in India. The farmers grow crop during all the three seasons (Rabi, Kharif and Zaid).
Figure 1: Location map of the study area
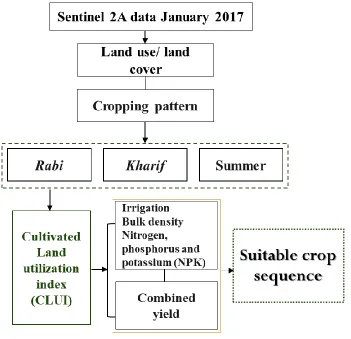
2. METHODOLOGY
For identifying the land use under agriculture, land use/land cover map was prepared from Sentinel 2A data through supervised classification. Cropping pattern was identified using Sentinel 2A data and verified with GPS locations. Maps of cropping pattern in kharif (rainy season crop), rabi
(winter season crop) and Zaid (short season between kharif and rabi seasons) seasons were used to examine the crop sequence in the study area.
relay and intercropping (Rana and Rana, 2011). CLUI assists in identifying the cropping sequence and to increase the land productivity for agriculture (Panigrahy et al., 2005). Block wise CLUI was calculated to identify the land utilization in kharif, rabi and Zaid seasons as:
𝐶𝐿𝑈𝐼 = 𝑎1𝑏2
𝐴 × 365× 100
Where, 𝑎1 refers to area occupied by ith crop, 1,2 is the total number of crops, A is the total cultivated land area available for 365 days.
Relationship of yield with soil bulk density, nitrogen, phosphorus and potassium (NPK) and irrigation was determined to distinguish the suitable cropping sequence in the study area. The detailed methodology is presented in Figure 2.
Figure 2: Methodological framework of the study
3. RESULTS AND DISCUSSION
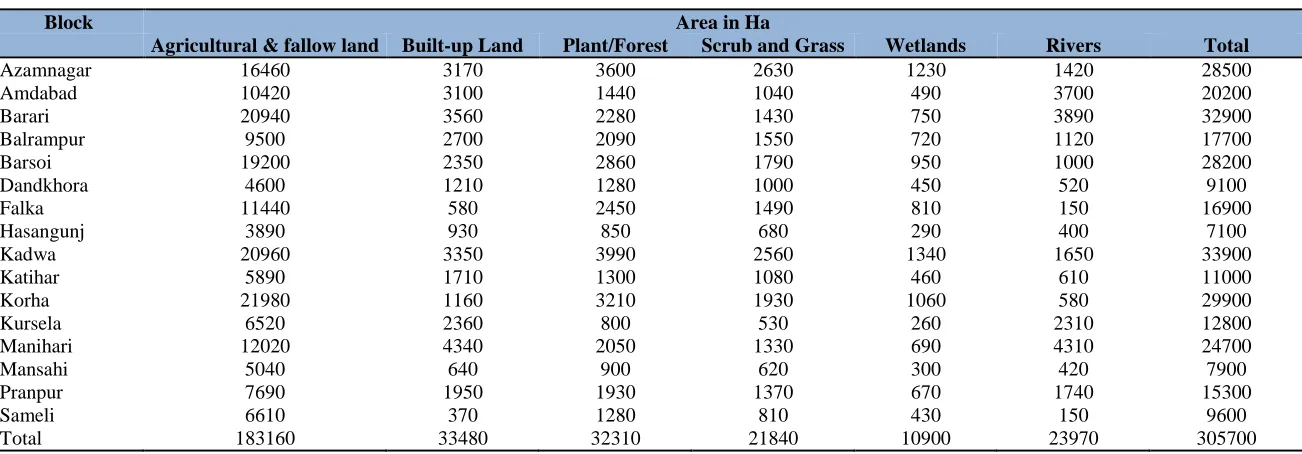
Table 1: Block wise area under various classes of land use/land cover in Katihar district (2017)
Block Area in Ha
Agricultural & fallow land Built-up Land Plant/Forest Scrub and Grass Wetlands Rivers Total
Azamnagar 16460 3170 3600 2630 1230 1420 28500
Amdabad 10420 3100 1440 1040 490 3700 20200
Barari 20940 3560 2280 1430 750 3890 32900
Balrampur 9500 2700 2090 1550 720 1120 17700
Barsoi 19200 2350 2860 1790 950 1000 28200
Dandkhora 4600 1210 1280 1000 450 520 9100
Falka 11440 580 2450 1490 810 150 16900
Hasangunj 3890 930 850 680 290 400 7100
Kadwa 20960 3350 3990 2560 1340 1650 33900
Katihar 5890 1710 1300 1080 460 610 11000
Korha 21980 1160 3210 1930 1060 580 29900
Kursela 6520 2360 800 530 260 2310 12800
Manihari 12020 4340 2050 1330 690 4310 24700
Mansahi 5040 640 900 620 300 420 7900
Pranpur 7690 1950 1930 1370 670 1740 15300
Sameli 6610 370 1280 810 430 150 9600
Total 183160 33480 32310 21840 10900 23970 305700
Figure 3: Land use/land cover of Katihar district (2017)
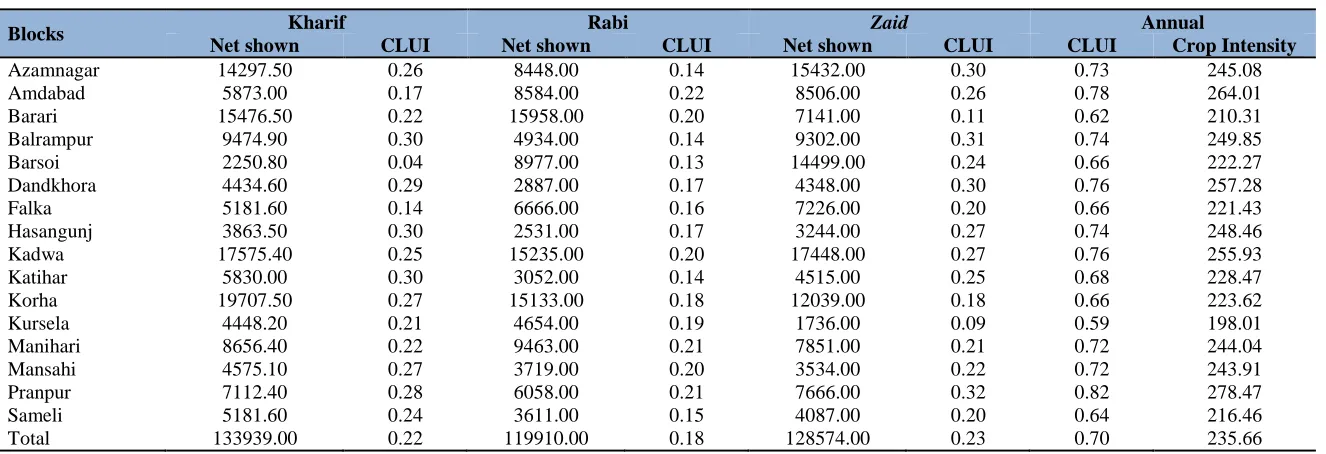
Table 2: Block wise cultivated land utilization index during different seasons in Katihar district
Blocks Kharif Rabi Zaid Annual
Net shown CLUI Net shown CLUI Net shown CLUI CLUI Crop Intensity
Azamnagar 14297.50 0.26 8448.00 0.14 15432.00 0.30 0.73 245.08
Amdabad 5873.00 0.17 8584.00 0.22 8506.00 0.26 0.78 264.01
Barari 15476.50 0.22 15958.00 0.20 7141.00 0.11 0.62 210.31
Balrampur 9474.90 0.30 4934.00 0.14 9302.00 0.31 0.74 249.85
Barsoi 2250.80 0.04 8977.00 0.13 14499.00 0.24 0.66 222.27
Dandkhora 4434.60 0.29 2887.00 0.17 4348.00 0.30 0.76 257.28
Falka 5181.60 0.14 6666.00 0.16 7226.00 0.20 0.66 221.43
Hasangunj 3863.50 0.30 2531.00 0.17 3244.00 0.27 0.74 248.46
Kadwa 17575.40 0.25 15235.00 0.20 17448.00 0.27 0.76 255.93
Katihar 5830.00 0.30 3052.00 0.14 4515.00 0.25 0.68 228.47
Korha 19707.50 0.27 15133.00 0.18 12039.00 0.18 0.66 223.62
Kursela 4448.20 0.21 4654.00 0.19 1736.00 0.09 0.59 198.01
Manihari 8656.40 0.22 9463.00 0.21 7851.00 0.21 0.72 244.04
Mansahi 4575.10 0.27 3719.00 0.20 3534.00 0.22 0.72 243.91
Pranpur 7112.40 0.28 6058.00 0.21 7666.00 0.32 0.82 278.47
Sameli 5181.60 0.24 3611.00 0.15 4087.00 0.20 0.64 216.46
Total 133939.00 0.22 119910.00 0.18 128574.00 0.23 0.70 235.66
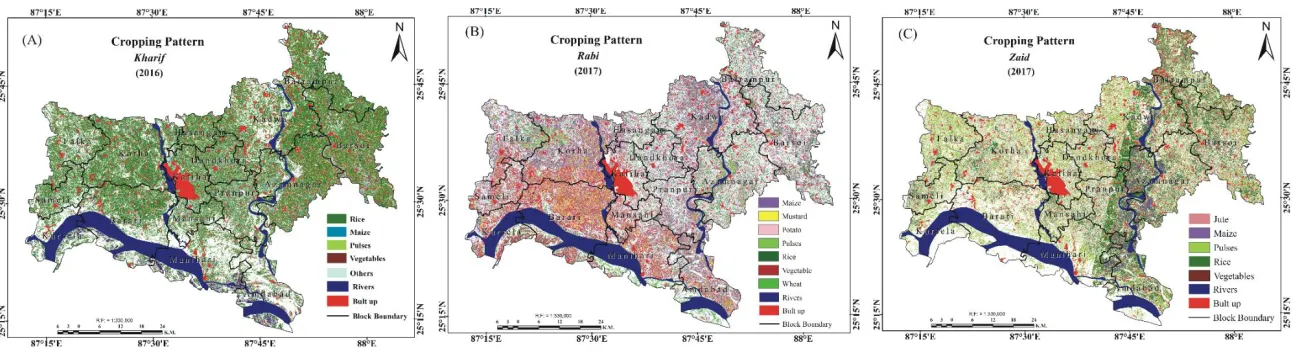
Balrampur and Hasangunj blocks. Moderate annual CLUI was found in Azamnagar, Manihari, Mansahi and Katihar blocks whereas Barsoi, Falka, Korha, Sameli, Barari and Kursela blocks have experienced low annual CLUI. From the above results it is very clear that CLUI in Katihar district is not homogeneous due to rainfall availability and irrigation potential. The farmers are bound to carry out their agricultural practices influenced by rainfall, flood, irrigation potential and land quality. Various crops are grown during kharif season in the district specially rice, maize, pulses and vegetables. Number of crops grown are more during rabi season than kharif due to variation in topography and flood which includes wheat, rice, maize, mustard, pulses and vegetables. Rice, maize, Jute, pulses and vegetables are dominant crops during Zaid season.
Figure 4: Cropping pattern in Katihar district: A) Kharif (during 2016), B) Rabi (during 2017) and C) Zaid (during 2017)
Table 3: Yield of crops during Rabi, Kharif and Zaid seasons in the study area
Blocks Kharif Yields (Q/ha) Rabi crop Yields (Q/ha) Zaid Crop Yields (Q/ha)
Rice Maize Pulses Vegetables Wheat Rice Maize Mustard Pulses Vegetable Potato Rice Maize Jute Pulses Vegetables
Source: Authors’ own calculations based on field survey (2016-2017)
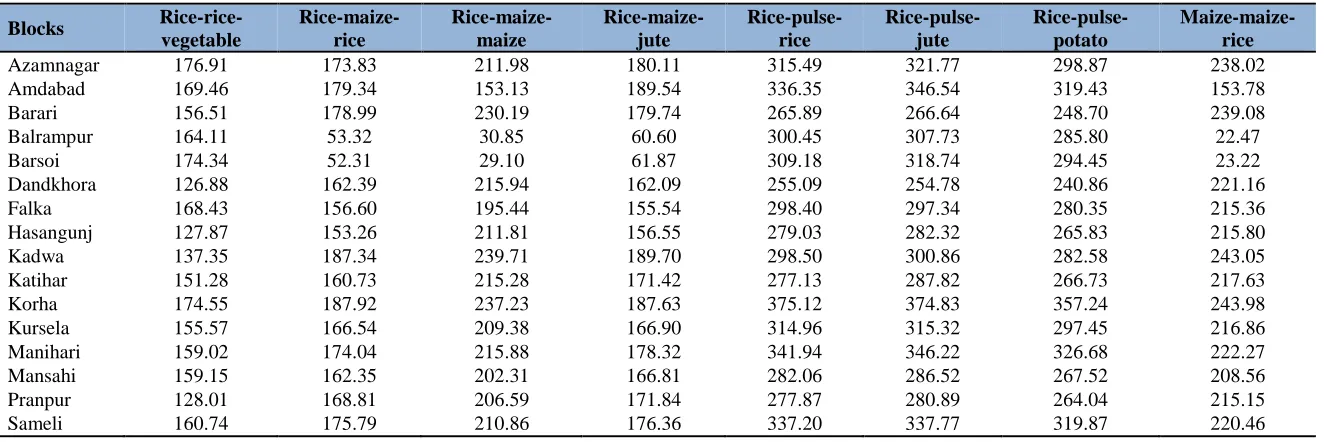
Table 4: Block-wise yield of sequential crops in Katihar district
Blocks Rice-rice-vegetable
Rice-maize-rice
Rice-maize-maize
Rice-maize-jute
Rice-pulse-rice
Rice-pulse-jute
Rice-pulse-potato
Maize-maize-rice
Azamnagar 176.91 173.83 211.98 180.11 315.49 321.77 298.87 238.02
Amdabad 169.46 179.34 153.13 189.54 336.35 346.54 319.43 153.78
Barari 156.51 178.99 230.19 179.74 265.89 266.64 248.70 239.08
Balrampur 164.11 53.32 30.85 60.60 300.45 307.73 285.80 22.47
Barsoi 174.34 52.31 29.10 61.87 309.18 318.74 294.45 23.22
Dandkhora 126.88 162.39 215.94 162.09 255.09 254.78 240.86 221.16
Falka 168.43 156.60 195.44 155.54 298.40 297.34 280.35 215.36
Hasangunj 127.87 153.26 211.81 156.55 279.03 282.32 265.83 215.80
Kadwa 137.35 187.34 239.71 189.70 298.50 300.86 282.58 243.05
Katihar 151.28 160.73 215.28 171.42 277.13 287.82 266.73 217.63
Korha 174.55 187.92 237.23 187.63 375.12 374.83 357.24 243.98
Kursela 155.57 166.54 209.38 166.90 314.96 315.32 297.45 216.86
Manihari 159.02 174.04 215.88 178.32 341.94 346.22 326.68 222.27
Mansahi 159.15 162.35 202.31 166.81 282.06 286.52 267.52 208.56
Pranpur 128.01 168.81 206.59 171.84 277.87 280.89 264.04 215.15
Sameli 160.74 175.79 210.86 176.36 337.20 337.77 319.87 220.46
Source: Authors’ own calculations based on Sentinel 2A data (2016-2017)
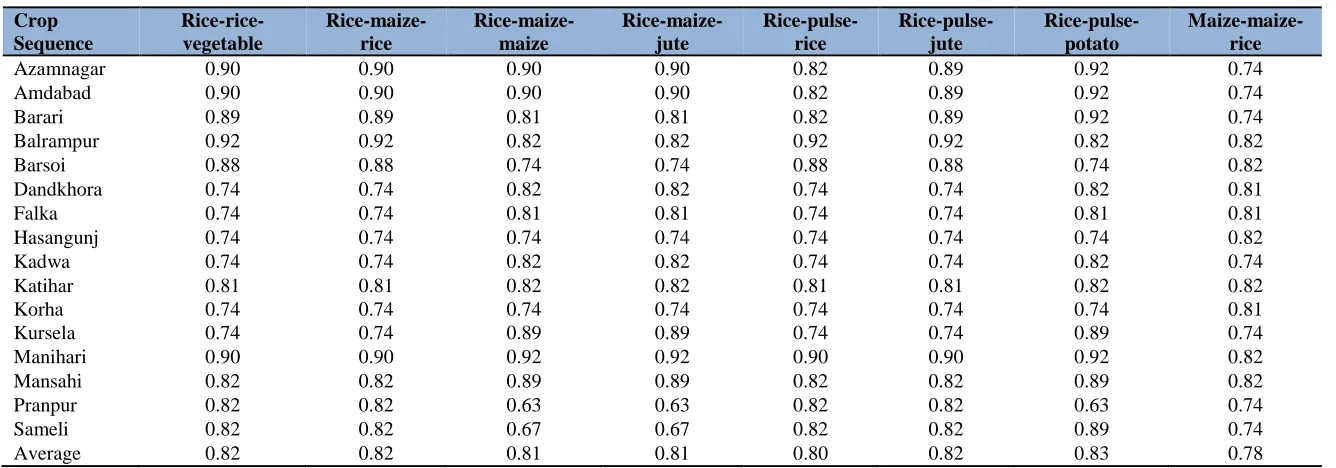
Table 5: Block-wise cultivated land utilization index of identified crop sequence in Katihar district
Crop Sequence
Rice-rice-vegetable
Rice-maize-rice
Rice-maize-maize
Rice-maize-jute
Rice-pulse-rice
Rice-pulse-jute
Rice-pulse-potato
Maize-maize-rice
Azamnagar 0.90 0.90 0.90 0.90 0.82 0.89 0.92 0.74
Amdabad 0.90 0.90 0.90 0.90 0.82 0.89 0.92 0.74
Barari 0.89 0.89 0.81 0.81 0.82 0.89 0.92 0.74
Balrampur 0.92 0.92 0.82 0.82 0.92 0.92 0.82 0.82
Barsoi 0.88 0.88 0.74 0.74 0.88 0.88 0.74 0.82
Dandkhora 0.74 0.74 0.82 0.82 0.74 0.74 0.82 0.81
Falka 0.74 0.74 0.81 0.81 0.74 0.74 0.81 0.81
Hasangunj 0.74 0.74 0.74 0.74 0.74 0.74 0.74 0.82
Kadwa 0.74 0.74 0.82 0.82 0.74 0.74 0.82 0.74
Katihar 0.81 0.81 0.82 0.82 0.81 0.81 0.82 0.82
Korha 0.74 0.74 0.74 0.74 0.74 0.74 0.74 0.81
Kursela 0.74 0.74 0.89 0.89 0.74 0.74 0.89 0.74
Manihari 0.90 0.90 0.92 0.92 0.90 0.90 0.92 0.82
Mansahi 0.82 0.82 0.89 0.89 0.82 0.82 0.89 0.82
Pranpur 0.82 0.82 0.63 0.63 0.82 0.82 0.63 0.74
Sameli 0.82 0.82 0.67 0.67 0.82 0.82 0.89 0.74
Average 0.82 0.82 0.81 0.81 0.80 0.82 0.83 0.78
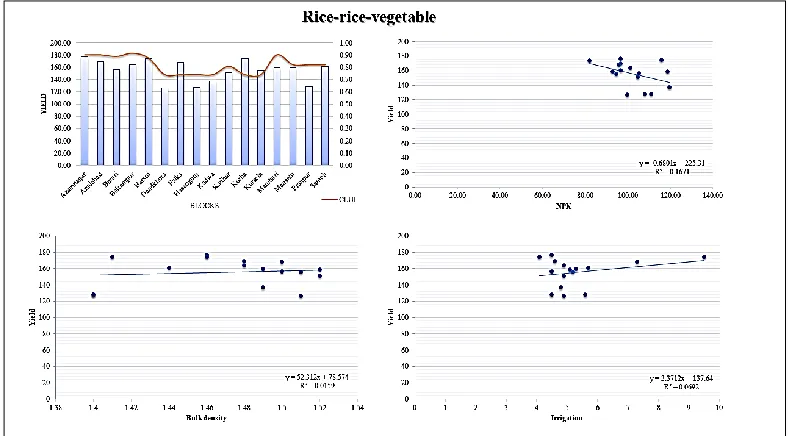
Relationship of yield and CLUI were analyzed through the graphical representation. The analysis helped to understand the production and land utilization (Table 6). Relationship of crop sequence yield with NPK, bulk density and irrigation was also analyzed to suggest suitable crop sequence.
Table 6: Correlation between crop sequence yield and supporting land resources
Crop Sequence Coefficient of correlation (R
2) Average
Production (Q/ha) NPK Bulk Density Irrigation
Rice-rice-vegetable 0.167 0.0159 0.0692 155.64
Rice-maize-rice 0.238 0.00003 0.0734 155.85
Rice-maize-maize 0.297 0.00007 0.092 188.48
Rice-maize-jute 0.0199 0.0003 0.0535 259.69
Rice-pulse-rice 0.2311 0.0469 0.2716 304.04
Rice-pulse-jute 0.0113 0.0431 0.2062 307.88
Rice-pulse-potato 0.0231 0.0521 0.2624 288.53
Maize-maize-rice 0.255 0.00002 0.0943 194.80
Source: Authors’ own calculations based on field survey (2016-2017)
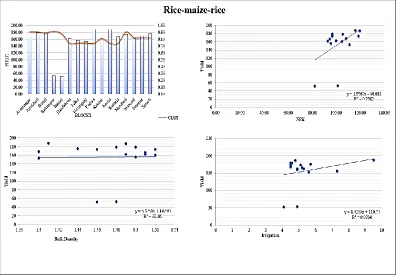
Rice- rice-vegetable sequence will be suitable in Korha and Falka blocks due to low CLUI and high yield (Figure 5). Rice-maize-rice was found suitable in Kadwa and Korha blocks (Figure 6). However, Balrampur and Barsoi have very low potential for this crop sequence. Rice-maize-maize, rice-maize-jute and maize-maize-rice were not suitable crop sequences except Korha block which has some potential in these sequences (Figure 7, 8 & 9). Rice-maize-jute will be more beneficial in Pranpur and Sameli blocks (Figure 8). Korha block has more advantage for rice-pulses-rice, rice-pulses-jute and rice-pulses-potato sequences (Figure 10, 11 & 12). In terms of productivity and CLUI maize-maize-rice sequence will be beneficial for Azamnagar, Barari, Kadwa, Kursela, Pranpur and Sameli blocks (Figure 9).
Figure 6: Relationship of yield with CLUI, NPK, bulk density and irrigation for rice-maize-rice crop sequence
Figure 8: Relationship of yield with CLUI, NPK, bulk density and irrigation for rice-maize-jute crop sequence
Figure 10: Relationship of yield with CLUI, NPK, bulk density and irrigation for maize-pulse-rice crop sequence
Figure 12: Relationship of yield with CLUI, NPK, bulk density and irrigation for rice-pulse-potato crop sequence
Korha has high potential for rice-rice-vegetable and rice-maize-rice. Rice-rice-vegetable is highly potential in Falka block. Kadwa block has high potential in rice-maize-rice sequence while Balrampur and Barsoi blocks have low potential in rice-maize-rice sequence. In rice-maize-maize crop sequence. Korha block has registered moderate potential in rice-maize-maize, rice-maize-jute, rice-pulse-rice, rice-pulse-rice, rice-pulse-jute and rice-pulse-potato sequences. Pranpur and Sameli blocks have high potential in rice-maize-maize. Azamnagar, Amdabad, Barari, Balrampur, Barsoi, Dandkhora, Falka, Hasangunj, Kadwa, Katihar, Kursela, Manihari, Mansahi and Pranpur blocks have registered potential in all sequence (Table 7). The scatter plots of NPK, bulk density and irrigation shows the relationship between yield and land resource potential.
The higher R2 value shows the increasing yield with increase in land resource potential. However, lower R2 value represents increasing yield with decreasing land resource potential. Therefore, in this study, the lower R2 value is most desirable as it represents the high yield production in marginally available land resources like NPK, bulk density and irrigation. Crop sequence with maximum average yield found in the rice - pulses - jute followed by rice - pulses - rice, rice - pulse - potato and rice- maize - jute. However, rice -maize- jute (R2 =0.02) is the most suitable sequence with low land resource potential followed by rice-pulse-jute (R2 =0.09), rice-pulse-potato (R2 =0.11) and rice-pulse-rice (R2 =0.18). Based on the analysis of the study, the ranking of crop sequences for maximum production in Katihar district are rice-pulse- jute followed by rice -maize- jute, rice-pulse-rice and rice- pulse-potato. Jute is most suitable crop in flood inundated areas due to its resistance in flood. Rice is the prime food crop of the region and suitable for low laying areas. These crop sequence-based farming system will be more effective in the district due to their potential of maximum return with limited land resources. The production through these crop sequence may be increased from present condition with the use of farm machinery and fertilizers.
4. CONCLUSION
utilization index was calculated to identify the period that land was under various crop sequences. A relationship was established between yield of crop sequences, NPK, bulk density, and irrigation. Rice-vegetables, maize-rice, maize-maize, maize-jute, pulse-rice, rice-pulse-jute, rice-pulse-potato, and maize-maize-rice were found to be the suitable crop sequences for this area under study. This study revealed rice-pulse-rice as the most suitable crop sequence, followed by rice-pulse-potato, and rice-maize-jute in terms of average maximum yield. With low resource potential, maize-jute was found to be the most suitable sequence, followed by rice-pulse-jute, rice-pulse-potato, and rice-pulse-rice. Balrampur and Barsoi blocks registered low potential in the rice-maize-rice sequence. In these blocks, effective farming techniques will play in important role in increasing the agricultural yield. In rice-maize-maize, rice-maize-jute, rice-pulse-rice, rice-pulse-rice-pulse-rice, rice-pulse-jute, and rice-pulse-potato sequences, the Korha block registered moderate potential. However, the Azamnagar, Amdabad, Barari, Balrampur, Barsoi, Dandkhora, Falka, Hasangunj, Kadwa, Katihar, Kursela, Manihari, Mansahi and Pranpur blocks registered potential in all sequence. In these blocks, farm machinery is required to maximize the yield and achieve sustainability in agricultural productivity of the area under study. Efficiency in farm inputs, fertilizers, scrupulous irrigation, and maintenance of fallow cycles will help increase the overall productivity of the suitable crop sequences in the area under study.
Funding: This study received no specific financial support.
Competing Interests: The authors declared that they have no conflict of interests.
Contributors/Acknowledgement: The authors wish to thank the anonymous reviewers and editors, for their constructive comments and suggestions for improving the overall quality of the manuscript.
Views and opinions expressed in this study are the views and opinions of the authors, Asian Journal of Agriculture and Rural Development shall not be responsible or answerable for any loss, damage or liability etc. caused in relation to/arising out of the use of the content.
References
Abrol, I. P., & Sangar, S. (2006). Sustaining Indian agriculture-conservation agriculture the way forward. Current Science, 91(8), 1020-1025.
Agriculture Contingency Plan for District: Katihar (2012). http://www.crida.in/CP-2012/statewiseplans/Bihar%20(Pdf)/BI6-Katihar%20-28.08.12.pdf. Accessed on 7th February, 2019.
Alemu, G. (2016). Characterization and analysis of farming system in chiro district, West Hararghe zone. Journal of Natural Sciences Research, 6(19), 45-51.
Amejo, A. G., Gebere, Y. M., Kassa, H., & Tana, T. (2019). Characterization of smallholder mixed crop-livestock systems in integration with spatial information: in case Ethiopia. Cogent Food & Agriculture, (just-accepted).
Bembridge, T. J. (1987). Crop farming system constraints in Transkei: Implications for research and extension. Development Southern Africa, 4(1), 67-89.
Census (2011). https://www.census2011.co.in/census/district/64-katihar.html. Accessed on 5th February, 2019.
Chatterjee, S., Goswami, R., & Bandopadhyay, P. (2015). Methodology of identification and characterization of farming systems in irrigated agriculture: case study in west Bengal State of India. Journal of Agricultural Science and Technology, 17(5), 1127-1140.
Choudhury, I., Chakraborty, M., Santra, S. C., & Parihar, J. S. (2006). Characterization of agroecosystem based on land utilization indices using remote sensing and GIS. Journal of
the Indian Society of Remote Sensing, 34(1), 23-37.
Das, P. (2006). Cropping pattern (agricultural and horticultural) in different zones, their average yields in comparison to national average/critical gaps/reasons identified and yield potential’. government of India, Ministry of Agriculture, Department of Agriculture and Cooperation
(Ed), Status of Farm Mechanization in India, 33-47.
Fan, C., Zheng, B., Myint, S. W., & Aggarwal, R. (2014). Characterizing changes in cropping patterns using sequential Landsat imagery: an adaptive threshold approach and application to Phoenix, Arizona. International Journal of Remote Sensing, 35(20), 7263-7278.
FAO (2018). The state of agricultural commodity markets. Food and agriculture organization of the united nations Rome, 2018. http://www.fao.org/3/I9542EN/i9542en.pdf. Accessed on 5th February, 2019.
FAO (2014). The state of food and agriculture 2014. Innovation in family farming. Rome. http://www.fao.org/3/a-i4040e.pdf. Accessed on 4th February, 2019.
Food and Agriculture Organization of the United Nations (FAO). (2017). The future of food and
agriculture. Trends and Challenges. Page no. 32-38.
Global Agricultural Productivity Index (2018). https://globalagriculturalproductivity.org/wp-content/uploads/2018/10/Global-Agricultural-Productivity-Index_2018-GAP-Report.pdf. Accessed on 4th February, 2019.
Hess, J. R., & Hoskinson, R. L. (1996). Methods for characterization and analysis of spatial and temporal variability for researching and managing integrated farming systems. Precision
Agriculture, (precisionagricu3), 641-650.
Iqbal, B. (2018). Indian agriculture: issues and challenges. Journal of Food Science and
Toxicology, 2(1:4), 1-2.
Jamil, M., Ahmed, R., & Sajjad, H. (2018a). Land suitability assessment for sugarcane cultivation in Bijnor district, India using geographic information system and fuzzy analytical hierarchy process. Geo Journal, 83(3), 595-611.
Jamil, M., Sahana, M., & Sajjad, H. (2018b). Crop suitability analysis in the Bijnor District, UP, using geospatial tools and fuzzy analytical hierarchy process. Agricultural Research, 7(4), 506-522.
Kleijn, D., Kohler, F., Báldi, A., Batáry, P., Concepción, E. D., Clough, Y., & Kovács, A. (2008). On the relationship between farmland biodiversity and land-use intensity in Europe. Proceedings of the Royal Society B: Biological Sciences, 276(1658), 903-909. Liebisch, F., Küng, G., Damm, A., & Walter, A. (2014, June). Characterization of crop vitality and
resource use efficiency by means of combining imaging spectroscopy based plant traits.
In Hyperspectral Image and Signal Processing: Evolution in Remote Sensing (WHISPERS),
2014 6th Workshop on (pp. 1-4). IEEE.
Overmars, K. P., Schulp, C. J., Alkemade, R., Verburg, P. H., Temme, A. J., Omtzigt, N., & Schaminée, J. H. (2014). Developing a methodology for a species-based and spatially explicit indicator for biodiversity on agricultural land in the EU. Ecological Indicators, 37, 186-198.
Panigrahy, S., Manjunath, K. R., & Ray, S. S. (2005). Deriving cropping system performance indices using remote sensing data and GIS. International Journal of Remote
Sensing, 26(12), 2595-2606.
Rajbhandari, B. P. (2011). Relationships among rotational intensity, crop diversity index, land utilization index and yield efficiency in bio-intensive and conventional farming systems. Nepalese Journal of Agricultural Sciences, 9, 44-52.
Rana, S. S., & Rana, M. C. (2011). Cropping system. Department of Agronomy, College of
Agriculture, CSK Himachal Pradesh Krishi Vishvavidyalaya, Palampur, 80.
Reza, S. K., Nayak, D. C., Mukhopadhyay, S., Chattopadhyay, T., & Singh, S. K. (2017). Characterizing spatial variability of soil properties in alluvial soils of India using geostatistics and geographical information system. Archives of Agronomy and Soil
Science, 63(11), 1489-1498.
Ruiz-Martinez, I., Marraccini, E., Debolini, M., & Bonari, E. (2015). Indicators of agricultural intensity and intensification: a review of the literature. Italian Journal of Agronomy, 10(2), 74-84.
Sajjad, H., & Prasad, S. (2014). Analyzing spatio-temporal pattern of crop diversification in Jalandhar district of Punjab, India. Asian Journal of Agriculture and Rural
Development, 4(3), 242-256.
Sajjad, H., Nasreen, I., & Ansari, S. A. (2014). Assessing spatiotemporal variation in agricultural sustainability using sustainable livelihood security index: Empirical illustration from Vaishali district of Bihar, India. Agroecology and Sustainable Food Systems, 38(1), 46-68. Sheffield, K., & Morse-McNabb, E. (2015). Using satellite imagery to asses trends in soil and crop
productivity across landscapes. In IOP Conference Series: Earth and Environmental
Science, 25(1), 012013. IOP Publishing.
Singh, H., Sharma, S. K., Dashora, L. N., Burark, S. S., & Meena, G. L. (2013). Characterization and economics of farming systems in southern Rajasthan. Annals of Arid Zone, 52(1), 67-70.
Timler, C., Michalscheck, M., Klapwijk, C., Mashingaidze, N., Ollenburger, M., Falconnier, G., & Groot, J. (2014). Characterization of farming systems in Africa RISING intervention sites in
Malawi. Tanzania, Ghana and Mali.
Van de Steeg, J. A., Verburg, P. H., Baltenweck, I., & Staal, S. J. (2010). Characterization of the spatial distribution of farming systems in the Kenyan Highlands. Applied Geography, 30(2), 239-253.