Article
1
Spatial Variability of Aroma Profiles of Cocoa Trees
2
Obtained Through Computer Vision and Machine
3
Learning Modelling: A Cover Photography and
4
Satellite Imagery Application
5
Sigfredo Fuentes1*, Gabriela Chacon1, Damir D. Torrico1, Andrea Zarate1 and
6
Claudia Gonzalez Viejo1
7
1 University of Melbourne, School of Agriculture and Food, Faculty of Veterinary and Agricultural Sciences,
8
VIC 3010, Australia. [email protected] (GC) [email protected] (DDT);
9
[email protected] (AZ); [email protected] (CGV)
10
* Correspondence: [email protected]; Tel.: +61 424504434 (SF)
11
12
Abstract:
13
Cocoa is an important commodity crop not only to produce one of the most complex products
14
such as chocolate from the sensory perspective, but one that commonly grows in developing
15
countries close to the tropics. This paper presents novel techniques applied using cover photography
16
and a novel computer application (VitiCanopy) to assess the canopy architecture of cocoa trees in a
17
commercial plantation in Queensland, Australia. From the cocoa trees monitored, pod samples were
18
collected, fermented, dried and grinded to obtain the aroma profile per tree using gas
19
chromatography. The canopy architecture data were used as inputs in an artificial neural network
20
(ANN) algorithm and the aroma profile considering six main aromas as targets. The ANN model
21
rendered high accuracy (R = 0.82; MSE = 0.09) with no overfitting. The model was then applied to a
22
satellite image from the whole cocoa field studied to produce canopy vigor and aroma profile maps
23
up to the tree-by-tree scale. The tool developed could aid significantly the canopy management
24
practices in cocoa trees that have a direct effect on cocoa quality.
25
Keywords: Leaf area index; Cocoa beans; Volatile compounds; Artificial neural networks; VitiCanopy app
26
1. Introduction
27
Cocoa (Theobroma cacao L) is considered a major world commodity crop and is the seventh
28
most exported food product [1]. Its primary use is for chocolate manufacture with an estimate of 3,981
29
thousand tons of cocoa beans production in 2016 globally [2]. However, as with any other crop, the
30
quality of cocoa beans is determinant for consumers acceptability and end-product cost. The cocoa
31
beans intended for manufacturing must comply with specific quality parameters such as shape, size,
32
color [3], flavor and aroma, cocoa butter, and protein content [4]. These are mainly related to the
33
genotype of the clone, climatic and agricultural conditions, agricultural practices (e.g. water
34
management, fertilization, canopy management), as well as fermentation, drying and
35
industrialization processes [5-9]. The cocoa crop and production are also very important for
36
developing countries, for example, cocoa produce from Ecuador is highly valued internationally due
37
to their recognized aroma intensity development [10].
38
Cocoa trees are grown in regions with high rainfall (1250 – 3000 mm / year), average
39
temperature between 18 and 32°C and calm wind conditions to avoid defoliation, furthermore, shade
40
is an important factor especially in young trees as it provides protection to excessive solar radiation
41
and helps enhance aroma profiles that are desirable in the final chocolate product. They are usually
42
planted at a density of 400 – 2500 trees per hectare and produce an average yield between 200 and
43
800 kg of fermented dried cocoa per hectare [4, 11, 12].
44
There are three main cocoa tree varieties: i) Criollo, ii) Forastero and iii) Trinitario, the latter
45
being a hybrid group. Varieties i and iii are considered as fine or flavor quality cocoa beans, while
46
the ii is used to produce bulk quality cocoa. Specifically, the cocoa quality is mainly influenced by the
47
growing conditions where the tree is grown, such as soil depth, pH (4.5 – 7), weather changes, and
48
pest and disease control [13]. Some techniques to manage the cocoa trees to assure high quality beans
49
are: i) pest and disease control, ii) soil nutrients management, iii) weed control and iv) management
50
of shade and canopy pruning [14]. The latter technique is important due to the fact that the
51
relationship between light and shade is critical as the shade provides protection against sunlight and
52
high winds, and lowers the temperature to manage growth of the cocoa tree [4, 11].
53
In cocoa plantations, some in-field factors that have been reported to affect cocoa quality are
54
the exposure to solar radiation that has effects on the final fruit dry weight and the growth
55
temperature, which has in turn an influence in the lipid content and melting point [15]. However, no
56
relationship between the aroma quality of the cocoa beans, and canopy architecture parameters, such
57
as leaf area index (LAI) been reported. A complex method proposed by researchers to assess cocoa
58
beans quality from the field is through the genetic identification of the variety by using
59
deoxyribonucleic acid (DNA) fingerprinting and utilizing microsatellite markers containing the
60
information from leaf samples [13, 16]. However, this method is time-consuming, non-practical and
61
cost-ineffective. Furthermore, the analysis of the trees at a the leaf level has shown to be challenging
62
due to the difficulty of sampling leaves with the same growth conditions (e.g. shade, age) [11] and
63
complexity of the environment when plants are grown between other tree species (i.e. within a forest).
64
This paper presents the assessment of canopy architecture parameters of cocoa trees using
65
the VitiCanopy computer application as ground-truth to validate information extracted from satellite
66
images to automatically obtain these parameters within a plantation and up to a tree-by-tree
67
resolution. From the same ground-truth cocoa trees, the volatile aroma compounds were assessed
68
from fermented and dried cocoa beans using gas chromatography mass spectroscopy (GC-MS) with
69
a solid phase microextraction in the headspace (SPME-HS). The canopy architecture data were used
70
as inputs to develop a machine learning model to predict six of the main volatile compounds in cocoa
71
beans and associated aromas. Since all the information obtained either through computer vision
72
algorithms (canopy architecture) and machine learning modelling (aroma profiles) at the tree-by-tree
73
scale, spatial distribution aroma maps were constructed from the cocoa plantation used in this
74
research.
75
2. Materials and Methods
76
2.1 Site and tree sample description
77
The cocoa trees used in this research are located in a commercial farm with Papua New Guinea
78
Hybrids (PNH) at Mt Edna Maria Creeks, (17°49'14" S 146°02'21" E), North Queensland, Australia.
The soil type is clay loam with a pH of 5, under a tree sprinkler irrigation system, and with sprinkler
80
discharge of 40 L per hour. Sprinklers were located between tree rows at 4 m interval and a minimal
81
chemical usage for pests and disease management was applied when required.
82
Cocoa trees were planted in three blocks using Tatura trellis pruning system, which requires a
83
continuous shaping of the tree canopy. Among blocks one and two, the planting density was ± 1500
84
cocoa trees planted in a double row layout at a distance of 5 m between rows, 250 mm from the center
85
and a space of 2 m between trees. The blocks and rows were planted on different seasons for pruning
86
test purposes. Block one was planted in March 2013 and block two in October 2013. In both blocks,
87
row A was planted first. The pattern area (Figure 1) was excluded from data collection because the
88
trees were established as free standing trees and were at the flowering stage. On the right side of the
89
block one and the lower lateral of the two blocks, the plantation was surrounded by Erythrina variegata
90
or coral tree used as a windbreak, while block two is surrounded by common vegetation of the site.
91
The cocoa plantation was grown under full sunlight conditions without intercropping species or
92
shade species.
93
94
95
96
97
98
99
100
101
102
103
Figure 1. Satellite image of cocoa plantation close to harvest from Mt Edna Maria Creeks, Queensland,
104
Australia. Yellow dotted lines show the blocks used and numbered from 1 to 3.
105
The weather data of the site was obtained at an approximate distance of 30 km from the
106
plantation from the Bureau of Meteorology (BOM) weather station located at South Johnstone
107
(Australian BOM Station No. 032037, 17.61 °S 146.00 °E). An average rainfall of 3289.3 mm per year,
108
mean maximum and minimum temperature of 28.1 °C and 19.2 °C, respectively were recorded in the
109
season studied (2015-2016), which is consistent with the climate classification for the site as a tropical
110
monsoonal region.
111
2.2 Cocoa trees and pods/beans sampling
112
A total of 24 cocoa trees were used for this study, each tree was measured nine times to use as
113
replicates. The cocoa pods were randomly sampled from the mentioned trees according to the general
114
guidelines on sampling CAC/GL 50-2004 recommended by the Codex Alimentarius Commission.
115
Two to three cocoa pods were harvested from each tree. Each pod was assigned a label as B1 or B2
116
according to the blocks from which they were collected (1 or 2), followed by the number of the tree
117
B2
B1
sampled (e.g. A15) and the letter of the row (A or B). Every tree was geo-located using the VitiCanopy
118
App, which will be described following. The harvest for the three blocks from this trial were
119
harvested the 2nd of February 2016.
120
2.3 Image data acquisition
121
For each of the 24 sampled trees, a total of nine upward looking canopy images were obtained
122
using the VitiCanopy computer application [17] within three consecutive days (three per day). The
123
digital images from the tree canopies were obtained with the front camera of an iPhone 5S (Apple
124
Inc. Corp. Cupertino, CA. USA), which has 1.2 megapixels of resolution. The device was mounted on
125
a Soniq Bluetooth Selfie Stick (SONIQ Australia Pty Ltd, Braeside, Victoria, Australia) facing upwards
126
at 0.5 m height using a tripod. The device was aligned using a bubble level attached to the selfie stick
127
to ensure it was in a horizontal position for each image obtained at 0o Zenith angle. The device was
128
positioned with its maximum length perpendicular to the direction of the trunk. The images were
129
acquired by locating the device at 0.5 m from the trunk and 0.5 m to the left and right side (Figure 2).
130
Imagery were obtained four hours before noon to avoid direct sunlight into the lens of the device, as
131
recommended by Poblete-Echeverría et al. [18]. All the equipment used for the image acquisition was
132
ubiquitous (smartphones) low-cost and suitable for field work.
133
134
135
136
137
138
139
140
141
142
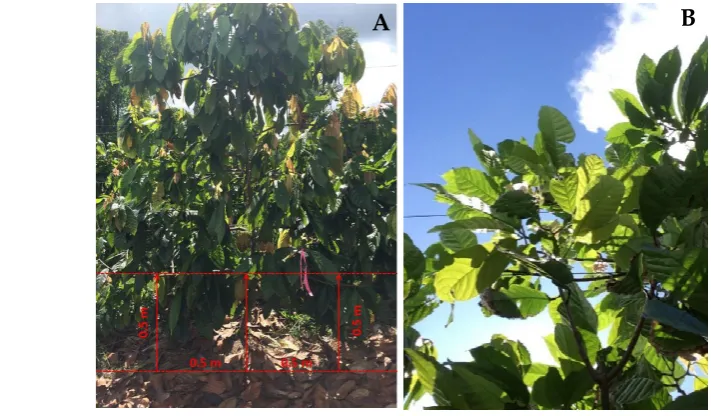
Figure 2. A) Distance of image acquisition data in cocoa trees under Tatura trellis system using
143
VitiCanopy application (app) and B) image of canopy recorded using the VitiCanopy app
144
2.4 Estimation of canopy architecture parameters by the VitiCanopy app
145
Pictures with direct sunlight, weeds, posts, operators and canopy from the other trees were
146
considered unsuitable for analysis and discarded. Canopy architecture parameters are obtained using
147
the following algorithms to obtain the fractions of foliage projective cover (ff), crown cover (fc) and
148
crown porosity (Φ), which were calculated from McFarlane et al. [19] as:
149
(1)
150
(2)
151
tp
tg
1
−
=
f
f
tp
lg
1
−
=
c
f
(3)
152
153
Where lg = large gap pixels; tg = total pixels in all gaps and tp = total gap pixels.
154
155
LAIM is calculated from Beer’s Law.
156
(4)
157
and the clumping index at the zenith, Ω(0), was calculated as follows:
158
(5)
159
The clumping index is a correction factor to obtain effective LAI (LAIe), which is the product of:
160
(6)
161
162
Equation 5 describes the non-random distribution of canopy elements. If Ω(0) = 1, means that the
163
canopy displays random dispersion; for Ω(0) > or < 1, the canopy is defined as clumped.
164
This innovative app estimates canopy architecture parameters using upward-looking digital
165
images based on a method developed by Fuentes and De Bei et al. [20]. The algorithms used in
166
VitiCanopy app were calculated based on the formulas from Macfarlane et al. [19]. In the settings
167
menu of the application, the gap fraction threshold was set up at 75%, which means that a big gap
168
was considered when 75% of the pixels from the images correspond to the sky [20]. A value of light
169
extinction coefficient (k) of 0.7 was set up based on the range of the standard mean values identified
170
from the samples and according to the literature review data of cocoa trees studies making by Yapp
171
[21] and Daymond et al. [22]. Since in these images, the sky serves as background to isolate non-leaf
172
material, the app filters automatically sky and clouds by segmentation of images using the blue
173
channel of the RGB images. In order to record the Global Positioning System (GPS) data of each cocoa
174
tree, the location service of the app was enabled. The images were analyzed with the application
175
individually as they were obtained. The results from the app, which included the canopy architecture
176
parameters, date, GPS location and settings used were exported via email by tapping the “Export”
177
option that generates a comma separated values (.csv) file with all the data.
178
2.5 Satellite imagery and processing
179
The satellite image used for this research was obtained from Google Earth Pro (ver. 7.3.2.5776;
180
Google, Mountain View, Ca. USA). The date obtained was closer to the harvest (26th April 2016). The
181
image was saves as a maximum high-resolution (4800 x 2679 pixels) Joint Photographic Expert Group
182
(JPEG) file. The satellite image was processed to recognize every single plant and extract information
183
from each one using the methodology proposed and described in previous studies [23, 24] through
184
customized codes written in Matlab® (Mathworks Inc. Natick, MA, USA.). In general, the automated
185
procedure consists in the following steps:
186
1. Identification of area designated by the plant (distance between plants and between
187
rows).
188
c f
f
f
−
=
Φ
1
LAI
M= −
f
cln
Φ
k
Ω
(0)
=
(1
− Φ
)ln(1
−
f
f)
ln(
Φ
) /
f
f2. Individual segmentation of tree leaf material using the CIELab color code to generate
189
a binary image
190
3. Analysis of binary image per plant using algorithms described previously (1-6).
191
4. Data extracted were compiled in a matrix form to preserve plant positions.
192
5. If canopies were of low cover (fc > 0.1) were considered as missing plant [23]
193
Cocoa bean fermentation and drying process
194
The harvested cocoa pods were transported to The University of Melbourne, Australia and
195
stored for 10 days at room temperature between 20 and 25°C. The storage time allowed a significant
196
increase of the pH related with cocoa flavor potential [25, 26]. The seeds were taken from inside of
197
each pod sample and mixed with a solution of a commercial yeast Saccharomyces cerevisiae (Lowan
198
Whole Foods, Glendenning, NSW, Australia) and water in a plastic container. For the fermentation
199
process, the labeled plastic containers were placed into an incubator I100-G300-D (Thermoline
200
Scientific Equipment Pty Ltd, Wetherill Park NSW, Australia), which was set up at 25 °C (0-12 h), 30
201
°C (12–24 h), 35 °C (24-36 h), 40 °C (36-48 h), 45 °C (48-72 h) and 48 °C (72 – 144h). The temperature
202
was monitored daily and the seeds were manually flipped every 48 hours to ensure aeration and
203
uniform fermentation. After six days of fermentation, a cut test was performed to assess the quality
204
of the process. Subsequently, for the drying process, the beans were set up in a Qualtex Solid State
205
oven, Series 2000 (Qualtex Australasia P/L, Murarrie QLD, Australia) at 45 ± 2 °C and mixed manually
206
and daily for three days to get a uniform drying.
207
2.6 Analysis of volatile compounds using gas chromatography – mass spectroscopy
208
The cocoa beans from each pod sample were grinded in a commercial coffee blender Sunbeam
209
Multigrinder II EM0405 (Sunbeam Products, Boca Raton, FL, USA) for 60 seconds. One gram of the
210
ground beans was placed into a 15 mL tightly capped vial with 5 mL of saturated salt solution and
211
100 µL of pyrazine dilution. According to the procedure of De Brito et al. [5], the vials were mixed in
212
a vortex (Vor-Mix VM80) for 1 min and preheated for 45 min at 60°C, then placed in a dry block
213
heater and mixed in an orbital mixer OM1 (Ratek Instruments Pty. Ltd, Boronia, Victoria, Australia).
214
The volatile compounds were extracted by solid phase micro extraction in the headspace
(SPME-215
HS) with Supelco fibers 50/30 µm divinylbenzene/carboxene/ polydimethylsiloxane
216
(DVB/CAR/PDMS). The extraction of the volatile compounds of each sample took place for 15 min,
217
with 30 mins at 60°C of fiber exposition to the cocoa aromas in the headspace [27]. The fibers were
218
then analyzed by gas chromatography (GC; Agilent Technologies 6850 Series II, Network GC System)
219
coupled to a mass spectrometry (MS; Agilent Technologies 5973 Network Mass Selective Detector).
220
The GC-MS was equipped with Agilent J&W DB-Wax column (30 m*0.25 mm, 0.25 µm film
221
thickness). The oven temperature was set at 40 °C for 5 min then increased to 200 °C at a rate of 10 °C
222
min-1., and finally maintained at 200 °C for 30 min. The carrier gas was helium (Air Liquide or BOC,
223
Ultra-High Purity), linear velocity 36 cm/s, and flow rate 2.0 ml/min in constant flow mode. The
224
SPME fiber was desorbed in the pulsed splitless injection mode for 5 min at 240 °C and opened after
225
0.5 min. The temperature of the selective mass detector quadrupole was MS source 230 and MS Quad
226
180, with an electronic impact ionization system at 70 eV. Compounds identification was performed
227
by comparing the mass spectra of each compound with the National Institute of Standards and
228
Technology MS NIST02.L (National Institute of Standards and Technology, Gaithersburg, MD,
229
United States) library of mass spectra.
2.7 Statistical analysis and machine learning modelling
232
An analysis of variance (ANOVA) was conducted to assess significant differences in the LAI
233
values and canopy architecture between the sampled trees using SAS® 9.4 software (SAS Institute
234
Inc. Cary, NC. USA). A post-hoc analysis with Tukey studentized method (α = 0.05) was used. Means
235
and standard deviation (SD) were calculated for each parameter.
236
A machine learning model was developed using the Bayesian Regularization training algorithm
237
after testing 17 different artificial neural network (ANN) algorithms (two backpropagation using
238
Jacobian derivatives, 11 backpropagation using gradient derivatives, and four supervised weight /
239
bias training) using a customized and automatic Matlab® R2018b code developed (unpublished). Six
240
canopy architecture parameters from the canopy measurements: [i) LAI, ii) LAIe, iii) ff), iv) fc, v) ϕ,
241
and vi) Ω] were used as inputs to predict six main aroma compounds: i) phenethyl acetate, ii)
2-242
Phenyl-2-butenal, iii) isoamyl acetate, iv) tetramethylpyrazine, v) phenylacetaldehyde and vi)
2,3-243
butanediol. All inputs and target values were normalized from -1 to 1. To develop the model, a
244
random data division was used with 85% (N = 147) of the samples used for training, 15% (N = 26) for
245
testing with a default derivative function and performance algorithm based on mean squared error
246
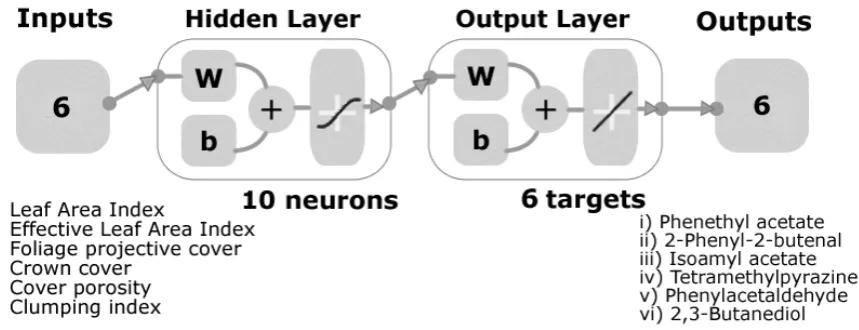
(MSE). The model (Figure 3) was built with a two-layer feedforward network using a tan-sigmoid
247
function in the hidden layer and a linear transfer function in the output layer. A trimming assessment
248
was performed using 3, 5, 7 and 10 neurons to find the model with the best performance and less
249
chance of overfitting. Statistical results are presented for correlation coefficient (R) and mean squared
250
error values (MSE).
251
252
Figure 3. Model diagram showing the two-layer feedforward network with six inputs from the
253
canopy architecture, 10 neurons in the hidden layer with a tan-sigmoid function and a linear transfer
254
function in the output layer. Six targets/outputs from the volatile compounds were used for the
255
model.
256
Once developed, the machine learning model was run using the canopy architecture data
257
extracted from the satellite imagery as inputs to obtain the six aromas per tree. Geo-location per tree
258
was obtained from the GPS data from block corners and considering the plantation density through
259
a customized code written in Matlab® R2019a (Fuentes, unpublished). With this information, two
260
maps of LAIe and the aroma profiles was generated in Matlab, the first using kriging interpolation
261
algorithms and the second using scattered data representing each individual tree.
3. Results
264
3.1. Canopy architecture and volatile compounds
265
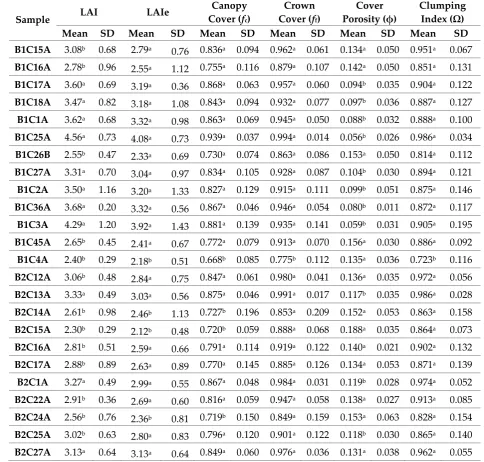
Table 1 shows the results of the means and SD from the canopy architecture of each of the 24
266
sampled trees. There were significant differences (p < 0.05) between samples for the six parameters;
267
however, for the clumping index only one sample (B1C4A) was significantly different.
268
Table 1. Means and standard deviation (SD) of the parameters obtained from canopy architecture for
269
each sampled tree. Different letters represent statistically significant differences between samples
270
using Tukey studentized test with α = 0.05.
271
Sample LAI LAIe
Canopy Cover (fc)
Crown Cover (ff)
Cover Porosity (ϕ)
Clumping Index (Ω) Mean SD Mean SD Mean SD Mean SD Mean SD Mean SD B1C15A 3.08b 0.68 2.79a 0.76 0.836a 0.094 0.962a 0.061 0.134a 0.050 0.951a 0.067
B1C16A 2.78b 0.96 2.55a 1.12 0.755a 0.116 0.879a 0.107 0.142a 0.050 0.851a 0.131
B1C17A 3.60a 0.69 3.19a 0.36 0.868a 0.063 0.957a 0.060 0.094b 0.035 0.904a 0.122
B1C18A 3.47a 0.82 3.18a 1.08 0.843a 0.094 0.932a 0.077 0.097b 0.036 0.887a 0.127
B1C1A 3.62a 0.68 3.32a 0.98 0.863a 0.069 0.945a 0.050 0.088b 0.032 0.888a 0.100
B1C25A 4.56a 0.73 4.08a 0.73 0.939a 0.037 0.994a 0.014 0.056b 0.026 0.986a 0.034
B1C26B 2.55b 0.47 2.33a 0.69 0.730a 0.074 0.863a 0.086 0.153a 0.050 0.814a 0.112
B1C27A 3.31a 0.70 3.04a 0.97 0.834a 0.105 0.928a 0.087 0.104b 0.030 0.894a 0.121
B1C2A 3.50a 1.16 3.20a 1.33 0.827a 0.129 0.915a 0.111 0.099b 0.051 0.875a 0.146
B1C36A 3.68a 0.20 3.32a 0.56 0.867a 0.046 0.946a 0.054 0.080b 0.011 0.872a 0.117
B1C3A 4.29a 1.20 3.92a 1.43 0.881a 0.139 0.935a 0.141 0.059b 0.031 0.905a 0.195
B1C45A 2.65b 0.45 2.41a 0.67 0.772a 0.079 0.913a 0.070 0.156a 0.030 0.886a 0.092
B1C4A 2.40b 0.29 2.18b 0.51 0.668b 0.085 0.775b 0.112 0.135a 0.036 0.723b 0.116
B2C12A 3.06b 0.48 2.84a 0.75 0.847a 0.061 0.980a 0.041 0.136a 0.035 0.972a 0.056
B2C13A 3.33a 0.49 3.03a 0.56 0.875a 0.046 0.991a 0.017 0.117b 0.035 0.986a 0.028
B2C14A 2.61b 0.98 2.46b 1.13 0.727b 0.196 0.853a 0.209 0.152a 0.053 0.863a 0.158
B2C15A 2.30b 0.29 2.12b 0.48 0.720b 0.059 0.888a 0.068 0.188a 0.035 0.864a 0.073
B2C16A 2.81b 0.51 2.59a 0.66 0.791a 0.114 0.919a 0.122 0.140a 0.021 0.902a 0.132
B2C17A 2.88b 0.89 2.63a 0.89 0.770a 0.145 0.885a 0.126 0.134a 0.053 0.871a 0.139
B2C1A 3.27a 0.49 2.99a 0.55 0.867a 0.048 0.984a 0.031 0.119b 0.028 0.974a 0.052
B2C22A 2.91b 0.36 2.69a 0.60 0.816a 0.059 0.947a 0.058 0.138a 0.027 0.913a 0.085
B2C24A 2.56b 0.76 2.36b 0.81 0.719b 0.150 0.849a 0.159 0.153a 0.063 0.828a 0.154
B2C25A 3.02b 0.63 2.80a 0.83 0.796a 0.120 0.901a 0.122 0.118b 0.030 0.865a 0.140
B2C27A 3.13a 0.64 3.13a 0.64 0.849a 0.060 0.976a 0.036 0.131a 0.038 0.962a 0.055
Abbreviations: LAI = Leaf Area Index, LAIe = effective LAI; Sample codes: B1 = Block 1, B2 = Block 2, C# =
272
Number of tree, and A or B = Position of tree (Row)
273
274
Table 2 shows the means and SD from the results of both blocks in which significant differences
275
(p < 0.05) can be observed for LAI, LAIe and cover porosity. Block 1 had higher mean values of LAI
276
and, although not significantly different, crown cover results compared to block 2. On the contrary,
277
block 1 presented lower and significant values of clumping index than block.
Table 2. Means and standard deviation (SD) of canopy architecture parameters for two blocks.
279
Different letters represent statistically significant differences between samples using Tukey
280
studentized test with α = 0.05.
281
Block LAI LAIe
Canopy Cover (fc)
Crown Cover (ff)
Cover Porosity (ϕ)
Clumping Index (Ω)
Mean SD Mean SD Mean SD Mean SD Mean SD Mean SD
B1 3.35a 0.93 3.04a 1.01 0.822a 0.11 0.919a 0.095 0.107b 0.048 0.880a 0.126
B2 2.89b 0.67 2.68b 0.76 0.796a 0.12 0.923a 0.116 0.139a 0.043 0.907a 0.116
Abbreviations: LAI = Leaf Area Index, LAIe = effective LAI, B1 = Block 1, B2 = Block 2
282
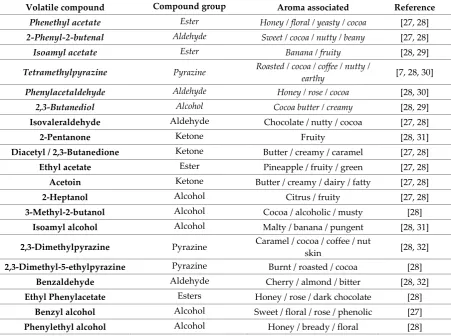
Table 3 presents the volatile compounds found in the fermented cocoa beans and the aromas
283
associated to them. It can be observed that most of the associated aromas are related to cocoa, butter,
284
honey, fruity, floral, nutty and roasted. Figure 4 shows the peak area of each volatile compound
285
found in every sample. It can be seen that most of the samples had phenylethyl alcohol as the most
286
abundant volatile, except for the beans of five trees (B1C1A, B1C18A, B1C26B, B2C14A, B2C16A).
287
Tetramethylpyrazine was present in most of the samples and is higher in those from Block 1 than
288
Block 2. Benzaldehyde and 2,3-butanediol were present in all samples, however, the peak area varied
289
between samples. Pehenthyl acetate and isoamyl acetate were present in all, except for two (B1C25A
290
and B2C16A) and one (B1C25A) samples, respectively. Other compounds such as 2-pentanone
291
(fruity) and ethyl acetate (pineapple / fruity / green) were only detected in four (B1C1A, B1C27A,
292
B2C16A, B2C24A) and six samples (B1C16A, B1C26B, B1C27A, B1C36A, B1C45A B2C16A).
293
Table 2. Major volatile compounds found in the fermented cocoa beans and aromas associated.
294
Volatile compound Compound group Aroma associated Reference Phenethyl acetate Ester Honey / floral / yeasty / cocoa [27, 28] 2‐Phenyl‐2‐butenal Aldehyde Sweet / cocoa / nutty / beany [27, 28] Isoamyl acetate Ester Banana / fruity [28, 29]
Tetramethylpyrazine Pyrazine Roasted / cocoa / coffee / nutty /
earthy [7, 28, 30]
Phenylacetaldehyde Aldehyde Honey / rose / cocoa [28, 30] 2,3‐Butanediol Alcohol Cocoa butter / creamy [28, 29] Isovaleraldehyde Aldehyde Chocolate / nutty / cocoa [27, 28]
2-Pentanone Ketone Fruity [28, 31]
Diacetyl / 2,3-Butanedione Ketone Butter / creamy / caramel [27, 28] Ethyl acetate Ester Pineapple / fruity / green [27, 28] Acetoin Ketone Butter / creamy / dairy / fatty [27, 28]
2-Heptanol Alcohol Citrus / fruity [27, 28]
3-Methyl-2-butanol Alcohol Cocoa / alcoholic / musty [28] Isoamyl alcohol Alcohol Malty / banana / pungent [28, 31] 2,3-Dimethylpyrazine Pyrazine Caramel / cocoa / coffee / nut
skin [28, 32]
2,3-Dimethyl-5-ethylpyrazine Pyrazine Burnt / roasted / cocoa [28] Benzaldehyde Aldehyde Cherry / almond / bitter [28, 32] Ethyl Phenylacetate Esters Honey / rose / dark chocolate [28]
Benzyl alcohol Alcohol Sweet / floral / rose / phenolic [27] Phenylethyl alcohol Alcohol Honey / bready / floral [28]
* Compunds in italics were used as targets for machine learning modelling
296
Figure 4. Peak area of the volatile compounds found in the fermented cocoa bean samples. All values are reported in scientific notation 103. Sample codes: B1 =
297
Block 1, B2 = Block 2, C# = Number of tree, and A or B = Position of tree (Row)
298
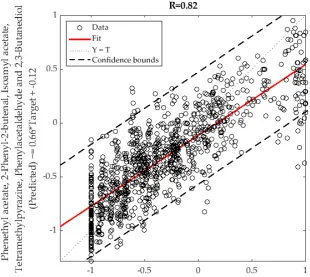
3.2 Machine learning modelling
299
Figure 5 shows the machine learning model to predict six of the main volatile compounds in
300
cacao beans (phenethyl acetate, 2-phenyl-2-butenal, isoamyl acetate, tetramethylpyrazine,
301
phenylacetaldehyde and 2,3-butanediol) using the LAI values and canopy architecture data as inputs.
302
The overall model had 4.8% of outliers according to the 95% confidence bounds. In Table 3, it can be
303
observed that the training stage had a correlation coefficient R = 0.82, while the testing stage and the
304
overall model had a correlation coefficient R = 0.81 and 0.82, respectively. Furthermore, the model
305
had a high performance MSE = 0.09 for the training stage and MSE = 0.11 for the testing stage, which
306
are indicative of an adequate model.
307
308
309
Figure 5. Artificial neural network overall model showing the observed responses (targets) in x-axis
310
and the predicted values (outputs) in the y-axis of the six volatile compounds. R = correlation
311
coefficient
312
Table 3. Results from the artificial neural network model showing the number of samples and
313
observations, correlation coefficient (R) and performance based on means squared error (MSE) for
314
each stage.
315
Stage Samples Observations
(Samples x 6 targets) R MSE
Training 147 882 0.82 0.09
Testing 26 156 0.81 0.11
3.3 Implementation of the machine learning model developed to map aroma compounds from satelite imagery
316
High resolution satellite imagery allowed the extraction of canopy architecture parameters from
317
sub-images per plant that are effectivelly comparable to upward looking images from the VitiCanopy
318
App. This was validated using a simple linear regression between the averaged LAIe parameters
319
from the 24 sampled trees in the field using VitiCanopy (observed) and those obtained from the same
320
plants extracted from the satellite image (data not shown).
321
The machine learning model developed and described in Figure 5 and Table 3 was implemented
322
using the canopy architecture parameters obtained from the satellite imagery. Figure 6 shows the
323
LAIe and aroma profile data from each of the three blocks studied using a kriging interpolation
324
technique. The denormalised GC area values obtained from the machine learning model
325
implementation were from 0 to 60 x 103, which was used as scale for all the aroma profiles. Since LAIe
326
is one of the most important canopy architectural parameters, it is individually mapped with values
327
ranging from 0 (missing plants) to 6. Figure 7 shows the scattered values, which represent the LAIe
328
and aroma profile per individual plants from the field studied.
329
330
331
332
333
334
335
336
337
338
339
340
341
344
Figure 6. Original satellite image obtained from Google Maps Pro [A] and Mapping of effective leaf area index (LAIe) [B] and aroma profiles for Phenethyl acetate
345
(Honey / floral / yeasty / cocoa) [C]; 2-Phenyl-2-butenal (Sweet / cocoa / nutty / beany) [D]; Isoamyl acetate (Banana / fruity) [E]; pyrazine tetramethyl (Roasted /
346
cocoa / coffee / nutty / earthy) [F]; Phenylacetaldehyde (Honey / rose / cocoa) [G] and 2,3-Butanediol (Cocoa butter / creamy) [H].
347
348
349
Figure 7. Original satellite image obtained from Google Map Pro [A] and plant by plant mapping of effective leaf area index (LAIe) [B] and aroma profiles for
350
Phenethyl acetate (Honey / floral / yeasty / cocoa) [C]; 2-Phenyl-2-butenal (Sweet / cocoa / nutty / beany) [D]; Isoamyl acetate (Banana / fruity) [E]; pyrazine
351
tetramethyl (Roasted / cocoa / coffee / nutty / earthy) [F]; Phenylacetaldehyde (Honey / rose / cocoa) [G] and 2,3-Butanediol (Cocoa butter / creamy) [H].
352
4. Discussion
353
4.1. Canopy architecture and volatile compounds
354
The mean values of LAI and LAIe for all trees fall within those reported by Daymond et al. [22]
355
(2.2 – 4.5) for different clones of cacao in Brazil. The range of the mean values of canopy cover found
356
in the present study was between 67 and 94%, this is similar to the range (72 - 91%) obtained by Bos
357
et al. [33] in Criollo and Forastero hybrids of cacao trees from Indonesia. The significant differences
358
found between the two blocks for LAI, LAIe and cover porosity may be due to the fact that the block
359
1 was planted in March 2013, while block 2 was in October 2013, therefore, their maturity stages were
360
different at the time of measurements, giving an average LAI of 2.89 for block 2, which is lower than
361
the block 1 (3.35).
362
All volatile compounds found in the cocoa beans have been previously reported in other studies.
363
Ten out of 20 of these compounds provide aromas related to nuts, roasted, cocoa and chocolate, while
364
six compounds provide fruity aromas including banana, cherry and pineapple. acetoin and
2,3-365
butanediol, which elicit creamy and butter aromas were also found. According to Aprotosoaie et al.
366
[34], the alcohols found in cocoa are due to fermentation and decrease with drying and roasting;
367
however, 2-heptanol and phenylethyl alcohol, which give fruity and floral aromas, are commonly
368
found in cacao. In the present study, phenylethyl alcohol was the most abundant compound in most
369
of the samples. Furthermore, aldehydes and ketones followed by esters and pyrazines are the most
370
important to determine cocoa quality [27, 34], in this study seven compounds from aldehydes and
371
ketones, four esters and three pyrazines were found (Table 2). According to Rodriguez-Campos et al.
372
[27], phenethyl acetate is an important ester in fermented cocoa beans, and higher concentrations of
373
this compound are an indicator of high cocoa quality, in the present study, this volatile was identified
374
in 22 out of 24 samples. On the other hand, similar to the present study, tetramethylpyrazine has been
375
reported in other studies as the most abundant pyrazine and is one of the most important volatiles
376
for cocoa flavor [35], it was found in all except one sample from this study (Figure 4).
377
4.2 Machine learning modelling to predict aroma profile
378
Besides fermentation and drying, other factors that contribute to differences in aromas and
379
flavors in cacao are the genotype, location and growth conditions, ripening, and amount of shade
380
[36]. Therefore, the machine learning model developed in this study based on canopy architecture
381
parameters has a strong basis on the physiological factors affecting aroma profile. Hence, the high
382
accuracy and performance obtained (R = 0.82; MSE = 0.09) using the canopy architecture information,
383
which is related to the amount of shade, represent accurately the six volatile compounds commonly
384
found in cocoa and that are determinant for its quality (Table 2). Up to date, there are no known
385
studies that have managed to predict the volatile compounds in cacao using the canopy architecture;
386
however, there is a study in grapevines, in which flavonol contents were predicted using canopy
387
porosity and LAI using partial least squares (PLS) regression [37].
388
The model presented in this paper, may be useful by producers to modify canopy architecture
389
of the cocoa trees according to the desired aroma characteristics on the final product. This would
390
allow them to know avoid financial loses or predict the end use of the final product by anticipating
391
the quality based on the aroma profile. This model may be fed with more data from samples of other
392
regions and genotypes to create a general predictive model to be used by any growers. On the other
393
hand, similar models may be developed for other crops to predict and improve the quality at early
394
stages.
395
4.2 Machine learning modelling to predict aroma profile
397
Spatial distribution of LAIe and aroma profiles were possible due to high resolution satellite
398
images which can be effectively used to implement the canopy cover photography algorithms
399
described (1-6). A similar approach was implemented for grapevines using fc with similar results
400
from imagery obtained using unmanned aerial vehicles [23]. From the kriging interpolated maps
401
(Figure 6) it can be clearly seen that some compounds are highly dependent on vigor characteristics
402
of plants, such as isoamyl acetate with clear differences of higher areas found for the far-right row in
403
block 1 (Figure 6.E). These trees corresponded to almost double LAIe (~ 5) compared to the average
404
of trees in blocks 1 and 2 (Figure 6.A and B). Other compounds such as phenethyl acetate,
405
phenylacetaldehyde and pyrazine tetramethyl do not have many spatial differences among the three
406
blocks (Figures 6 C, G and F respectively). The latter results confirm that the pattern of the machine
407
learning models was effectively identified and they are independent for each aroma related to canopy
408
architecture parameters.
409
The differences in spatial distribution of growth and aroma profile can be more clearly seen
410
using a scattering plot, which represent the tree-by-tree scale (Figure 7). This spatial distribution map
411
could offer growers a powerful tool to perform tailored canopy management strategies to manage
412
aroma profile outputs that could be considered desirable or to uniform quality of pods and, finally,
413
the chocolate produced.
414
5. Conclusion
415
The data analysis tools presented in this paper could contribute significantly to adapt
416
management strategies from growers, specifically canopy management, to obtain desired aroma
417
profiles at the tree-by-tree scale. Specific practical applications could be related to homogenize the
418
aroma quality profile within plants and the entire plantation or to increase desired and specific
419
aromas to change the style of the cocoa volatiles. These management strategies can be implemented
420
within the critical stages of the growing period of cocoa trees or close to harvest. By implementing
421
VitiCanopy and the machine learning modelling strategies presented, these potential changes in
422
volatile composition of beans related to canopy architecture changes due to canopy management can
423
be obtained in real time at the fingertips of growers through their portable electronic devices
424
(smartphones and tablet PCs). The latter will enhance crop management capabilities from major
425
industries, but more importantly by growers in developing countries.
426
427
Author Contributions: SF contributed the main idea using smartphone apps, satellite imagery and machine
428
learning to assess aroma profiles; SF and CGV contributed equally in the experimental design, data analysis and
429
paper writing; GC, DDT and AZ contributed in the data acquisition, data processing and paper writing.
430
Acknowledgements: The authors would like to acknowledge the support from Yan Diczbalis, Principal
431
Horticulturist from the Department of Agriculture and Fisheries, Queensland, Australia. Furthermore, the
432
authors acknowledge Dr Pangzhen Zhang for his support in the use of GC-MS in the chemistry laboratory of
433
The University of Melbourne, Australia
434
Funding: This research was partially funded by the Ecuadorian government through the academic-award
435
scholarships program granted to GC. This research was supported by the Digital Viticulture program funded
436
by the University of Melbourne’s Networked Society Institute, Australia.
437
Conflicts of Interest: The authors declare no conflict of interest.
438
References
440
1. Dand, R., 9-Cocoa bean processing and the manufacture of chocolate. The International
441
Cocoa Trade. 2011, Woodhead Publishing, Cambridge.
442
2. ICCO, Production of cocoa beans, in ICCO Quarterly Bulletin of Cocoa Statistics. 2017,
443
International Cocoa Organization.
444
3. Astika, I.W., et al., Determination of Cocoa Bean Quality with Image Processing and Artificial
445
Neural Network. 2010.
446
4. Beckett, S.T., M.S. Fowler, and G.R. Ziegler, Beckett's Industrial Chocolate Manufacture and
447
Use. 2017: John Wiley & Sons.
448
5. De Brito, E.S., et al., Effect of autoclaving cocoa nibs before roasting on the precursors of the
449
Maillard reaction and pyrazines. International journal of food science & technology, 2001.
450
36(6): p. 625-630.
451
6. Ilangantileke, S., T. Wahyudi, and M.G. Bailon, Assessment methodology to predict quality
452
of cocoa beans for export. Journal of food quality, 1991. 14(6): p. 481-496.
453
7. Afoakwa, E.O., et al., Flavor formation and character in cocoa and chocolate: a critical
454
review. Critical reviews in food science and nutrition, 2008. 48(9): p. 840-857.
455
8. Elwers, S., et al., Differences between the content of phenolic compounds in Criollo,
456
Forastero and Trinitario cocoa seed (Theobroma cacao L.). European Food Research and
457
Technology, 2009. 229(6): p. 937-948.
458
9. Hansen, C.E., et al., Comparison of enzyme activities involved in flavour precursor formation
459
in unfermented beans of different cocoa genotypes. Journal of the Science of Food and
460
Agriculture, 2000. 80(8): p. 1193-1198.
461
10. Saravia-Matus, S.L., A.G. Rodríguez, and J.A. Saravia, Determinants of certified organic cocoa
462
production: evidence from the province of Guayas, Ecuador. Organic Agriculture, 2019: p.
1-463
12.
464
11. Department of Agriculture and Fisheries, Growing cocoa, D.o.A.a. Fisheries, Editor. 2015,
465
Government of Queensland.
466
12. Trognitz, B., et al., Diversity of cacao trees in Waslala, Nicaragua: associations between
467
genotype spectra, product quality and yield potential. PLoS One, 2013. 8(1): p. e54079.
468
13. Smulders, M., et al., Identification of cocoa (Theobroma cacao L.) varieties with different
469
quality attributes and parentage analysis of their beans. IGENIC Newsletters, 2008. 12: p.
1-470
13.
471
14. Olujide, M. and S. Adeogun, Assessment of cocoa growers' farm management practices in
472
Ondo State, Nigeria. Spanish journal of agricultural research, 2006. 4(2): p. 173-179.
473
15. Daymond, A. and P. Hadley, Differential effects of temperature on fruit development and
474
bean quality of contrasting genotypes of cacao (Theobroma cacao). Annals of Applied
475
Biology, 2008. 153(2): p. 175-185.
476
16. Saunders, J.A., et al., Selection of international molecular standards for DNA fingerprinting
477
of Theobroma cacao. Theoretical and Applied Genetics, 2004. 110(1): p. 41-47.
478
17. De Bei, R., et al., VitiCanopy: A free computer App to estimate canopy vigor and porosity for
479
grapevine. Sensors, 2016. 16(4): p. 585.
480
18. Poblete-Echeverría, C., et al., Digital cover photography for estimating leaf area index (LAI)
481
in apple trees using a variable light extinction coefficient. Sensors, 2015. 15(2): p. 2860-2872.
19. Macfarlane, C., et al., Estimation of leaf area index in eucalypt forest using digital
483
photography. Agricultural and forest meteorology, 2007. 143(3-4): p. 176-188.
484
20. Fuentes, S., et al., An automated procedure for estimating the leaf area index (LAI) of
485
woodland ecosystems using digital imagery, MATLAB programming and its application to
486
an examination of the relationship between remotely sensed and field measurements of LAI.
487
Functional Plant Biology, 2008. 35(10): p. 1070-1079.
488
21. Yapp, J.H.H., A study into the potential for enhancing productivity in cocoa (Theobroma
489
cacao L.) through exploitation of physiological and genetic variation. 1992, University of
490
Reading.
491
22. Daymond, A., et al., Canopy characteristics of contrasting clones of cacao (Theobroma
492
cacao). Experimental Agriculture, 2002. 38(3): p. 359-367.
493
23. Baofeng, S., et al., Digital surface model applied to unmanned aerial vehicle based
494
photogrammetry to assess potential biotic or abiotic effects on grapevine canopies.
495
International Journal of Agricultural and Biological Engineering, 2016. 9(6): p. 119-130.
496
24. Xue, J., et al., Assessment of canopy vigor information from kiwifruit plants based on a digital
497
surface model from unmanned aerial vehicle imagery. International Journal of Agricultural
498
and Biological Engineering, 2019. 12(1): p. 165-171.
499
25. Biehl, B., et al., Chemical and physical changes in the pulp during ripening and post-harvest
500
storage of cocoa pods. Journal of the Science of Food and Agriculture, 1989. 48(2): p.
189-501
208.
502
26. Selamat, J. and S. Mordingah Harun, Formation of methyl pyrazine during cocoa bean
503
fermentation. Pertanika, 1994. 17: p. 27-27.
504
27. Rodriguez-Campos, J., et al., Effect of fermentation time and drying temperature on volatile
505
compounds in cocoa. Food Chemistry, 2012. 132(1): p. 277-288.
506
28. The Good Scents Company. The Good Scents Company Information System. 2018 [cited
507
2019 3 March]; Available from: http://www.thegoodscentscompany.com.
508
29. Ramos, C.L., et al., Impact of different cocoa hybrids (Theobroma cacao L.) and S. cerevisiae
509
UFLA CA11 inoculation on microbial communities and volatile compounds of cocoa
510
fermentation. 2014. 64: p. 908-918.
511
30. Owusu, M., M.A. Petersen, and H. Heimdal. Assessment of aroma of chocolate produced
512
from two Ghanaian cocoa fermentation types. in 12th International Weurman Flavour
513
Research Symposium. 2010.
514
31. Rodriguez-Campos, J., et al., Dynamics of volatile and non-volatile compounds in cocoa
515
(Theobroma cacao L.) during fermentation and drying processes using principal components
516
analysis. 2011. 44(1): p. 250-258.
517
32. Bonvehí, J.S.J.E.F.R. and Technology, Investigation of aromatic compounds in roasted cocoa
518
powder. 2005. 221(1-2): p. 19-29.
519
33. Bos, M.M., I. Steffan-Dewenter, and T. Tscharntke, Shade tree management affects fruit
520
abortion, insect pests and pathogens of cacao. Agriculture, ecosystems & environment,
521
2007. 120(2-4): p. 201-205.
522
34. Aprotosoaie, A.C., S.V. Luca, and A. Miron, Flavor chemistry of cocoa and cocoa products—
523
an overview. Comprehensive Reviews in Food Science and Food Safety, 2016. 15(1): p.
73-524
91.
35. Ramli, N., et al., Influence of roasting conditions on volatile flavor of roasted Malaysian
526
cocoa beans. Journal of Food Processing and Preservation, 2006. 30(3): p. 280-298.
527
36. Kongor, J.E., et al., Factors influencing quality variation in cocoa (Theobroma cacao) bean
528
flavour profile—a review. Food Research International, 2016. 82: p. 44-52.
529
37. Martínez-Lüscher, J., L. Brillante, and S.K. Kurtural, Flavonol profile is a reliable indicator to
530
assess canopy architecture and the exposure of red wine grapes to solar radiation. Frontiers
531
in plant science, 2019. 10.


![Figure 6. Original satellite image obtained from Google Maps Pro [A] and Mapping of effective leaf area index (LAIe) [B] and aroma profiles for Phenethyl acetate (Honey / floral / yeasty / cocoa) [C]; 2-Phenyl-2-butenal (Sweet / cocoa / nutty / beany) [D];](https://thumb-us.123doks.com/thumbv2/123dok_us/7865341.1304712/13.595.105.695.86.433/original-satellite-obtained-mapping-effective-profiles-phenethyl-butenal.webp)
![Figure 7. Original satellite image obtained from Google Map Pro [A] and plant by plant mapping of effective leaf area index (LAIe) [B] and aroma profiles for Phenethyl acetate (Honey / floral / yeasty / cocoa) [C]; 2-Phenyl-2-butenal (Sweet / cocoa / nutty](https://thumb-us.123doks.com/thumbv2/123dok_us/7865341.1304712/14.595.84.702.84.435/original-satellite-obtained-mapping-effective-profiles-phenethyl-acetate.webp)
