85
Diabetes prediction using multiple machine
learning Algorithm from the Peoples Data
of Rural Kodagu
Punith mandanna K N*, Dr. Sumitra binu
Department of Computer Science, Christ (Deemed to be University), Bengaluru - 560029, Karnataka, India.
Abstract: Diabetes is one of the best examples for a long life interminable non-transmittable chronic disease. According to the International Federation for Diabetes, around 425 million people around the sphere will contract diabetes and it is also said that by the end of 2036 the rate of diabetic people will be double in size. Diabetes is a kind of disease which occurs due to increase of glucose level in blood. There are many ways to find out diabetes in one’s blood by using either traditional ways or scientific ways. It is a toughest challenge for doctors to find the diabetic level in the initial stage. One of the conventional methods to find diabetes in its early stage is by applying machine learning. The main objective of this research is to find out the presents the results comparison of four managed supervised and unsupervised machine learning algorithms. It is done by combining all the results of different supervised machine and unsupervised machine learning methods called SVM. k-NN, Random forest, Naïve Bayes and , Binary logistic regression. The Research was carried out by using the collected data from coorg.
Keywords: Machine Learning, Supervised, K Nearest Neighbor, Random forest, Diabetes, Binary logistic regression.
Introduction: Diabetes is a life-threatening disease and people who undergo this disease will
face many changes in their life style. Diabetic people have a greater probability of being susceptible to Heart Attack, Blindness, Kidney Diseases [1] etc. If an individual sense some changes in his routine, it is good that he/ she visits nearby by hospital, do complete body scan and get the report to find out the stages of diabetes.
86
is been collected from 2017.Disclosure of the diabetes on numerous patients physically is excessively confused and it's repetitive and that additionally with various traits and parameters. So this work proposes the machine learning model display for training and testing process. To begin with, take the dataset and partition into two sections for preparing and testing. Part will be made with the order utilizing created limits on each characteristic. The classification will be shown in the graph.
Related work: This section discusses a few
works relevant to the chosen area of research.
Jayaram et al. [3] developed Type II Diabetes prediction using hybrid model. A hybrid model was developed to classify Pima Indian Diabetic
Database (PIDD). P PThe developed model
consists of two stages. In first stage, the K-means clustering is used to identify and to eliminate imperfect classified instances. In the second stage, a fine tune classification is done by using Decision tree C4.5 taking the accurately grouped example of first stage.
In order to organize diabetes data analysis and diabetes prediction model Khan et al. Used data mining techniques through Rapid Miner. A decision tree and ID3 algorithm are used for prediction with 72% and 80% of accuracy.
MA.Jayaram(2007)[4] for the first time uses applied rough sets on the PIMA. The first pre-processed the data and separate it by making
intervals of data He used the equal frequency
binning criteria for intervals and then he created reduces by using Johnson reducer algorithm and classified it by using the classifier called batch classifier with the standard tuned voting method (RSES). The rules were made for each of 10 randomizations of the PIDD training sets. The tests were later on classified as per the defaults of the naïve Bayes classifier.
Jaya Lakshmi et al. [5] developed a clustering algorithm which can be used for finding out diabetes based on graph b-coloring technique. Implementation and experiments can be done by comparing their approach by using K-NN classification and K-means clustering. The results came out shows that the clustering based on graph coloring is better than other clustering approaches in terms of accuracy and immaculateness. This technique gives a real representation of clusters by principal objects that assures the inter-cluster disparity in a partition, and it can be used to evaluate the quality of clusters.
Sadiyah [6] Type 2 Diabetes Mellitus (T2DM) should be directed towards individuals. Subsequently, they concentrated on building up an assessment model on diabetes and developed a diabetes risk score system based on cell phones.
Marcano-Cedeno~ [7] artificial metaplasticity which was proposed on multilayer perceptron (AMMLP) as a diabetes prediction model, for which the best outcome obtained was 89.93%. Every one of the examinations exhibited above utilized a similar Pima Indian Diabetes Dataset as the test material. The Waikato Environment for Knowledge Analysis (WEKA) tool was the common tool most researchers prefer..
NagannaChetty [8] proposed a hybrid
prediction model (HPM), utilizing K-means clustering algorithm directed towards validating a chosen class label of given data sets and also, C4.5 machine learning algorithm pointed at creating the final classifier model, with classification accuracy rate 92.38%.
87
techniques improved the accuracy and performance of the naive Bayes classifier and decision tree (DT), while support vector machine (SVM) accuracy were decreased.
C. Dalla Man [10] considered that anticipating T2DM should be coordinated towards people. In this manner, concentrated on establishing a diabetes hazard assessment model and developed a diabetes chance of score system based on cell phones.
R. Visentin [11] checked on the advantages of various preprocessing systems for anticipating DM. The preprocessing techniques were principal component analysis (PCA) and discretization. It reasoned that the preprocessing strategies improved the precision of the innocent Bayes classifier and choice tree (DT), while the help vector machine (SVM) exactness diminished.
A. Iyer, S. Jeyalatha [12] Decision Tree, Naive Bayes, and NBTree machine learning algorithms are used for the detection of liver disease consists of 10 features. The result analysis with respect to accuracy of NBTree algorithm has highest accuracy score and regarding computational time Naive Bayes algorithm performance is better.
Author proposed classification system in which the clustering technique i.e. KNN FFCM was integrated with KNN clustering and F-KNN was integrated with FCM clustering. It is well explained that with the Fuzzy KNN with Fuzzy c-means model the better results can be can be produced than comparing with the KNN with Fuzzy c-means model on data sets from PIMA
repository and Liver-disorder datasets also. It is also found and explained clearly that for preprocessing of datasets the use of Fuzzy c-means clustering algorithm gives more accurate results the result in terms of classification accuracy and speed by filtering the unwanted number of tuples from the original datasets. From examination, it is been found that KNN with Fuzzy cmeans has the accuracy of 97.02 and Fuzzy KNN with Fuzzy c-means has the accuracy of 99.25 on PIMA dataset and regarding Liver disorder KNN integrated with Fuzzy c-means have accuracy of 96.13 and Fuzzy KNN inetegarted with Fuzzy c-means with accuracy of 98.95.
Naik and L. Samant [13] Performed chronic disease prediction utilizing data mining approach's like Naïve Bayes, Binary logestic regression, Decision tree, Support Vector Machine (SVM) and for the analysis of diabetes and coronary illness. The analysis shows that SVM gives highest accuracy of 95.556% in case of coronary illness and Naïve bayes gives the accuracy of 73.588% in case of diabetes. Table I gives the comparative investigation of various existing data mining techniques for heart, liver and diabetes diseases.
88 MATERIALS AND METHODS
Materials:
• The data is collected through the house
to house survey with the help of World Health Organization STEP Surveillance (WHO STEPS) questionnaire [17] in this area. Sample for research study included only those people residing in
the Nalnad Napoklu area of Coorg for
the past 15 years and who are either
government employees, private
workers, planters, farmers or entrepreneurs.
• For collecting data ,visits were made to
individual houses and the data peratining to the particpants were entered willingly by them in the WHO questionnaire. Before sharing their data, participants were requested to sign the consent form to prove their willingness to participate in the study.
• If during the house visit the participants
were not available or if they refused to take part in the examination, they were considered to be non-responders. Research sample does not include pregnant women and people below 20 years.
Methods:
U
Study design
This study is a cross-sectional, community-based among adults whose age is 20 years or more and who are residents of Napoklu known as Kodavas, Kodagu district(Coorg), Karnataka
state, India. The, total study population accounts
to 3429 of which male population is 1649 and female population is 1740 according to the
census of 2016[18].
U
Study instrument
The data gathered using the WHO STEP
Surveillance (STEPS) questionnaire was used with minor modifications.
The survey questionnaire was created in
the English language kannada and Kodava (local language) to the participants.
The questionnaire was designed to
gather information like socio demography attributes, medically related inquiries, measurements and behavioural data on smoke and alcohol use, fruit and vegetable intake, physical
activity(exercise), pork consumption(non veg), family history
of diabetes conditions, health examination and physical measurements such as height, weight, blood pressure and waist circumference.
Biochemical tests conducted to measure
fasting blood glucose were collected in WHO STEPS strategy. During the collection of information through WHO STEPS questionnaire, the eligible residents were wholly informed
concerning the reason for the
examination so that the participants trust and confidently gave their details for the study.
During the accumulation of data through
WHO STEPS questionnaire, the qualified occupants were totally educated as for the explanation behind the examination with the goal that the members trust and certainly gave their subtleties for our investigation.
Measure:
• The consumption of non veg, alcohal
89
• About the physical activity information,
which is based on the time spent on exercise or work done in estates, in house hold work time or any other work time of 30 minutes daily then the person considered to be active.
• If the subject’s family members like an
aunt, uncle, parents, brother, sister, grandparents or first cousin has diabetes then the subject is considered to have a
positive family history of diabetes. .
• The blood glucose was measured using
the blood glucose measurement device (Freestyle Optimum H Glucometer). Diabetic participants were ignored in this test and considered as positive. Blood pressure had to be measured in a sitting position with the help of the standard measuring instrument. Blood pressure was measured twice within a time interval of five minutes and the mean of both the measurements were taken into consideration for the study.
• Wellbeing examination which is
recorded based on the health check-up related to glucose, BP and others for past one year.
• Height was verified using the measuring
tape in centimeters and weight was measured using the standard digital weighing scale, and the weight value was recorded in kilograms.
• Waist circumference is measured using
the non-stretchable measuring tape; the value is recorded in centimeters. Body mass index (BMI) was calculated using
the formula, weight (kg) / height (mP
2
P
). Participants are considered to be obese if BMI ≥ 25 kg/m2, overweight if BMI ≥ 23 kg/m2 and have abdominal obesity when waist circumference is ≥ 90 cm in
males circumference is and ≥ 80 cm in
females.
• Education of the participants are
recorded based on their qualification (Undergraduate, Postgraduate, 12th,
10th), and age is verified using the date
of birth of the participants.
• After the complete Health examination
process, an overview of the diabetes disease, complications, symptoms and participants have conveyed their treatment process.
• After receiving information about the
study aims and methods,participants signed a written informed consent.
There exist many machine learning concepts which in turn became the fastest growing field among many concepts. In this, system used the most commonly used techniques called supervised and unsupervised learning algorithms in order to detect or predicts the occurrence of
diabetes among the coorg peopleS..
Proposed System
The collected data are pre-processed and cleaned using the standard pre-processing techniques and methods. The classification process is done by using the multiple Machine learning algorithm. The points like Accuracy, recall, precision and error rate were noted and cross verified to find the better algorithm. After the classifications our system also predicts the values like major contributor along with the accuracy score. We have run the different machine algorithms on our data set to identify the best suitable and find the more accurate machine learning technique for our live Data set.
Machine Learning (ML):
90
computational techniques are set to some restrictive rules which is used by computers to calculate and to solve the problems.
In machine learning approaches, Computers/ machines are set to train the data by using some statistical analysis to generate the values in such a way that it fits for particular range. This process helps Machine Learning to direct the system and build new models from sample data in order to get expected output.
There exist many machine learning concepts which in turn became the fastest growing field among many concepts. In this, system used the most commonly used techniques called supervised and unsupervised learning algorithms in order to detect or predicts the occurrence of diabetes among the coorg people.
Naïve Bayes
Naïve Bayes [19] is a kind of technique where classifiers are constructed. These also assign class labels to all problem instances, vectors are represented to feature values,etc. All classifiers under Naïve Bayes assumes that all feature in particular system is independent of any other feature in some other system. The main advantage of this Nave Bayes Technique is that it only requires very small number of training data in estimation of Parameters. The below value resembles the accuracy of the data on the training and test data sets. The given data set will be automatically divided into training data set and Test data set.
Training Data = Accuracy :
Confusion matri x
0.5729 A=[50 35]
0.5455 B=[40 40]
Random forest
Random forest [20] Algorithm is a method of regression, classification and other tasks that works by building a huge decision tree. Random forest assembles multiple decision trees and combines them together to get a more precise and stable forecast. Basically it is a supervised classification Algorithm which constructs forest with high number of trees. Higher the number of
trees in forest gives higher the accuracy.
Train data = Accuracy
Confusion matrix
0.9766 A=(56 29)
0.7455 B=(13 67)
Figure.1 explains the correlation between the Attributes.
Logistic Regression
91
logistic regression algorithm is binary-classification. It means that the logistic regression algorithm is always used to solve two-category problem. The fundamental reason for our test is to anticipate whether one individual is diabetic or not, which is constantly utilized to take care of two-class issue. Plus, the logistic regression algorithm is always utilized in data mining technique, programmed determination and financial expectation, particularly anticipating and characterizing of restorative and medical issue. Taking everything into account, we chose to utilize the strategic relapse as one piece of our proposed model.
Evaluation of Computational Results:
The precision of a learning Methods should be evaluated before it can end up helpful. Constrained accessibility of Datasets regularly makes evaluating exactness a troublesome undertaking. Picking a decent evaluation approach is vital for Machine learning Algorithms improvement. In the holdout technique, datasets are partitioned into a training set and a testing set. Generally 2/3 of the Data sets are allotted to the training set and 1/3 to the testing set.
After the Machine learning Algorithm is trained by the preparation set data, results for the each occurrence of the data will be predicted. These qualities are then contrasted with the genuine yield esteems with decide accuracy. The system is trained and tested for roughly selected iterations. During each iteration other subsets of data are used as training data and the remaining set is used as testing data. In the cycle, each sub-set of data fills in as the testing sub-set in exactly each iteration.
We have experimented with our collected dataset on the algorithms like SVM, K-NN, Random forest and BLR in a lowest processing time A distinguished confusion matrix was obtained to calculate sensitivity, specificity and
accuracy. Confusion matrix is a matrix representation of the classification results (table 2)
Table.1 confusion matrix
The confusion matrix supports in analysing the performance standard for the classifiers in disease detection accuracy, precision, recall already been calculated for all datasets (Table 1).
Accuracy are the prediction percentages that are correct.
Precision the proportion of exactness given that a particular class has been predicted.
Recall is percentage of positive marked cases that were anticipated as positive
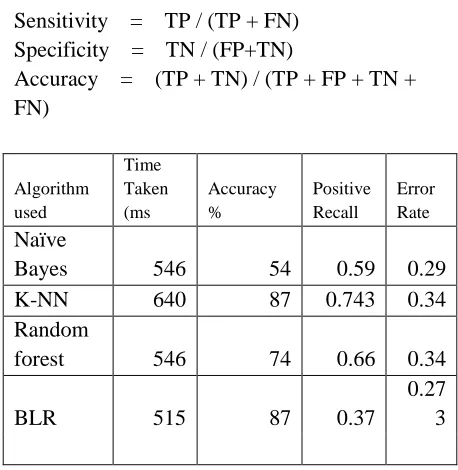
Sensitivity = TP / (TP + FN) Specificity = TN / (FP+TN)
Accuracy = (TP + TN) / (TP + FP + TN + FN)
Algorithm used
Time Taken (ms
Accuracy %
Positive Recall
Error Rate
Naïve
Bayes 546 54 0.59 0.29
K-NN 640 87 0.743 0.34
Random
forest 546 74 0.66 0.34
BLR 515 87 0.37
0.27 3
92 Results:
In this paper five classification techniques (Naïve Bayes,K-NN, Random forest, Binary logistic regression) are used to predict the diabetes in a p vatients data. In our investigation the initial five methods were first separated by utilizing the execution time in which BLR has the most minimal computing time with 89% exactness and error rate of 0.273. The second comparison was done on the accuracy rate, Naïve Bayes has the best result when compared with other techniques. BLR has improved accuracy and error rate when compared with the other machine learning techniques.
Conclusion:
The entire work is based on the data set of Coorg people and apply different machine learning techniqueue on the data to find the suitable ones. The future enhancement would be on the basis of in depth methods modern techniques and huge data set. The current house to house survey study reflects the importance of diabetes disease among the study population in rural Kodagu, India and it’s an alarm for the government, private employees and people in business to stay away from the diabetes disease. The primary objective of medical data mining calculations is to get best algorithms that portray the given data from different viewpoints. In light of some of researchers' experiences, we proposed a Random forest, which consists of two-level algorithms, i.e., the improved K-means, Naïve Bayes and logistic regression algorithms. So as to make a significant relationship with others results and others outcomes, it was important to lead this model utilizing the equivalent Kodagu Diabetes Dataset. In investigation the initial five methods were first separated by utilizing the execution time in which BLR has the most minimal
computing time with 75% exactness and error rate of 0.26.To improve the validity and rationality of the dataset Proper filters were utilized. The proposed model that comprised of both cluster and class method guaranteed the improvement of prediction accuracy.
References:
[1] American Diabetes Association, corp-author. Diagnosis and classification of diabetes
mellitus. 38TDiabetes Care. 38T2009;39T3239T(Suppl 1):S62–
S69. doi: 10.2337/dc09-S062.
[2] K Saxena1, Dr Z Khan2, S Singh3," Diagnosis of Diabetes Mellitus using K Nearest Neighbor Algorithm", at Invertis University.
[3] Asha Gowda Karegowda, M.A. Jayaram, A.S. Manjunath (2012) ‘Cascading K-means Clustering and K-Nearest Neighbor Classifier for Categorization of Diabetic Patients’ IJEAT Vol.1 No.3 pp 147-151.
[4] Asha Gowda Karegowda,
MA.Jayaram(2007) ‘ Integrating Decision Tree and ANN for Categorization of Diabetics Data' International Conference on Computer Aided Engineering, December 13-15, IIT Madras, Chennai, India.
[5] T.Jayalakshmi and Dr.A.Santhakumaran, “A Novel Classification Method for Diagnosis of Diabetes Mellitus Using Artificial Neural Networks”, International Conference on Data Storage and Data Engineering, 2010, pp. 159-163.
93
[7] Marcano-Cedeno Alexis, Torres Joaquín, Andina Diego. A prediction model to ~ diabetes using artificial metaplasticity. IWINAC 2011, Part II. LNCS 6687; 2011. p. 418–25.
[8] Naganna Chetty, Kunwar Singh Vaisla, Nagamma Patil, “An Improved Method for Disease Prediction using Fuzzy Approach”, International Conference on Advances in Computing and Communication Engineering, IEEE, pp. 568-572, 2015.
[9] Kumari Deepika and Dr. S. Seema, “Predictive Analytics to Prevent and Control Chronic Diseases”, International Conference on Applied and Theoretical Computing and Communication Technology, IEEE, pp. 381-386, 2016.
[10] C. Dalla Man, F. Micheletto, D. Lv, M. Breton, B. Kovatchev, and C. Cobelli, “The UVA/PADOVA Type 1 Diabetes Simulator: New Features,” Journal of Diabetes Science and Technology, vol. 8, no. 1, pp. 26–34, 2014.
[11] R. Visentin, C. Dalla Man, Y. C. Kudva, A. Basu, and C. Cobelli, “Circadian variability of insulin sensitivity: Physiological input for in silico artificial pancreas,” Diabetes Technology & Therapeutics, vol. 17, no. 1, pp. 1–7, 2015
[12] A. Iyer, S. Jeyalatha and R. Sumbaly, “Diagnosis of Diabetes using Classification Mining Techniques”, IJDKP, Vol. 5, pp. 1-14, 2015.
[13] A. Naik and L. Samant, “Correlation Review of Classification Algorithm using Data Mining Tool: WEKA, Rapidminer , Tanagra ,Orange and Knime”, ELSEVIER, Vol. 85, pp. 662-668, 2016.
[14] Uma Ojha and Savita Goel, “A study on prediction of breast cancer recurrence using data mining techniques”, International Conference on Cloud Computing, Data Science & Engineering, IEEE, 2017.
[15] L.Wang, L.Khan and B.Thuraisingham, "An Effective Evidence Theory based on Nearest Neighbor (KNN) classification", IEEE International Conference, 2008.
[16] C. M. Florkowski, “Sensitivity, specificity, receiver-operating characteristic (ROC) curves and likelihood ratios: Communicating the performance of diagnostic tests,” Diabetes Care, vol. 29, no. 1, pp. 83–87, 2008
[17]
http://www.who.int/chp/steps/STEPS_Instrumen t_v2.1.pdf .
[18] 31TUhttp://www.census2011.co.in/data/village/6
17851-napoklu-karnataka.htmlU31T.
[19] 31TUhttps://en.wikipedia.org/wiki/Naive_Bayes_
classifierU31T
[20] 31TUhttps://en.wikipedia.org/wiki/Random_fores
tU31T