Cite this article as:
Debnath, A.K., and Haworth, N. (2016) Learning from Insurance Data: Injuries to Other Road Users in Motorcyclist-at-Fault Crashes. Transportation Research Record 2587,pp. 1-7. doi: http://dx.doi.org/10.3141/2587-01
LEARNING FROM INSURANCE DATA: INJURIES TO OTHER ROAD USERS IN MOTORCYCLIST AT-FAULT CRASHES
Ashim Kumar Debnath *
Post-doctoral Research Fellow
Queensland University of Technology (QUT)
Centre for Accident Research and Road Safety – Queensland
K Block, 130 Victoria Park Rd, Kelvin Grove, QLD 4059, Australia Tel: +61731388423, Fax: +61731380111
Email: ashim.debnath@qut.edu.au
Narelle Haworth
Professor
Queensland University of Technology (QUT)
Centre for Accident Research and Road Safety – Queensland
K Block, 130 Victoria Park Rd, Kelvin Grove, QLD 4059, Australia Tel: +61731388417, Fax: +61731380111
Email: n.haworth@qut.edu.au
ABSTRACT
In multi-vehicle motorcycle crashes, the motorcycle rider is less likely to be at-fault but more commonly severely injured than the other road user. Therefore, not surprisingly, crashes in which motorcycle riders are at-fault and particularly the injuries to the other road users in these crashes have received little research attention. This paper aims to address this gap in the literature by investigating the factors influencing the severity of injury to other road users in motorcyclist-at-fault crashes. Five years of data from Queensland, Australia, were obtained from a database of claims against the compulsory third party (CTP) injury insurance of the at-fault motorcyclists. Analysis of the data using an ordered probit model shows higher injury severity for crashes involving young (under 25) and older (60+) at-fault motorcyclists. Among the not at-fault road users, the young, old, and males were found to be more severely injured than others. Injuries to vehicle occupants were less severe than those to pillions. Crashes that occurred between vehicles traveling in opposite directions resulted in more severe injuries than those involving vehicles traveling in the same direction. While most existing studies have analyzed police reported crash data, this study used CTP insurance data. Comparison of results indicates the potential of using CTP insurance data as an alternative to police reported crash data for gaining a better understanding of risk factors for motorcycle crashes and injury severity.
INTRODUCTION
The vulnerability of motorcycle riders in sustaining injuries from traffic crashes has attracted significant attention from researchers across the world (1). Most studies analyzed the
maximum severity sustained by a road user in a multi-vehicle motorcycle crash as the overall injury outcome of the crash. Some recent studies have expanded their focus to analysis of the injuries sustained by all road users involved in crashes, and to examination of injury severity outcomes by accounting for the at-fault status of involved parties. However, none have specifically examined the injury severities in motorcycle-involved crashes by accounting for the at-fault status of the motorcyclists. A brief review of the relevant literature is presented in the subsequent paragraphs.
Both in terms of using a wide range of statistical models and how the injury severity was defined as response variable in the models, the maximum severity of all road users involved in multi-vehicle motorcycle crashes has received the most attention from
researchers. Pai (2) analyzed the injury severity of motorcyclists and pillions resulting from motorcycle-car angle crashes at T junction as a dichotomous variable (killed and seriously injured, slight injury) in a binary logistic model. The injury severity was treated as ordered categories by some researchers (3, 4). Quddus et al. (3) used ordered probit models to analyze the injury severity and motorcycle damage resulting from motorcycle crashes in Singapore. The logit variation of the ordered model, a heterogeneous choice model, and a partially constrained generalized logit model were used in a Calgary study (4). The approach of modeling injury severity in ordered categories was criticized for the proportional odds assumption by some researchers (5, 6) who modeled each severity outcome as a different function in multinomial logit models. A generalized version of the multinomial logit model (mixed logit) was used Shaheed et al. (1) to analyze injury severity of crashes involving a motorcycle and another vehicle in Iowa, USA. A detailed discussion on the methodological limitations and strengths of the ordered and multinomial models can be found in (7).
While the above studies used the maximum severity of all road users involved in motorcycle crashes as the response variable in regression models, Chiou et al. (8) have expanded their focus to analyze the injury severities sustained by multiple parties involved in crashes. They simultaneously modeled injury severity of both parties in two vehicle crashes occurring at signalized intersections in Taipei City by using a bivariate generalized ordered probit model. The scope of the study included the injuries sustained by drivers and riders, but not the injuries sustained by passengers. Injury severity of the drivers of non-motorcycle vehicles decreased in motorcycle-involved crashes where the motorcycle rider was less responsible (commonly known as ‘not at-fault’ in traffic safety literature) for the crash than the other party.
Researchers (9) have argued that the injury severity patterns and their risk factors could vary by the at-fault status of involved parties. Abdel-Aty (10) found that not at-fault drivers in signalized intersection crashes are more likely to be injured than at-fault drivers. In a recent study of two vehicle angle type crashes in the state of Michigan, USA, Russo et al. (9) examined the risk factors for injury severity by considering the fault status of
crash-involved drivers. They found larger variability in the model parameters for not at-fault drivers than for at-fault drivers, which suggested greater heterogeneity among the injury severities of the not at-fault drivers. They argued the need for future research in this important area
two-unit crashes in Queensland, Australia (11) and in 30% of the two-unit crashes in Ohio, USA (12). Second, the severity of injury to the motorcycle rider is likely to be greater than the injury to the other road users involved in crashes (8). Therefore, not surprisingly, crashes in which motorcyclists are at-fault and particularly the injuries sustained by other road users in these crashes have received little research attention.
This paper aims to fill this important gap in literature by examining the risk factors for the injury severity of not-fault road users involved in crashes where a motorcyclist was at-fault using data from insurance claims. Almost all previous studies that examined the injury severity of motorcycle crashes have used police reported crash data and relatively few have used insurance claims data. The insurance data might have more accurate measures of injury severity than the police reported data, as processing of insurance claims require thorough investigation of the crash and follow up on the injury of the claimant. In addition, the insurance dataset would have information available from the more recent periods than the police reported dataset. These benefits of insurance data make the injury severity analysis presented in this paper interesting and mark a significant contribution to the motorcycle safety literature.
STUDY SETTING AND DATA
This research was conducted in the State of Queensland, Australia. Queensland has 4.3 million inhabitants and a climate that varies from sub-tropical to tropical, allowing year-round motorcycle riding. There were 186,440 motorcycles registered in Queensland at 30 June 2014, comprising 3.9% of all registered vehicles (13). Most urban roads have signed 60 km/h speed limits and vehicles drive on the left side of the road.
The data analyzed in this study were obtained from an insurance claims dataset supplied by the Queensland Government regulatory body of Compulsory Third Party (CTP) insurance. The dataset contains claims made by road users involved in crashes, where a motorcyclist is at fault, against the CTP insurance policy of the at-fault motorcyclist. The data covered crashes occurring between January 2009 and October 2013. It is to be noted that the CTP scheme covers personal injury only (i.e., not damage to vehicle or property). Therefore, the crash dataset did not have information about any Property Damage Only (PDO) type crashes. Furthermore, all road users except the at-fault motorcyclists are eligible to make claims against the CTP insurance of the at-fault motorcyclists. Therefore, the dataset has claims from road users other than the fault motorcyclist. However, the pillions of the at-fault motorcycles or passengers of at-at-fault scooters (collectively referred to as ‘pillions’ hereafter) can make claims against the CTP insurances of the at-fault riders. It is to be noted that crash must be reported to police before a claim could be submitted.
The dataset comprised 375 claims made against the CTP insurance of the at-fault motorcyclists. Among these claims, the injury severity levels of 19 claims were not coded in the dataset. By removing these observations, a total of 356 claims remained in the analysis dataset. These claims were generated from 298 crashes. Among the 356 claims, 262 (87.9%) arose from crashes that generated a single claim. The remaining 94 claims arose from 36 (12.1%) crashes that generated multiple claims per crash. Among the 36 multi-claim crashes, 22 crashes generated 2 claims each, 6 crashes generated 3 claims each, 3 crashes generated 4 claims each, 2 crashes generated 5 claims each, 1 crash generated 6 claims, and 2 crashes generated 7 claims each. It is to be noted that 8 of these 36 multi-claim crashes had observations (n=10) for which severity levels were not coded in the dataset.
were 65 claims for crashes resulting in serious injury, but the remaining severity levels had relatively small number of observations in the dataset (severe: 8, critical: 1, and maximum: 13).
ANALYSIS METHOD
The severity categories were grouped into three categories (Minor, Moderate, and Serious and above) to allow for a sound statistical analysis because of the low number of observations in the higher severity categories. These categories of injury severity levels are ordered in nature. For modeling such ordered variables, many researchers (e.g., 3, 4, 15) chose to use ordered probit or logit models. Rifaat et al. (4) reported from a comparative study on the use of ordered, heterogeneous choice, and partially constrained generalized models that all models yielded very similar results on the estimated coefficients of the models and their statistical significance. Even though the ordered model is subject to violation of the equal variance and proportional odds assumptions (see 7 for a detailed discussion on this issues), Rifaat et al. (4) showed that the ordered model is fairly robust to the violation of these assumptions. To model data of small sample size like the observations in this study, simpler models are preferred because these models require less data in general to derive reasonable estimation results (7).
An Ordered model defines an unobserved variable (z) for modeling the ordinal ranking of the data as a linear function 𝑧=𝛃𝛃+𝜀, where X is a vector of explanatory variables, 𝛽 is a vector of estimable model parameters, and 𝜀 is a disturbance term. If 𝜀 are assumed to be normally distributed with zero mean and unit variance, the model is called an Ordered Probit Model. The unobserved variable is mapped on to an observed variable (y) as 𝑦= 1 𝑖𝑖 𝑧 ≤ 𝜏1 (Minor), 𝑦= 2 𝑖𝑖 𝜏1 <𝑧 ≤ 𝜏1 (Moderate), and 𝑦 = 3 𝑖𝑖 𝑧> 𝜏2 (Serious and above). The 𝜏1 and 𝜏2 are parameters (often referred as cut-off points) estimated jointly with the model parameters 𝛃. Interested readers are referred to (7) for a detailed description of the model.
Since the multi-claim crashes (n=36) involved multiple individuals injured in the same crash, the injury severities of all individuals in the same crash may be correlated. This is because the unobserved characteristics of a specific crash (e.g., impact characteristics) are similar for the injury severity observations. This potential within-crash correlation needs to be accounted for in modeling injury severities of multiple individuals involved in same crash (see 7 for a detailed discussion on this issue). However, the dataset used in this study is mixed in nature—it contains both single injury and multiple injury in a particular crash—with a small share of multi-injury crashes (n=36, 12.1% of all crashes). Because of the low share of multi-injury crashes in the analysis dataset, the potential within crash correlations were not modeled in this study.
A set of explanatory variables (Table 2) which are hypothesized to be associated with the injury severity levels was included in the model. These variables describe different characteristics of the motorcycles, at-fault motorcyclists, not-at-fault claimants, and crashes. Characteristics of the motorcycles were captured in three variables: cylinder capacity
also included in the model. The ‘other’ category of road users (n=14) includes family
members who were not involved in the crash but suffered loss as a result of a family member being injured/killed (n=9) and a bystander who suffered mental trauma as a result of
witnessing the crash (n=5). The characteristics of crashes were expressed using three variables: type of area where crash occurred (urban/rural), year of crash (categorized), and type of crash (categorized).
RESULTS AND DISCUSSION
Descriptive Statistics
As presented in Table 2, among the two-wheelers ridden by the at-fault motorcyclists, most (94.7%) were motorcycles and only 5.3% were moped or scooter. About 84% of these two-wheelers had engine capacity more than or equal to 260cc. About half of the two-two-wheelers were 3-8 years old, whereas 5.6% were quite new (less than 3 years old) and 8.1% were relatively old (more than 23 years old).
About 10-14% of the both at-fault and not-at-fault road users were either young (aged less than 25 years) or old (aged more than or equal to 60 years). Only 6.7% of the at-fault motorcyclists were female, whereas 51.7% were female in the not-at-fault group. The age and gender of at-fault road users were unknown in about 12% observations. In contrast, the age and gender of all not-at-fault claimants were known. Most of the not-at-fault claimants were vulnerable road users (motorcycle rider: 32.0%, pillion: 34.0%, pedestrian: 6.7%; and bicyclist: 2.0%) and 21.1% were vehicle occupants.
Almost half of the crashes occurred in rural and urban areas, respectively. No clear trend was observed for the proportions of crashes that occurred in each year. Note than the values for the year 2013 includes crashes which occurred until October only.
The most common type of crash involved a vehicle being out of control (28.4%), followed by crashes between vehicles traveling in the same direction (23.6%), and crashes between vehicles traveling in the opposite direction (17.4%). Surprisingly, only 5.6% of the crashes involved vehicles from adjacent approaches at intersections.
Model Estimates
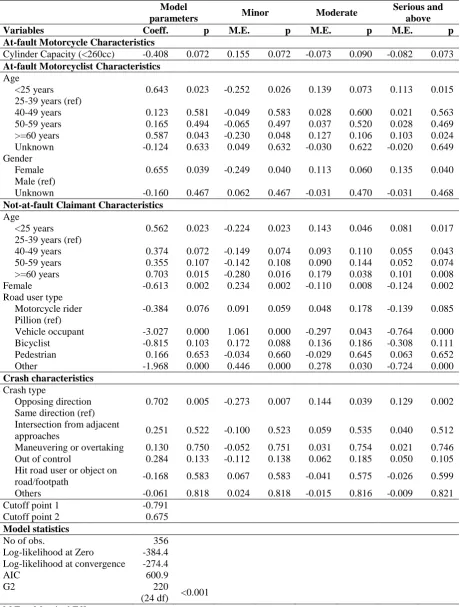
The estimated model parameters, their statistical significance, and the marginal effects of the explanatory variables are presented in Table 3. The marginal effects represent the effect of change in a certain explanatory variable on the probability of an injury severity category. For binary explanatory variables, the effects were computed for a change from 0 to 1 in the binary variable of interest while keeping all other variables at their means. In the case of variables with more than two categories, the effects were computed on the basis of category change from 0 to 1, whereas the other categories of the variable were kept at 0 and all other variables at their means. The most parsimonious model, obtained through a backward elimination procedure by deleting the non-significant variables one by one so that the AIC is minimized, yielded a likelihood ratio statistic of 220 (24 df) which was well above the critical value for significance at the 99% confidence level. Statistical significance of the explanatory variables was considered at 90% confidence level, as discussed in the subsequent paragraphs.
Turning to the specific estimation results, relative to higher engine capacity
The injury to other road users was more likely to be serious (11.3% higher
probability) and moderate (13.9% higher probability) if the at-fault motorcyclist was young (aged less than 25 years) compared to an at-fault motorcyclist aged 25-39 years, but was less likely to be minor (25.2% less probability). While the results for the other middle aged categories (40-59 years old) were not statistically significant, the results for the older motorcyclists (aged 60 years or more) followed the same trend of the young motorcyclists with 10.3% higher probability of serious injury and 23% lower probability of minor injury.
Compared to crashes where the at-fault motorcyclist was a male, the crashes involving a female at-fault motorcyclist had 13.5% higher probability of serious injury sustained by the not-at-fault claimants. The corresponding probabilities for moderate and minor injury were 11.3% higher and 24.9% lower respectively. Female riders are likely to be less experienced in riding than male riders which might be a possible explanation of the differences in the injury outcomes.
While female at-fault riders were more likely to cause higher severity injuries to not-at-fault claimants than the male not-at-fault riders, the female not-not-at-fault claimants were less likely to sustain higher severity injuries than the male not-at-fault claimants. Compared to male not-at-fault claimants, females had 12.4% lower probability of being seriously injured, 11% lower probability of sustaining moderate injury, and 23.4% higher probability of minor injury. While some studies (8, 10) found higher risks of injuries and fatalities for males than females, the opposite was found in other studies (9). These conflicting findings suggest that the effect of gender on injury severity warrants further research.
The level of injury sustained by young (aged less than 25 years) not-at-fault claimants was 8.1% and 14.3% more likely to be serious and moderate respectively compared to those aged 25-39 years, but was 22.4% less likely to be minor. A similar trend was observed for older not-at-fault claimants (aged 60 years or more). While the finding for older road users is in agreement with the findings from other studies (e.g., 8, 9), the finding for the young group warrants further investigation as it contradicts with the findings from other studies (e.g., 6, 9). While Russo et al. (9) found younger drivers less likely to be injured, they also noted
significant variability in the injury outcomes of this road user group. Shaheed and Gkritza (6) reported from analysis of single motorcycle crash severities that riders younger than 25 years old were less likely to be severely injured than other riders. Among the other middle aged groups, the results for the 40-49 years old road users were statistically significant (5.5% higher probability of serious injury, and 14.9% lower probability of minor injury).
Not-at-fault motorcycle riders were less likely to be seriously injured (13.9% lower probability) and more likely to sustain minor injury (9.1% higher probability) compared to pillions of the not-at-fault two-wheelers. While studies (e.g., 12) noted that the overall severity of crashes tend to be less severe when riding with pillions in motorcycles, this finding that pillions are more likely to sustain severe injuries than motorcycle riders is
particularly interesting. A possible explanation of the finding is that the pillions might remain less aware of the potential crash situations than the riders because of not being at the control of the motorcycle, and thus remaining less prepared to take actions to avoid injuries when a crash occurs. Another possible explanation is that wearing less protective clothing by pillions than riders (17) might make the pillions more vulnerable to serious injuries in crashes.
Vehicle occupants were found to be less likely to sustain serious (76.4% lower
injury. This category includes family members who were not involved in the crash but suffered loss as a result of a family member being injured/killed and a bystander who
suffered mental trauma as a result of witnessing the crash. Therefore, it was expected that the probabilities of low severity injuries would be higher for this group.
Among the crash characteristics variables, only the crash type variable was retained in the most-parsimonious model. Results showed that crashes that involved vehicles from the opposite directions were more likely to produce serious (12.9% higher probability) and moderate injuries (14.4% higher probability), and were less likely to produce minor injury (27.3% lower probability), when compared with the crashes that involved vehicles traveling to the same direction. The finding was expected since motorcycle crashes involving vehicles from the opposite directions are more common than the same-direction crashes (18) and higher relative speeds in crashes involving vehicles from the opposite directions would result in more serious injuries.
Discussion
The foregoing showed that the results obtained from the insurance claims data analysis are plausible and consistent with existing studies that analyzed police-reported crash data, thus suggesting that the insurance data could be a good alternative of police-reported data in motorcycle safety research. It is, however, to be noted that variables related to roadway geometry and traffic related factors (e.g., speed limit, road width, median width, lighting, AADT) and crash-specific factors (other than the type of crash) were not possible to include in the analysis, because of unavailability of such information in the insurance dataset. These variables are generally available in police reported crash datasets. Unavailability of these variables in the insurance dataset is a key limitation in using insurance data for modeling injury severity.
The police-reported data, on the other hand, has its own limitations. For example, availability of the police-reported data in many jurisdictions often has a significant time-lag. In the case of the study location at the time of writing this paper (May 2015), the police reported crash data complete for all severity levels (minor, medical treatment, hospitalization, fatal) were available until June 2012. The fatal and hospitalization crashes were available until December 2014 and December 2013 respectively. Limited data for all severity levels (with information related to time, road user type, gender, and age) were available until October 2014. It is to be noted that PDO type crashes are no longer recorded in the database since December 2010. As the data availability shows, a major drawback of using the police-reported crash data is that data for the recent time periods (particularly for the low severity crashes) cannot be included in the analyses. On the other hand, the insurance data for the recent periods could be included in the analyses. For example, complete data until October 2013 was available at the time when this data was supplied for analysis in March 2014. It is important to note that the insurance data uses the AIS system to classify injury severity levels which provides greater level of details on the severity levels than other injury severity
CONCLUSIONS
This paper analyzed the severity of injury to other road users involved in motorcyclist-at-fault crashes by using insurance claims data. The young, old, and male not-at-fault road users were found to be more seriously injured than the middle-aged and females. Vehicle occupants and motorcycle riders suffered less serious injuries than the pillions. Among the at-fault
motorcyclists, the young, old, and females were more involved in crashes causing serious injuries to the not-at-fault road users than the middle-aged and males. Higher injury severities were also observed for crashes involving vehicles from opposite direction than those
involving vehicles traveling to the same direction. These findings were consistent with those obtained from analysis of police-reported crash data, thus suggesting that the insurance and police-reported data complement each other meaningfully. Linking the two databases could produce better data quality. The findings of this research add to the limited available
knowledge on understanding injury severities of motorcycle-involved crashes by accounting for the potential effects of the at-fault status. Use of insurance claims data, which typically has information from the more recent periods than the police-reported crash data, is another important contribution of the paper.
ACKNOWLEDGEMENT
The authors are grateful to Motor Accident Insurance Commission (MAIC) for supplying the data analyzed in this study. The comments expressed in this paper are those of the authors and do not necessarily represent the policies of MAIC or any other organizations mentioned in the paper.
REFERENCES
1. Shaheed, M. S. B., K. Gkritza, W. Zhang, and Z. Hans. A Mixed Logit Analysis of Two-Vehicle Crash Severities Involving a Motorcycle. Accident Analysis & Prevention, Vol. 61, No. 0, 2013, pp. 119-128.
2. Pai, C.-W. Motorcyclist Injury Severity in Angle Crashes at T-Junctions: Identifying Significant Factors and Analysing What Made Motorists Fail to Yield to Motorcycles.
Safety Science, Vol. 47, No. 8, 2009, pp. 1097-1106.
3. Quddus, M. A., R. B. Noland, and H. C. Chin. An Analysis of Motorcycle Injury and Vehicle Damage Severity Using Ordered Probit Models. Journal of Safety Research, Vol. 33, No. 4, 2002, pp. 445-462.
4. Rifaat, S. M., R. Tay, and A. de Barros. Severity of Motorcycle Crashes in Calgary.
Accident Analysis & Prevention, Vol. 49, No. 0, 2012, pp. 44-49.
5. Jung, S., Q. Xiao, and Y. Yoon. Evaluation of Motorcycle Safety Strategies Using the Severity of Injuries. Accident Analysis & Prevention, Vol. 59, No. 0, 2013, pp. 357-364.
6. Shaheed, M. S., and K. Gkritza. A Latent Class Analysis of Single-Vehicle
Motorcycle Crash Severity Outcomes. Analytic Methods in Accident Research, Vol. 2, No. 0, 2014, pp. 30-38.
7. Savolainen, P. T., F. L. Mannering, D. Lord, and M. A. Quddus. The Statistical Analysis of Highway Crash-Injury Severities: A Review and Assessment of
Methodological Alternatives. Accident Analysis & Prevention, Vol. 43, No. 5, 2011, pp. 1666-1676.
8. Chiou, Y.-C., C.-C. Hwang, C.-C. Chang, and C. Fu. Reprint of “Modeling Two-Vehicle Crash Severity by a Bivariate Generalized Ordered Probit Approach”.
9. Russo, B. J., P. T. Savolainen, W. H. Schneider Iv, and P. C. Anastasopoulos. Comparison of Factors Affecting Injury Severity in Angle Collisions by Fault Status Using a Random Parameters Bivariate Ordered Probit Model. Analytic Methods in Accident Research, Vol. 2, No. 0, 2014, pp. 21-29.
10. Abdel-Aty, M. Analysis of Driver Injury Severity Levels at Multiple Locations Using Ordered Probit Models. Journal of Safety Research, Vol. 34, No. 5, 2003, pp. 597-603.
11. Haworth, N., and A. K. Debnath. How Similar Are Two-Unit Bicycle and Motorcycle Crashes? Accident Analysis & Prevention, Vol. 58, No. 0, 2013, pp. 15-25.
12. Schneider, W. H., P. T. Savolainen, D. Van Boxel, and R. Beverley. Examination of Factors Determining Fault in Two-Vehicle Motorcycle Crashes. Accident Analysis & Prevention, Vol. 45, No. 0, 2012, pp. 669-676.
13. TMR. Vehicles on Queensland Register as at 30 June from 1992 to 2014
http://www.tmr.qld.gov.au/Safety/Transport-and-road-statistics/Registration-statistics.aspx Accessed July 7, 2014.
14. AAAM. The Abbreviated Injury Scale (Ais) http://www.aaam.org/about-ais.html Accessed July 31, 2015.
15. Pai, C.-W., and W. Saleh. Exploring Motorcyclist Injury Severity Resulting from Various Crash Configurations at T-Junctions in the United Kingdom--an Application of the Ordered Probit Models. Traffic Injury Prevention, Vol. 8, No. 1, 2007, pp. 62-68.
16. Broughton, J. Car Occupant and Motorcyclist Deaths, 1994-2002. TRL Report 629. Transport Research Laboratory, Crowthorne, England, 2005.
17. Wishart, D., B. Watson, and P. Rowden. Motorcycle Rider Protective Apparel Wearing : Observational Study Results from the Brisbane and Canberra Regions.
Journal of the Australasian College of Road Safety, Vol. 20, No. 4, 2009, pp. 52-59. 18. Haque, M. M., H. C. Chin, and A. K. Debnath. An investigation on multi-vehicle
TABLE 1 Cross-Tabulation of Claim Frequencies in each Severity Category by Road User Type
Severity categories
Road user type 1. Minor
2. Moderate
3. Serious
4. Severe
5. Critical
6. Maximum
3-6. Serious
& above Total
Motorcycle rider 20 58 27 5 0 4 36 114
Pillion 21 63 26 3 1 7 37 121
Vehicle occupant 71 4 0 0 0 0 0 75
Bicyclist 3 2 2 0 0 0 2 7
Pedestrian 6 8 9 0 0 1 10 24
Other 13 0 1 0 0 1 2 15
TABLE 2 Summary Statistics and Description of Explanatory Variables
Variables Description Descriptive Stat Model Stat Freq. % Mean S.D. At-fault Motorcycle Characteristics
Body shape 1 if Moped/Scooter, 0
if motorcycle
19 5.34 0.053 0.225
Cylinder Capacity 1 if <260cc, else 0 58 16.29 0.163 0.370 Year of manufacture
1990 or before 1 if Yes, 0 if No 29 8.15 0.081 0.274
1991-2000 1 if Yes, 0 if No 64 17.98 0.180 0.385
2001-2005 1 if Yes, 0 if No 69 19.38 0.194 0.396
2005-2010 (ref) 1 if Yes, 0 if No 174 48.88 0.489 0.501
2011-2013 1 if Yes, 0 if No 20 5.62 0.056 0.231
At-fault Motorcyclist Characteristics
Age
<25 years 1 if Yes, 0 if No 37 10.39 0.104 0.306
25-39 years (ref) 1 if Yes, 0 if No 88 24.72 0.247 0.432
40-49 years 1 if Yes, 0 if No 75 21.07 0.211 0.408
50-59 years 1 if Yes, 0 if No 77 21.63 0.216 0.412
>=60 years 1 if Yes, 0 if No 38 10.67 0.107 0.309
Unknown 1 if Yes, 0 if No 41 11.52 0.115 0.320
Gender
Female 1 if Yes, 0 if No 24 6.74 0.067 0.251
Male (ref) 1 if Yes, 0 if No 289 81.18 0.812 0.391
Unknown 1 if Yes, 0 if No 43 12.08 0.121 0.326
Not-at-fault Claimant Characteristics
Age
<25 years 1 if Yes, 0 if No 49 13.76 0.138 0.345
25-39 years (ref) 1 if Yes, 0 if No 88 24.72 0.247 0.432
40-49 years 1 if Yes, 0 if No 95 26.69 0.267 0.443
50-59 years 1 if Yes, 0 if No 85 23.88 0.239 0.427
>=60 years 1 if Yes, 0 if No 39 10.96 0.110 0.313
Gender 1 if Female, 0 if Male 184 51.69 0.517 0.500
Road user type
Motorcycle rider 1 if Yes, 0 if No 114 32.02 0.320 0.467
Pillion (ref) 1 if Yes, 0 if No 121 33.99 0.340 0.474
Vehicle occupant 1 if Yes, 0 if No 75 21.07 0.211 0.408
Bicyclist 1 if Yes, 0 if No 7 1.97 0.020 0.139
Pedestrian 1 if Yes, 0 if No 24 6.74 0.067 0.251
Other 1 if Yes, 0 if No 15 4.21 0.042 0.201
Crash characteristics
Area type 1 if Rural, 0 if Urban 177 49.72 0.497 0.501
Year of crash
2009 (ref) 1 if Yes, 0 if No 88 24.72 0.247 0.432
2010 1 if Yes, 0 if No 69 19.38 0.194 0.396
2011 1 if Yes, 0 if No 88 24.72 0.247 0.432
2012 1 if Yes, 0 if No 65 18.26 0.183 0.387
2013 1 if Yes, 0 if No 46 12.92 0.129 0.336
Crash type
Opposing direction 1 if Yes, 0 if No 62 17.42 0.174 0.380 Same direction (ref) 1 if Yes, 0 if No 84 23.60 0.236 0.425 Intersection from adjacent approaches 1 if Yes, 0 if No 20 5.62 0.056 0.231 Maneuvering or overtaking 1 if Yes, 0 if No 16 4.49 0.045 0.207
Out of control 1 if Yes, 0 if No 101 28.37 0.284 0.451
Hit road user or object on road/footpath 1 if Yes, 0 if No 39 10.96 0.110 0.313
TABLE 3 Model Estimates and Marginal Effects
Model
parameters Minor Moderate
Serious and above
Variables Coeff. p M.E. p M.E. p M.E. p
At-fault Motorcycle Characteristics
Cylinder Capacity (<260cc) -0.408 0.072 0.155 0.072 -0.073 0.090 -0.082 0.073
At-fault Motorcyclist Characteristics
Age
<25 years 0.643 0.023 -0.252 0.026 0.139 0.073 0.113 0.015 25-39 years (ref)
40-49 years 0.123 0.581 -0.049 0.583 0.028 0.600 0.021 0.563 50-59 years 0.165 0.494 -0.065 0.497 0.037 0.520 0.028 0.469 >=60 years 0.587 0.043 -0.230 0.048 0.127 0.106 0.103 0.024 Unknown -0.124 0.633 0.049 0.632 -0.030 0.622 -0.020 0.649 Gender
Female 0.655 0.039 -0.249 0.040 0.113 0.060 0.135 0.040 Male (ref)
Unknown -0.160 0.467 0.062 0.467 -0.031 0.470 -0.031 0.468
Not-at-fault Claimant Characteristics
Age
<25 years 0.562 0.023 -0.224 0.023 0.143 0.046 0.081 0.017 25-39 years (ref)
40-49 years 0.374 0.072 -0.149 0.074 0.093 0.110 0.055 0.043 50-59 years 0.355 0.107 -0.142 0.108 0.090 0.144 0.052 0.074 >=60 years 0.703 0.015 -0.280 0.016 0.179 0.038 0.101 0.008 Female -0.613 0.002 0.234 0.002 -0.110 0.008 -0.124 0.002 Road user type
Motorcycle rider -0.384 0.076 0.091 0.059 0.048 0.178 -0.139 0.085 Pillion (ref)
Vehicle occupant -3.027 0.000 1.061 0.000 -0.297 0.043 -0.764 0.000 Bicyclist -0.815 0.103 0.172 0.088 0.136 0.186 -0.308 0.111 Pedestrian 0.166 0.653 -0.034 0.660 -0.029 0.645 0.063 0.652 Other -1.968 0.000 0.446 0.000 0.278 0.030 -0.724 0.000
Crash characteristics
Crash type
Opposing direction 0.702 0.005 -0.273 0.007 0.144 0.039 0.129 0.002 Same direction (ref)
Intersection from adjacent
approaches 0.251 0.522 -0.100 0.523 0.059 0.535 0.040 0.512 Maneuvering or overtaking 0.130 0.750 -0.052 0.751 0.031 0.754 0.021 0.746 Out of control 0.284 0.133 -0.112 0.138 0.062 0.185 0.050 0.105 Hit road user or object on
road/footpath -0.168 0.583 0.067 0.583 -0.041 0.575 -0.026 0.599 Others -0.061 0.818 0.024 0.818 -0.015 0.816 -0.009 0.821
Cutoff point 1 -0.791
Cutoff point 2 0.675
Model statistics
No of obs. 356
Log-likelihood at Zero -384.4 Log-likelihood at convergence -274.4
AIC 600.9
G2 220