namics of downy brome. Weed Sci. medusahead in response to tempera-
17:20-26. ture and afterripening. Weed Sci.
YOUNG, J. A., R. A. EVANS, AND R. E. 16:92-95.
ECKERT, JR. 1968a. Germination of YOUNG, J. A., R. A. EVANS, R. 0.
Influence of Spring, Fall, and Spring-Fall
Grazing on Crested Wheatgrass Range1
PAT 0. CURRIE
Range Scientist, Rocky Mountain Forest and Range Experiment Station’ Fort Collins, Colorado.
Highlight
Grazing crested wheatgrass during spring only, fall only, and spring and fall to a l-inch stubble height for 10 years had little effect on vegetative character- istics of the seeded stands. Invasion of the stands by other species was greater with spring or spehg-fall use than with fall use. Litter decreased with all seasonal treatments, but decreased most under spring-fall use. Drought and growing-season moisture were the critical factors in determining forage yields. The spring-fall pastures produced more forage, provided more days of grazing, and gave the highest average beef production, 177 lb/season. Spring grazing was next and fall grazing the least productive for animal weight gains.
Crested wheatgrass (Agropyron tlesertorum (Fisch.) Schult.) is un- doubtedly the most common and widely used introduced grass for range seedings in the western United States and parts of southern Canada. Its earliest record of in- troduction into the United States dates back to 1898. In 1915 it was found to be particularly adapted in the northern Great Plains (West- over and Rogler, 1934; Weintraub,
1953, p. 3). Since that time, crested wheatgrass has been used exten- sively for seedings both west and south of the Plains area. Large areas are commonly seeded and it was estimated as early as 1951 that., of the 8 million acres seeded in the western United States since the mid-thirties, a majority was planted to crested wheatgrass (Woolfolk, 1951).
With this long history, literature is extensive pertaining to adapt-
1 Received April 4, 1969; accepted for publication August 15, 1969.
2 Forest Service, U.S. Department of Agriculture, with central headquarters maintained at Fort Collins, in coop- eration with Colorado State Univer- sity.
ability, response to fertilization, clipping, morphological attributes, and economics of seeding crested wheatgrass. Also, its grazing value has been widely investigated throughout the entire western re- gion. Most of the grazing reports, however, have dealt with livestock gains and/or changes in vegetative cover as a result of grazing inten- sities during one particular season of use: spring grazing, season-long grazing, or a combination of spring grazing plus later use of the re- growth forage. Essentially no re- search has been done on how long- term grazing influences crested wheatgrass when comparing spe- cific grazing seasons. Therefore, it was the purpose of the research reported here to find out what happens to crested wheatgrass when it is grazed only in the spring, the fall, or both spring and fall over an extended period of years.
Study Area and Methods The research was conducted at the Manitou Experimental Forest, 28 miles northwest of Colorado Springs, Colorado. The study site is situated at an elevation of ap-
GIFFORD, AND R. E. ECKERT, JR. 1968b. Germination of medusahead in response to osmotic stress. Weed Sci. 16:364-368.
proximately 7,800 ft. Annual pre- cipitation has averaged 15.7 inches during the past 25 years. For the IO-year period of study 1957-1966, annual moisture averaged 16.1 inches, with approximately two- thirds of this amount or 10.7 inches being received during the growing season from April through August. Because of the elevation and weather patterns along the Front Range, winters are open but cold, with temperatures occasionally as low as -40 F. The growing season is short, and only during July and August do overnight temperatures usually stay above freezing. Day- time temperatures during this pe- riod seldom exceed 90 F.
Soils on the site are alluvial, de- rived primarily from outwash ma- terials of Pikes Peak granite. They are generally of low to moderate fertility, have a moderate amount of organic matter, and are quite porous. Classification is a sandy loam.
The study pastures were located on a large alluvial fan within a natural grassland opening of the ponderosa pine type. Years back, many of these open areas were cul- tivated; this particuIar one was last cultivated in 1934. Both during and after cultivation, considerable sheet and gully erosion occurred on its westerly facing, 6 to 10% slopes. At the time of seeding in 1946, the area was occupied by a dense cover of low-value forbs typ- ical of abandoned fields in the pine-bunchgrass type.
it was mowed for hay in 1948 and 1949. From that time until the study began in 1957, the area was grazed only occasionally in winter by horses.
Grazing treatments.-Six pastures, each 3.3 acres in size, were fenced within a large block to obtain two pastures for each seasonal treat- ment: spring, fall, and both spring and fall use on the same pasture, hereafter referred to as spring-fall use. Spring grazing began when maximum leaf length of the crested wheatgrass plants in the spring- only treatment averaged 3 inches. Fall grazing started about Septem- ber 1 each year. Spring-fall pas- tures were stocked in conjunction with the starting dates for the re- spective single season treatments. All pastures were grazed to a l-inch stubble height, an intensity of grazing that was considered heavy enough to show in time any differ- ences in the effects of grazing dur- ing the different seasons.
Yearling Hereford heifers were used to graze the pastures, but animal numbers were not constant each year. Instead, definite grazing season limitations were established. For the spring treatments, a date of June 10 was set as the latest date to reach the desired level of use; in the fall, October 31 was the established date. Additional animals were added if necessary to reach the stubble height objectives in the specified time. In years with low forage production, at least two heifers were put in each pasture, and the goal for the minimum length of grazing treatment was 3 weeks. Dates were kept on stock- ing, and the heifers were weighed “in” and “out” following an over- night shrink. Seasonal and daily weight gains were computed for each treatment.
Vegetation measurements.-Leaf
lengths were measured along ran- dom pace transects to determine range readiness, vigor, and termi- nation of grazing. When maximum leaf length of 60 plants, 20 along each of three transects, averaged approximately 3 inches in the
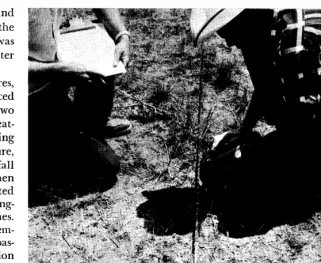
FIG. 1. Intercepted crown distances of individual crested wheatgrass plants were measured and recorded on graph paper to .Ol-ft. Plants along the same transects were measured four times during the study to evaluate crown intercept changes.
spring-grazed pastures, then plants in the spring-fall and fall-grazed pastures were also measured to compare relative vigor. Pastures of the spring and spring-fall treat- ments were then stocked with the appropriate number of animals. Plant stubble heights were mea- sured in a comparable manner at the end of grazing in each pasture at each season. Animals were re- moved when stubble heights for 60 plants averaged approximately 1 inch.
Production and utilization were estimated by the paired plot-differ- ences method, with twelve 9.6 ft2 plot pairs in each pasture. The 12 herbage production plots were pro- tected from grazing by steel agron- omy cages, while their paired coun- terparts were open to use. In years with high forage production dur- ing the spring, and to more accu- rately estimate regrowth forage, plots were clipped and cages moved one to several times during the grazing season. In years of low production and in the fall, plots were harvested once immediately after grazing ended.
Ground cover and aggregration and dispersal characteristics of crested wheatgrass were measured on 10 permanent ZO-ft transects placed at right angles to the drill rows. Plants along the transects were measured in 1959, 1961, 1964, and 1966, but different methods were used for evaluating stand characteristics.
decision that the space between plant portions or crowns at ground level had to exceed 0.5 inch was used to determine individual plants. Species other than crested wheat- grass were not measured.
Treatment Effects
Utilization.-Average percent uti- lization (by weight) of crested wheatgrass from 1957 to 1966 in the respective treatments was as follows:
Treatment Utilization
Spring 77
Fall 82
Spring-Fall
Spring- 75
Fall 68
Average 72
This use was uniformly heavy when plants were grazed to a l-inch stubble height, but there were definite appearances to the pas- tures which should be mentioned for practical purposes. For example, the spring-fall grazed pastures ap- peared to receive much heavier use than the others because the crested wheatgrass was kept grazed to a shorter height. Also, plants invad- ing the pastures were much more apparent within this treatment, and gave the stands an appearance of being more severely depleted than the other treatments. Except for a reduction in initial leaf height, however, this visual appearance was misleading and did not represent true deterioration.
Leaf heights.-April 26 was the average date for crested wheatgrass leaves to reach a 3-inch height and for livestock to be put on the pas- tures in the spring. The earliest date was April 19 and the latest was May 2. Neither the spring nor the fall grazing treatment influ- enced plant height. As shown be- low, average leaf lengths were quite similar in these two treatments, and this similarity was consistent each year.
Grazing Leaf Lengths
Treatment (inches)
Spring 2.76
Fall 2.70
Spring-Fall 2.23
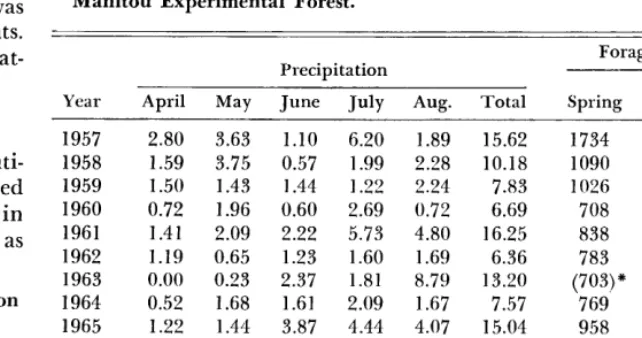
Table 1. Forage production (lb/acre) from crested wheatgrass ranges grazed at different seasons in relation to April-through-August precipitation (inches), Manitou Experimental Forest.
Year
Precipitation Forage production
April May June July Aug. Total Spring Fall Spring- Fall
1957 2.80 3.63 1.10 6.20 1.89 15.62 1734 1894 2457 1958 1.59 3.75 0.57 1.99 2.28 10.18 1090 1362 1046 1959 1.50 1.43 1.44 1.22 2.24 7.83 1026 824 878 1960 0.72 1.96 0.60 2.69 0.72 6.69 708 926 956 1961 1.41 2.09 2.22 5.73 4.80 16.25 838 1525 1736 1962 1.19 0.65 1.23 1.60 1.69 6.36 783 501 668 1963 0.00 0.23 2.37 1.81 8.79 13.20 (703)X 741 (896) * 1964 0.52 1.68 1.61 2.09 1.67 7.57 769 758 934 1965 1.22 1.44 3.87 4.44 4.07 15.04 958 1277 1128 1966 1.25 0.86 1.47 5.57 1 .oo 10.15 486 640 823
Average 1.22 1.77 1.65 3.33 2.92 10.89 910 1045 1152
* Fall or regrowth forage. No measurable forage was produced for spring grazing.
On pastures receiving spring-fall use, leaf lengths for the IO-year period averaged 0.5 inch shorter than on the other pastures. Height growth tended to become progres- sively less each year in this treat- ment and by the end of the study in 1966, leaves on the spring-fall grazed pastures averaged 2.1 inches compared with 3.1 for spring grazing.
This effect on plant height in the spring-fall treatment did not influence total forage production. Yields were larger initially from these spring-fall grazed pastures and remained larger at the end of the study (Table 1).
Forage yields.-Variations in for- age yields of crested wheatgrass were largely not attributable to seasonal treatment, but were pri- marily due to the amount of mois- ture received during the growing season (Currie and Peterson, 1966). It was found from regression anal- ysis that 88 to 97% of the differ- ences in yield were explained by
the rainfall received in specific months. For example, yields on spring-grazed pastures ranged from 1,734 lb/acre in 1957 to essentially 0 in 1963, and the variation was due primarily to variation in April precipitation. Production of fall- grazed pastures varied in response to May-July moisture. In pastures grazed both spring-fall, the April
and May moisture influenced spring forage yields, while June and July rainfall controlled the fall re- growth. In all pastures yields varied considerably from year to year. In 1966 they were consider- ably below the long-term average, but in 1965, when moisture was good, their production was near or above average. These fluctua- tions in production, although com- mon, tended to be less extreme on the pastures grazed only in the spring.
Cover.-Ground cover character- istics of the stands also showed only minor and nonsignificant dif- ferences between the different sea- sonal grazing treatments (Table 2). Average total ground cover ranged from a low of 44.9% on spring-fall grazed pastures to 49.0% on pas- tures grazed in the spring, or a difference of less than 5%. Crested wheatgrass, invading species, and litter cover differed by only 2, 3.2, and 3.9%, respectively, among the three treatments.
Table 2. Percent cover of seasonally grazed crested wheatgrass ranges during the IO-year period 1957-66.
Cover
characteristic Spring only Fall only Spring-Fall Average Total cover
1959 1961 1964 1966 Average Crested wheatgrass
1959 1961 1964 1966 Average Invading species
1959 1961 1964 1966 Average Litter
1959 1961 1964 1966 Average
55.4 57.1 52.2
43.2 41.6 43.6
46.4 38.0 41.0
51.2 52.8 42.9
49.0 47.4 44.9
6.1 8.1 6.6
9.0 10.0 9.6
6.0 5.4 5.4
6.2 11.8 6.2
6.8 8.8 7.0
1.4 .5 1.8
4.8 1.0 3.6
4.5 1.6 3.1
9.0 3.6 9.3
4.9 1.7 4.4
47.8 48.5 43.8
29.5 30.7 30.3
36.0 31.0 32.4
35.9 37.4 27.3
37.3 36.9 33.4
54.9
42.8 41.8 49.0
6.9 9.5 5.6 8.1
1.2 3.1 3.1 7.3
46.7 30.2 33.1 33.5
vading species. By 1961, and due to the effect of grazing, total cover decreased on all pastures primarily because the litter cover had de- creased by 13.5% with spring-fall grazing, 17.8% with fall grazing, and 18.3% with spring grazing. Crested wheatgrass cover increased about 2 to 3% on all pastures dur- ing this period, and the cover from invading species increased 3.5% or less. These cover increases, for both crested wheatgrass and invading species, were smallest with fall grazing.
The general area suffered a tem- porary but severe drought during the late winter of 1962 and early spring of 1963. For the first time in over 25 years, no measurable moisture was received in April. This dryness continued into May and sporadically throughout July. Moisture in June, although above average, was received in numerous, ineffective, small thunder showers.
It was not until August when 8.79 inches of moisture were received (Table 1) that discernible plant growth began. During the early spring, leaves on the crested wheat- grass plants grew to approximately
1.5 inches, then dried back to the crowns so that grazing was not pos- sible on the spring pastures.
As a result of the drought, ground cover of crested wheatgrass, when measured in 1964, had decreased by one-third on spring-grazed pas- tures and by approximately one- half on fall and spring-fall pastures (Table 2). The largest decrease was on the fall-grazed pastures; in July of 1963 it appeared that the death loss of the crested wheatgrass plants in this treatment would be severe (Fig. 2). Except for the fall-grazed pastures, there was a small decrease in the basal ground cover of in- vading species between 1961 and 1964. Litter cover increased a small amount in all pastures as a result of the dead plant material. From 1964 to 1966, crested wheatgrass cover increased under all treat- ments, with the largest increase, 6.5%, on the fall-grazed pastures.
FIG. 2. Ground cover appearance of a fall-grazed pasture on June 27, 1963, during
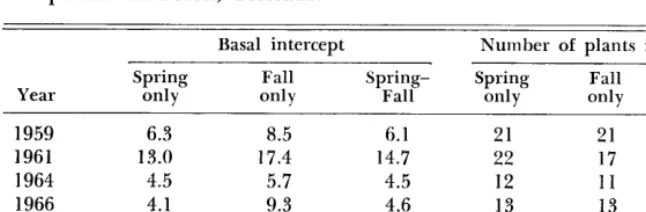
Table 3. Basal intercept (%) and number of crested wheatgrass plants along permanent transect lines to evaluate aggregation, dispersal and changes in plant numbers on ranges grazed seasonally for 10 years, 1957-66. Manitou Experimental Forest, Colorado.
Year
Basal intercept Number of plants intercepted Spring Fall Fall
only only Spring- Fall Spring only only Spring- Fall
1959 6.3 8.5 6.1 21 21 24
1961 13.0 17.4 14.7 22 17 22
1964 4.5 5.7 4.5 12 11 14
1966 4.1 9.3 4.6 13 13 13
Average 7.0 10.2 7.5 17.0 15.5 18.2
Only small increases of 1% or less occurred on the other pastures. The most noticeable change was the in- crease in cover by invading plants. Percentagewise, the largest increase was only 6.2% on the spring-fall grazed pastures, but in terms of previous measurements, the cover from the invading species on all pastures in 1966 was two to three times greater than in 1964.
Except for the increase in litter cover as a result of drought, the amount of litter decreased from all treatments during the course of the study. In 1959, both the spring and fall pastures had approximately 5% more litter than the spring-fall pas- tures. By 1966, litter cover had de- creased 11 to 16.5% from the 1959 level. The spring-fall grazed pas- tures showed the largest decrease, and had approximately 10% less litter than the other pastures. Thus grazing both spring and fall on the same pastures reduced total cover, but it did not materially influence crested wheatgrass cover or total production of the pastures.
Basal intercept of plants in 1959 was comparable in all pastures, with plants in the fall-grazed pas- tures occupying about 2% more area than in the others (Table 3). The number of plants contributing to this intercept was identical for the spring and fall pastures. The spring-fall pastures had 24 plants per ZO-ft transect, or 3 more than the other pastures. By 1961, inter- cept had approximately doubled under all treatments, with plant numbers staying about the same on
the spring and spring-fall grazed pastures. On the fall-grazed pas- tures, however, basal intercept doubled while plant numbers de- creased, which showed an aggrega- tion of fewer plants into larger clumps from this treatment.
The effect of the 1963 drought was evident in all of the stands, and in 1964 the measurements showed a reduction in intercept of approximately two-thirds from the 1961 level. Plant numbers de- creased also, which confirmed visual observations that a large number of plants or parts of plant clumps were killed by the drought. This in turn led to a temporary reduc- tion in forage yields between 1961 and 1964.
Between 1964 and 1966, however, neither plant crown intercept at ground level nor plant numbers changed appreciably. Thus a de- crease in both crown intercept and plant numbers did not lead to a corresponding long-term decrease in production (Table 1). In fact, forage yields in 1966 were larger than pre-drought yields of 1962 ex- cept on the spring-grazed pastures, and 1965 yields were within 100 lb/acre of 1958 yields under all treatments. The fewer and smaller crowned plants apparently made up for their smaller size through addi- tional height growth to recover to a good production level in the crested wheatgrass stands.
Livestock weigh ts.-Since vegeta- tive characteristics of the crested wheatgrass pastures did not differ significantly as a result of the sea-
sonal grazing treatment, livestock weights became of prime impor- tance in evaluating treatment and for management consideration. In this respect, daily gains in the pres- ent study were much less than those reported for crested wheat- grass range in both Colorado and New Mexico. Johnson (1959) re- ported an average daily gain of 1.70 lb from crested wheatgrass pastures grazed at several intensities in Colo- rado. For ranges at elevations of 7,000 to 8,500 ft and grazed during the spring in New Mexico, Spring- field and Reid (1967) reported a daily gain of 1.98 lb for yearling animals. As shown below, weight gains during spring in the present study averaged 0.6 to 0.8 lb/day less than those for ranges grazed during a comparable time and sea- son in New Mexico. In addition, daily gains from the spring-fall pastures were only 40-50% and the fall gain 5-6% of the gains reported in either the Colorado or New Mexico studies.
Grazing Treatment
Daily Gain (lb)
Spring 1.10
Fall .I0
Spring-Fall SO
500-
400 -
G 8 s 300 - s $ 200- : 8 100 - 9 fi
0
a-100 -
SPRING I SPRING-FALL greater total animal production was
~-
obtained from grazing the same pastures twice each year. Further- more, the better weight gains and more days of grazing were obtained without impairing productivity of the crested wheatgrass stands.
n Literature Cited
I
II
I
I CANFIELD. R. H. 194 1. Application
I
of the line interception sampling range vegetation. method J. Forest. in 39: 388-394.195758596061 6263646566 1 5758596061 6263646566 I 57585960616263646566 YEARS
FIG. 3. Total heifer gains or losses per season on pastures grazed in the spring, fall, or spring-fall, 1957-66.
or more, and fall weight losses ranged from 48 to 122 lb. In 1965, which was also a good forage year, the heifers gained weight, but only a modest 29 lb average in each pas- ture, and this was for 6 heifers grazing a pasture an average of 38 days. The length of time the ani- mals were on the pastures had es- sentially no influence on weight gains. Three of the 6 heifers in each pasture had been grazing that. pasture for 60 days, but gained only 23 lb through the entire period.
The spring gain from spring-fall grazed pastures averaged 134 lb, or 9 lb less than from the pastures grazed only in the spring. Thus, there was very little difference in animal production between these two treatments. In the fall, how- ever, the gains averaged 43 lb from
CLARK, S. E., J. A. CAMPBELL, AND J. B. CAMPBELL. 1942. An ecological and grazing capacity study of the native grass pastures in Southern Alberta, Saskatchewan and Mani-
I I toba. Can. Dep. Agr. Publ. 738.
31 p.
CURRIE, P. O., AND G. PETERSON. 1966. Using growing-season precipitation to predict crested wheatgrass yields. J. Range Manage. 19:284-288. HEDRICK, D. W. 1967. Managing
with a 10 lb average for the fall crested wheatgrass for early spring grazing treatment. Similar to the use. J. Range Manage. 20:53-54. fall treatment, weight losses were JOHNSON, W. M. tensity trials on seeded ranges 1959. Grazing in- in recorded in
3
out of 10 years. The the ponderosa pine zone of Colo- largest weight loss, 13 lb, was in rado. J. Range Manage. 12:1-7. 1962, the year a weight loss of 112 REYNOLDS, H. G., AND H. W. SPRING- lb was recorded in the fall-grazed FIELD. 1953. Reseeding southwest- pastures. This was a year of low ern rangelands with crested wheat- forage yields, and was an exception grass. U.S. Dep. Agr. Farmers Bull. to the rule that losses generally 2056. 20 p.were higher in years of high forage SPRINGFIELD, H. W., AND E. H. REID.
production. 1967. Crested wheatgrass for spring
For total gain and days of use, grazing J. Range Manage. in northern 20:406-408. New Mexico. the spring-fall grazing treatment WEINTRAUB, F. C. 1953. Grasses in- was definitely superior to either troduced into the United States. spring or fall grazing alone. For U.S. Dep. Agr. Agr. Handb. 58. 79 p. the lo-year study, days of use aver- WESTOVER, H. L., AND G. A. ROGLER. aged 2 13 for the spring-fall, 159 1934. (Rev. 1947). Crested wheat- for the fall, and 131 for the spring grass. U.S. Dep. Agr. Leafl. 104. 8 p. pastures. Total weight gains by WOOLFOLK, E. J. 195 1. Crested wheat- season averaged 34 lb more than grass grazing values. U.S. Dep. Agr. from spring grazing and 167 lb Forest Serv., Northern Rocky Moun- he spring-fall pastures compared more than from fall grazing. Thus,
tain Forest and Range Exp. Sta. Note 91. 10 p.
Spec;u/ists
in Quality
N ATI
V E
G
R
ASS
E
S
Wheatgrasses l Bluestems l Gramas l Switchgrasses l Lovegrasses l Buffalo l and Many Others
We grow, haruest, process these seeds Native Grasses Harvested in ten States
Your Inquiries