Estimates of the
B
cwave function from the CDF and LHCb
production data
SergeyBaranov1,∗and ArtemLipatov2,∗∗
1P.N. Lebedev Institute of Physics, Lenin Avenue 53, 119991 Moscow, Russia
2Skobeltsyn Institute of Nuclear Physics, Moscow State University, 119991 Moscow, Russia
Abstract. In the framework of perturbative QCD and nonrelativistic bound state formalism, we calculate the production ofBcandB∗
cmesons at the condi-tions of the CDF and LHCb experiments. We derive first estimacondi-tions for theBc wave function from a comparison with the available data.
1 Introduction
The family ofB(∗)
c mesons is an interesting though poorly explored part of the quarkonium
world. Although some properties of these mesons may look apparently different from the
ones of the hidden-flavor onium states, their inner structure must be similar and driven by the same physics. Studying theB(∗)
c properties is important on its own and can provide an
additional cross check of the exploited theoretical models. The flavor composition ofB(∗)
c mesons excludes the convenient strong and
electromag-netic decays channels that could be used as a prompt measure of the nonrelativistic wave function. Instead, we will try to obtain an estimate of this essential parameter via considering the production process. We will rely on the data collected by the CDF Collaboration at the Fermilab Tevatron at 1.8 TeV [1] and 1.96 TeV [2] and by the LHCb Collaboration at CERN at 7 TeV [3] and 8 TeV [4].
The proposed method was tested in a number of calculations [5, 6] by performing a global fit of the inclusiveψ′,χc, andJ/ψproduction. All of the meson wave functions were taken
there as free parameters, and the returned values were close to those obtained from the decays
ψ′→µ+µ−, χc2 →γγ, J/ψ→µ+µ−.
2 Theoretical framework
In the theory, the production of B(∗)c mesons at the LHCb conditions is dominated by the O(αs)4partonic subprocess
g+g→B(∗)
c +b+c¯, (1)
whereB(∗)
c may denote either pseudoscalar Bc (spin=0) or vector B∗c(spin=1) bound state
of the charm and beauty quarks. The evaluation of the relevant 36 Feynman diagrams is straightforward and is described in every detail in Ref. [7]. The only innovation made in
∗e-mail: [email protected]
the present calculation is in using thekt-factorization approach. The advantage of the latter
comes from the ease of including the initial state radiation corrections that are efficiently
taken into account in the form of the evolution of unintegrated, or transverse momentum dependent (TMD) gluon densities. Then, in accordance with thekt-factorization prescription
[8], the initial off-shell gluon spin density matrix is taken in the formǫµgǫg∗ν = k µ
TkνT/|kT|2,
wherekT is the component of the gluon momentum perpendicular to the beam axis. In the
limit whenkT →0,this expression converges to the ordinaryǫgµǫg∗ν=−gµν/2, and we recover
the results of collinear approach [9–11]. This work is the first calculation of theB(∗)
c hadronic
production withkt-factorization.
he perturbative part of the calculation is performed according to the formula
dσ(pp→BcbcX¯ )= α4s
12 ˆs2|R(0)|2 1 4
spins 1 64
colors
M(gg→Bcbc¯)
2
× Fg(x1,k12T, µ2)Fg(x2,k22T, µ2)dk21Tdk22T dp2BcTdp 2
cTdyBcdybdyc¯ dφ1
2π
dφ2
2π
dφBc 2π
dφc
2π, (2)
and we use the JH’2013 (set 2) [12] parametrization for the TMD gluon distribution
Fg(xi,k2iT, µ2). The factorization scale is set toµ2F = sˆ+q2T, where ˆs is the total energy
of the partonic subprocess andqT is the net non-zero transverse momentum of the incoming
gluon pair. This special choice for the factorization scale is connected with the evolution details of the TMD gluon density (see [12]). The renormalization scale is set, by default, to
µ2R =m2B cT ≡ p
2
BcT +m 2
Bc. We do not exclude that this setting overestimates the momentum transfer in the hard subprocess, and so, will also consider an alternative choice. An extended discussion on this point will be given in the next section.
The absolute normalization of the cross section depends on a singe non-perturbative pa-rameter: the radial (color singlet) wave function at the origin of the coordinate space|R(0)|2
[13–15]. The so called color octet contributions are nowhere important as they are suppressed by the relative velocity counting rules. Note by the way that the gluon fragmentation mech-anism (known to dominate the production ofJ/ψmesons at high transverse momenta) is not
applicable to our case because of the flavor composition ofBcmesons.
To perform a comparison with the data (see below) we also need to calculate the pro-duction of the ordinaryB+mesons. Again, we do that in thek
t-factorization approach with
the same gluon density [12] as above, and with Peterson [16] fragmentation function with
ǫ =0.0126 for the formation of B+mesons fromb-quarks. The consistency of this setting
was shown in a previous publication [17].
3 Numerical results and discussion
The data we wish to compare with are presented in the form of the ratio of the B(∗)c toB+
production cross sections times the relevant branching fractions. All these results accumulate the statistics from bothBcandB∗cmesons and include also their charge conjugate states.
At √s=1.8 TeV,the CDF Collaboration reports [1] for the fiducial phase space defined
aspBc
T >6 GeV,pB
+
T >6 GeV,|yBc|<1,|yB
+
|<1:
σ(Bc)Br(Bc→J/ψlν)
σ(B+)Br(B+→J/ψK) =0.132±
0.061
the present calculation is in using thekt-factorization approach. The advantage of the latter
comes from the ease of including the initial state radiation corrections that are efficiently
taken into account in the form of the evolution of unintegrated, or transverse momentum dependent (TMD) gluon densities. Then, in accordance with thekt-factorization prescription
[8], the initial off-shell gluon spin density matrix is taken in the formǫgµǫg∗ν = k µ
TkTν/|kT|2,
wherekT is the component of the gluon momentum perpendicular to the beam axis. In the
limit whenkT →0,this expression converges to the ordinaryǫgµǫg∗ν=−gµν/2, and we recover
the results of collinear approach [9–11]. This work is the first calculation of theB(∗)
c hadronic
production withkt-factorization.
he perturbative part of the calculation is performed according to the formula
dσ(pp→BcbcX¯ )= α4s
12 ˆs2|R(0)|2 1 4 spins 1 64 colors
M(gg→Bcbc¯)
2
× Fg(x1,k21T, µ2)Fg(x2,k22T, µ2)dk21Tdk22T dp2BcTdp 2
cTdyBcdybdy¯c dφ1
2π
dφ2
2π
dφBc 2π
dφc
2π, (2)
and we use the JH’2013 (set 2) [12] parametrization for the TMD gluon distribution
Fg(xi,k2iT, µ2). The factorization scale is set toµ2F = sˆ+q2T, where ˆs is the total energy
of the partonic subprocess andqT is the net non-zero transverse momentum of the incoming
gluon pair. This special choice for the factorization scale is connected with the evolution details of the TMD gluon density (see [12]). The renormalization scale is set, by default, to
µ2R =m2B cT ≡ p
2
BcT +m 2
Bc. We do not exclude that this setting overestimates the momentum transfer in the hard subprocess, and so, will also consider an alternative choice. An extended discussion on this point will be given in the next section.
The absolute normalization of the cross section depends on a singe non-perturbative pa-rameter: the radial (color singlet) wave function at the origin of the coordinate space|R(0)|2
[13–15]. The so called color octet contributions are nowhere important as they are suppressed by the relative velocity counting rules. Note by the way that the gluon fragmentation mech-anism (known to dominate the production ofJ/ψmesons at high transverse momenta) is not
applicable to our case because of the flavor composition ofBcmesons.
To perform a comparison with the data (see below) we also need to calculate the pro-duction of the ordinaryB+mesons. Again, we do that in thek
t-factorization approach with
the same gluon density [12] as above, and with Peterson [16] fragmentation function with
ǫ =0.0126 for the formation ofB+mesons fromb-quarks. The consistency of this setting
was shown in a previous publication [17].
3 Numerical results and discussion
The data we wish to compare with are presented in the form of the ratio of the B(∗)c to B+
production cross sections times the relevant branching fractions. All these results accumulate the statistics from bothBcandB∗cmesons and include also their charge conjugate states.
At √s=1.8 TeV,the CDF Collaboration reports [1] for the fiducial phase space defined
aspBc
T >6 GeV,pB
+
T >6 GeV,|yBc|<1,|yB
+
|<1:
σ(Bc)Br(Bc→J/ψlν)
σ(B+)Br(B+→J/ψK) =0.132±
0.061
0052. (3)
Hereafter, in the experimental referencesBc will denote a combined sample ofBc andB∗c
mesons. Within the specified kinematic cuts, we obtain from Eq.(2):
σtheor(B+c) = |R(0)|2·0.248 nb/GeV3, σtheor(B∗c+) = |R(0)|2·0.515 nb/GeV3,
σtheor(B+c+B∗c+) = |R(0)|2·0.763 nb/GeV3. (4)
We also have for the production ofB+mesons
σtheor(B+)Br(B+→J/ψK+)=3.56 nb, (5)
where we have used the decay branching fraction value
Br(B+
→J/ψK+)=1.026·10−3 (6)
taken from the Particle Data book [18].
At √s = 1.96 TeV,the CDF Collaboration reports [2] for pBc
T > 6 GeV, pB
+
T >6 GeV, |yBc|<0.6, and|yB+|<0.6:
σ(Bc)Br(Bc→J/ψlν)
σ(B+)Br(B+→J/ψK) =0.211±
0.024
0.023 (7)
Within the above cuts, we obtain
σtheor(B+
c) = |R(0)|2·0.175 nb/GeV3, σtheor(B∗c+) = |R(0)|2·0.363 nb/GeV3,
σtheor(B+c+B∗c+) = |R(0)|2·0.538 nb/GeV3, (8)
and
σtheor(B+)Br(B+→J/ψK+)=2.43 nb. (9)
At √s = 7 TeV,the LHCb Collaboration reports [3] for pBc
T > 4 GeV, pB
+
T > 4 GeV,
2.0< yBc<4.5, and 2.0< yB+<4.5:
σ(Bc)Br(Bc→J/ψ π+)
σ(B+)Br(B+→J/ψK) =0.0061±0.0012. (10)
Under these conditions, we have:
σtheor(B+c) = |R(0)|2·1.23 nb/GeV3, σtheor(B∗+
c ) = |R(0)|2·1.80 nb/GeV3,
σtheor(B+c+B∗c+) = |R(0)|2·3.03 nb/GeV3, (11)
and
σtheor(B+)Br(B+→J/ψK+)=9.04 nb. (12)
Finally, at √s=8 TeV,the LHCb Collaboration reports [3] forpBc
T <20 GeV,pB
+
T <20
GeV, 2.0< yBc <4.5, and 2.0< yB+<4.5:
σ(Bc)Br(Bc→J/ψ π+)
and our predictions read:
σtheor(B+c) = |R(0)|2·4.92 nb/GeV3, σtheor(B∗c+) = |R(0)|2·5.63 nb/GeV3,
σtheor(B+c+B∗c+) = |R(0)|2·10.55 nb/GeV3, (14)
and
σtheor(B+)Br(B+→J/ψK+)=32.66 nb. (15)
The above data have to be combined with the experimentally measured [19] ratio of the branching fractions
Br(Bc→J/ψ π+)/Br(Bc→J/ψ µν)=0.047 (16)
and with the theoretically calculated [20] decay branching fraction
Br(Bc→J/ψ π+)=0.0033. (17)
(The original [20] prediction of 0.0029 was corrected [4] to 0.0033 for the latest measurement of theBclifetime.)
Making the necessary substitutions and comparing Eqs. (3), (7), (10), and (13) with theoretical predictions we deduce the following estimations for the radial wave function:
|R(0)|2=4.39±2.00 GeV3 Ref. [1] |R(0)|2=6.79±0.08 GeV3 Ref. [2] |R(0)|2=5.52±0.11 GeV3 Ref. [3]
|R(0)|2=6.32±0.18 GeV3 Ref. [4] (18)
These can be summarised in a mean-square average value
|R(0)|2 =5.78 GeV3 (19)
with an error of±0.64 GeV3and±1.07 GeV3at the 60% and 80% confidence level,
respec-tively.
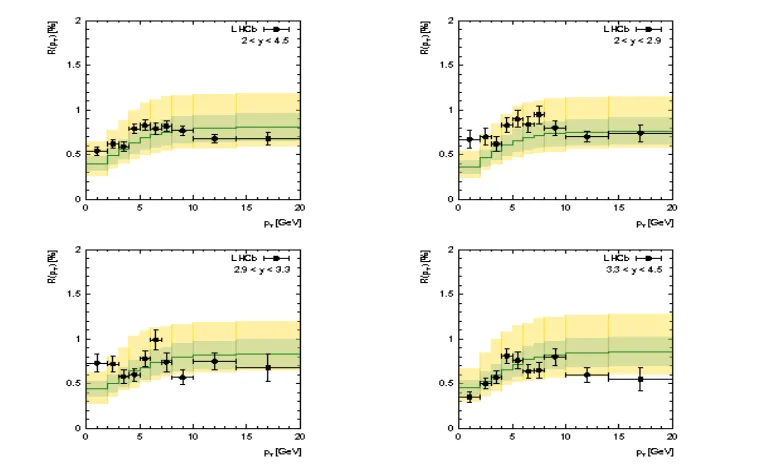
We conclude our analysis with showing the ratio (13) in the differential form, as a function
of the transverse momentum for 3 separate rapidity intervals (see Fig. 1). The calculations and the data [4] are in good agreement in shape, thus indicating that the hard scattering par-tonic subprocesses are calculated correctly. The choice of the TMD gluon density is unimpor-tant since the gluon distributions cancel out in the ratio. The sensitivity to the renormalization scale is high, as a reflection of the fourth power ofαS(µ2R) in the key subprocess (1). The
cen-tral values of the cross sections (green histograms) correspond to the conventional choice
µ2R=m2B
cT; the theoretical uncertainty band (yellow area in Fig. 1) is obtained by varyingµR around its default value by a factor of 2.
Our extracted values of |R(0)|2 are systematically higher than the predictions [21] of potential models which range from 1.508 GeV3 for the logarithmic potential [22], through 1.642 GeV3and 1.710 GeV3for the Buchmuller-Tye [23] and power low [24] potentials up to 3.102 GeV3 for the Cornell potential [25]. An even lower value of the wave function is obtained in the lattice calculation of Ref. [26] which reports fBc =0.427 GeV, equivalent to |R(0)|2=1.2 GeV3.
This systematic discrepancy may be taken as an evidence of the importance of radiative corrections. The latter are known to be large, yielding a factor of 1−16αs/3π[27]. (The
and our predictions read:
σtheor(B+c) = |R(0)|2·4.92 nb/GeV3, σtheor(B∗c+) = |R(0)|2·5.63 nb/GeV3,
σtheor(B+c+B∗c+) = |R(0)|2·10.55 nb/GeV3, (14)
and
σtheor(B+)Br(B+→J/ψK+)=32.66 nb. (15)
The above data have to be combined with the experimentally measured [19] ratio of the branching fractions
Br(Bc→ J/ψ π+)/Br(Bc→J/ψ µν)=0.047 (16)
and with the theoretically calculated [20] decay branching fraction
Br(Bc→J/ψ π+)=0.0033. (17)
(The original [20] prediction of 0.0029 was corrected [4] to 0.0033 for the latest measurement of theBclifetime.)
Making the necessary substitutions and comparing Eqs. (3), (7), (10), and (13) with theoretical predictions we deduce the following estimations for the radial wave function:
|R(0)|2=4.39±2.00 GeV3 Ref. [1] |R(0)|2=6.79±0.08 GeV3 Ref. [2] |R(0)|2=5.52±0.11 GeV3 Ref. [3]
|R(0)|2=6.32±0.18 GeV3 Ref. [4] (18)
These can be summarised in a mean-square average value
|R(0)|2=5.78 GeV3 (19)
with an error of±0.64 GeV3and±1.07 GeV3at the 60% and 80% confidence level,
respec-tively.
We conclude our analysis with showing the ratio (13) in the differential form, as a function
of the transverse momentum for 3 separate rapidity intervals (see Fig. 1). The calculations and the data [4] are in good agreement in shape, thus indicating that the hard scattering par-tonic subprocesses are calculated correctly. The choice of the TMD gluon density is unimpor-tant since the gluon distributions cancel out in the ratio. The sensitivity to the renormalization scale is high, as a reflection of the fourth power ofαS(µ2R) in the key subprocess (1). The
cen-tral values of the cross sections (green histograms) correspond to the conventional choice
µ2R =m2B
cT; the theoretical uncertainty band (yellow area in Fig. 1) is obtained by varyingµR around its default value by a factor of 2.
Our extracted values of |R(0)|2 are systematically higher than the predictions [21] of potential models which range from 1.508 GeV3for the logarithmic potential [22], through 1.642 GeV3and 1.710 GeV3 for the Buchmuller-Tye [23] and power low [24] potentials up to 3.102 GeV3 for the Cornell potential [25]. An even lower value of the wave function is obtained in the lattice calculation of Ref. [26] which reports fBc =0.427 GeV, equivalent to |R(0)|2=1.2 GeV3.
This systematic discrepancy may be taken as an evidence of the importance of radiative corrections. The latter are known to be large, yielding a factor of 1−16αs/3π[27]. (The
QCD correction factor is obtained by transcription from QED; see, for example, [28].)
Figure 1.The ratio of theB(∗)
c toB+production cross sections (13) as a function of the transverse mo-mentum for three different rapidity intervals. Green histograms correspond to the conventional choice
α4S(m2BcT). Grey band indicates the statistical uncertainty in the determination of the B(c∗)radial wave function; yellow band represents uncertainties coming from the renormalization scale. The histograms reflect the replacementα4S(m2BcT)→α2S(m2BcT)α2S(m2cT). Experimental points are from Ref. [4].
Another possible interpretation may guess that the conventional choice of renormalization scale µR somehow overestimates the momentum transfer in the hard process. Indeed, in
addition to the initial gluons which bring all of the subprocess energy ˆs, there are internal gluons lines carrying some lower fraction of the energy-momentum. For example, for a gluon splitting intoc-quarks (which further assemble with b-quarks to form Bc’s) it looks more
reasonable to useµ2R=m2cT rather thanm2B
cT value. One can hardly tell a rigorous definition of an unique scale suitable for all Feynman diagrams, but the conventional choiceµ2R=m2B
cT looks too high. Under accepting a compromise expression α4S → α2S(m2
BcT)α 2
S(m2cT), the
estimated cross sections increase by approximately a factor of two, thus requiring a lower value of the wave function to fit the data. Performing the fitting procedure as described above (solid histograms in Fig. 1), we obtain
|R(0)|2 =3.02 GeV3 (20)
with an error of±0.25 GeV3and±0.50 GeV3at the 60% and 80% confidence level,
respec-tively. The latter is in closer agreement with the predictions of potential models, though still shows tension with the lattice result.
4 Conclusions
Our note presents the first attempt to evaluate theB(∗)
c wave function by considering theB(c∗)
We argue for a choice of renormalization scaleµ2Rdifferent from its conventional
defini-tion. We show that the estimates obtained from theB(∗)
c production cross sections under our
assumptionα4S → α2S(m2B cT)α
2
S(m2cT) are good in shape and are nearly consistent with the
predictions of potential models (though, probably, not with the lattice calculation).
5 Acknowledgments
This work was supported by the DESY Directorate in the framework of Moscow-DESY project on Monte Carlo implementations for HERA-LHC.
References
[1] F. Abeet al. (CDF Collab.), Phys. Rev. D 58, 112004 (1998). [2] T. Aaltonenet al. (CDF Collab.), Phys. Rev. D 93, 052001 (2016). [3] R. Aaijet al. (LHCb Collab.), Phys. Rev. Lett. 109, 132001 (2012). [4] R. Aaijet al. (LHCb Collab.), Phys. Rev. Lett. 114, 132001 (2015).
[5] S.P. Baranov, A.V. Lipatov, and N.P. Zotov, Phys. Rev. D 93, 094012 (2016). [6] S.P. Baranov and A.V. Lipatov, Phys. Rev. D 93, 034019 (2017).
[7] S.P. Baranov, Phys. At. Nuclei 60, 1322 (1997); Phys. Rev. D 54, 3228 (1996). [8] L.V. Gribov, E.M. Levin, and M.G. Ryskin, Phys. Rep. 100, 1 (1983);
E.M. Levin and M.G. Ryskin, Phys. Rep. 189, 267 (1990).
[9] C.-H. Chang, Y.-Q. Chen, G.-P. Han, and H.-T. Jiang, Phys. Lett. B 364, 78 (1995). [10] K. Kolodziej, A. Leike, and R. Rückl, Phys. Lett. B 355, 337 (1995).
[11] A.V. Berezhnoy, A.K. Likhoded, and M.V. Shevlyagin, Yad. Fiz. 58, 730 (1995); A.V. Berezhnoy, A.K. Likhoded, and O.P. Yushchenko, Phys. At. Nuclei 59, 709 (1996); A.V. Berezhnoy, V.V. Kiselev, and A.K. Likhoded, Z. Phys. A 356, 79 (1996); Phys. At. Nuclei 60, 100 (1997).
[12] F. Hautmann and H. Jung, Nucl. Phys. B 883, 1 (2014). [13] C.-H. Chang, Nucl. Phys. B172, 425 (1980).
[14] E.L. Berger and D. Jones, Phys. Rev. D 23, 1521 (1981). [15] R. Baier and R. Rückl, Phys. Lett. B 102, 364 (1981).
[16] C. Peterson, D. Schlatter, I. Schmitt, and P.M. Zerwas, Phys. Rev. D 27, 105 (1983). [17] A.V. Lipatov, S.P. Baranov, H. Jung, and M.A. Malyshev, Eur. Phys. J. C 78, 2 (2018). [18] C. Patrignaniet al. (Particle Data Group), Chin. Phys. C 40, 100001 (2016).
[19] R.Aaijet al. (LHCb Collab.), Phys. Rev. D 90, 032009 (2014).
[20] C.-F. Qiao, P. Sun, D. Yang, and R.-L. Zhu, Phys. Rev. D 89, 034008 (2014). [21] E.J. Eichten and C. Quigg, Phys. Rev. D 49, 5845 (1994).
[22] C. Quigg and J.L. Rosner, Phys. Lett. B 71, 153 (1977). [23] W. Buchmüller and S.-H. Tye, Phys. Rev. D 24, 132 (1981). [24] A. Martin, Phys. Lett. B 93, 338 (1980).
[25] E. Eichten, K. Gottfried, T. Kinoshita, K.D. Lane, and T.-M. Yan, Phys. Rev. D 17, 3090 (1978); 21, 313(E) (1980); 21, 203 (1980).
[26] C. McNeile, C.T.H. Davies, E. Follana, K. Hornbostel, and G.P. Lepage, Phys. Rev. D 86, 074503 (2012).
[27] R. Van Royen and V.F.Weisskopf, Nuovo Cimento 51, 583 (1967); [28] R. Barbieriet al., Nucl. Phys. B 105, 125 (1976);