Available Online atwww.ijcsmc.com
International Journal of Computer Science and Mobile Computing
A Monthly Journal of Computer Science and Information Technology
ISSN 2320–088X
IMPACT FACTOR: 6.199
IJCSMC, Vol. 8, Issue. 4, April 2019, pg.73 – 77
Forecasting Blood Donor Response
Using Predictive Modelling Approach
Chinmay Marade
1; Aalekh Pradeep
2; Dipak Mohanty
3; Chetan Patil
4 ¹Department of Computer Engineering, St. John College of Engineering and Management, India ²Department of Computer Engineering, St. John College of Engineering and Management, India ³Department of Computer Engineering, St. John College of Engineering and Management, India4
Department of Computer Engineering, St. John College of Engineering and Management, India
1
[email protected]; 2 [email protected]; 3 [email protected]; 4 [email protected]
Abstract— Blood and blood products are extremely essential for the medical treatment of almost all age groups. The primary supply of blood products within the world is mainly from volunteer donors. Thus, donor accomplishment and donor retention are critical factors for a blood bank for maintaining its blood supply. We tend to propose that our system will have a better understanding of donors' motivations to donate and personalizing their donation objectives would improve a blood bank's ability to secure and collect a more robust supply of blood. The projected system puts forward a solution to predict whether a particular donor can donate the blood or not within the coming month or not. This can facilitate the blood banks to forecast their stock of various varieties of blood groups and prepare them consequently.
Keywords— Predictive Modelling, Data Mining, Regression
I. INTRODUCTION
Health government agencies all over the globe are continuously increasing their investment in information technology. The utilization of technology in the health sector has given rise to the formation of strong electronic health records by numerous government or private health organizations and additionally by individual doctors or physicians. This monumental increment and increase in an assortment of knowledge from medical bodies have enabled the health and welfare organizations to harness the benefits of Big Data and Predictive Analytics to boost the standard and performance of their service. Better decisions can be made by regular use of information acquired along with quantitative as well as qualitative analysis and present improved results.
Analytics is being already utilized in many aspects of health look for support in clinical diagnosis decision making, remote observation of health with medical resource allocation. The advent of Big data in medical sciences has made-up some way for associate ever-increasing demand for informational professionals who can bridge the gap between information and medical sciences. Various models and algorithms are utilized to predict whether or not the blood of a specific type will be available or not.
likelihood that an individual will give blood in or not founded on his past donation behavior. There is a period slack between the demand of blood required by patients enduring excessive blood loss and the supply of blood from blood donation centers. We endeavor to improve this supply-request slack by structure a predictive model that distinguishes the potential donors.
II. ALGORITHMS AND MODELS USED
A. RFM Model
Different consumer-driven organizations utilize the RFM model (Recency, Frequency, and Monetary) to anticipate quantitatively whether a specific client will agitate or not, i.e., remain faithful to them and continue purchasing their items or services or not. They look at how as of late has the client made a buy, how over and again they made their buys, and what is the extent of the sum they spent. This causes the organization to single out clients who are going to switch their brand and allure them with rewarding ideas to make them remain steadfast. It depends on the promoting adage that 80% of the business originates from 20% of the clients.
In our system to predict whether a specific donor will give blood in the up and coming month or not we apply the RFM model and substitute its unique parameters with those applicable to donor’s measurements. The recency of item purchased is substituted with how recently the donor has given blood, the recurrence of buys has been replaced with the frequency at which the donor donated blood and the cash spent by the client is supplanted with the amount of blood given. Different algorithms used are as follows.
1) Support Vector Machines: Support vector machines (SVMs) are regression techniques broadly utilized for non-linear datasets. The part trap enables the user to manage non-linear data without agonizing over its direct detachability. The calculation changes the information into higher measurement into a linearly separable space and executes quadratic programming to expand the speed. The core of the count is that the information is changed into a linear space. The data is then isolated utilizing a hyperplane which is supported by data points. The best isolating hyperplane is one with the most extreme support vectors and the most significant edge.
2) Decision Tree Classifier
:
The decision tree is an essential algorithm for predictive modeling and can be utilized to outwardly and expressly represent decisions. It is a graphical portrayal that uses branching strategy to represent every single possible result dependent on specific conditions. In decision tree inner node represents a test on the attribute, the branch portrays the result and leaf speaks to a decision made after computing attribute.3) Perceptron
:
The perceptron is an algorithm for administered learning of binary classifiers. A binary classifier is a capacity which can choose whether or not information, spoken to by a vector of numbers, has a place with some particular class. It is a kind of linear classifier, i.e., a classification algorithm that makes its predictions dependent on a linear indicator work joining a lot of loads with the component vector.4) K Neighbours Classifier
:
The k-nearest neighbors (KNN) algorithm is a basic, simple to-execute administered machine learning algorithm that can be utilized to take care of both classification and regression issues. For every data point, the algorithm finds the k nearest perceptions and then characterizes the data point to the majority part. For the most part, the k nearest perceptions are portrayed as the ones with the littlest Euclidean distance to the data point underthought. For instance, if k = 3, and the three nearest perceptions to a particular data point have a place with the classes A, B, and A separately, the algorithm will characterize the data point into class A. On the off chance that k is even, there may be ties. To stay away from this, usually, loads are given to the perceptions so that closer perceptions are progressively dominant in figuring out which class the information point has a place.5) Naive Bayes Classifier: Naive Bayes is a primary strategy for building classifiers: models that allot class labels to issue occurrences represented as vectors of feature esteem, where the class names are drawn from some limited set. All naive Bayes classifiers expect that the estimation of a specific element is independent of the estimation of some other component, given the class variable. For instance, a fruit may be viewed as an apple if it is red, round, and around 10 cm in diameter. A naive Bayes classifier considers every one of these features to contribute independently to the likelihood that this fruit is an apple, paying little respect to any conceivable connections between the color, roundness, and diameter features.
B. Regression Model
algorithm which is used to predict a binary result. Granted a lot of independent factors, it gives the probability of a data point by fitting it to a logit function.
In data analytics, regression can be utilized to characterize the association and connection between a scalar dependent variable and a single or multiple independent variables. At the point when just a single independent variable is utilized, the prediction can be made through a linear regression model. For more than one explanatory variable multiple linear regression is used.
In the solution proposed in this paper, we will utilize the frequency of donating blood as the scalar dependent value and use the most recent month in which the blood was given as the independent factor. We will run these two factors through a regression model to predict whether the donor will provide blood later on or not.
III. DATASET
The data set for the application purposes has been taken from the open database of Blood Transfusion Service Centre. The data set comprises of 748 donors out of which are kept aside for 248 approvals purposed and the remaining are utilized for the model usage. The data set involves an individual record of donors which include their last donation month, how frequently they have donated blood and how much amount they have donated as of not long ago. The highlights estimated include R (Recency - months since last donation), F (Frequency - total number of donation), M (Monetary - total blood donated in c.c.), T (Time - months since first donation), and a binary variable representing whether the donor donated blood in March 2007 (1 stands for donating blood; 0 stands for not donating blood).
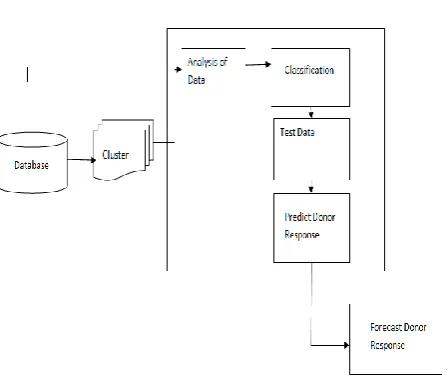
IV. METHODOLOGY
Fig. 1 Methodology Flow Diagram
The dataset was arbitrarily divided into a training set and testing set using a 70/30 train/test segment. Models are trained using different algorithms using the whole training set, just as trained on each cluster created within the training set. Each model was trained once using a validation set approach. Once models are trained, the test (for example holdout) information is fed into each trained model to quantify model execution. These measures enable us to check the generalizability of the remaining subset of data not utilized in the investigation and give us a vibe to the level of how over fit any models are to the training information.
A. RFM Model
The RFM model investigates all the given information and passes it through the RFM function to get the RFM score. The score is the indicator of whether the contributor will give blood or not. The RFM score is a binary yield. On the off chance that the yield for a specific giver is 0, at that point, it implies that he/she won't donate blood yet if it is 1, at that point, it means that they will donate blood.
B. Regression Model
V. RESULTS AND DISCUSSION
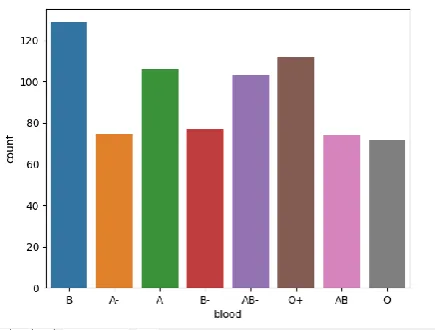
A. Taking Count of Particular Blood Group
From the entry in the datasets, blood donors are classified according to a particular blood group, and their total count is listed.
The count of a particular blood group and a graph for the count of various Blood donors are depicted here in the given chart below.
Fig. 2 Count of particular blood group
Fig. 3 Count of particular blood group depicted in the graph
B. Accuracy Measures
Here in our project, we have made use of classification algorithms for the classification. They are K-nearest Neighbours algorithm (K-NN), Gaussian Naive Bayes classifier also known as GNB, Support vector machines, Decision tree, and logistic regression. Accuracy results of each of this algorithm on the training set as well as test set are mentioned below.
C. Classification of Blood Donors
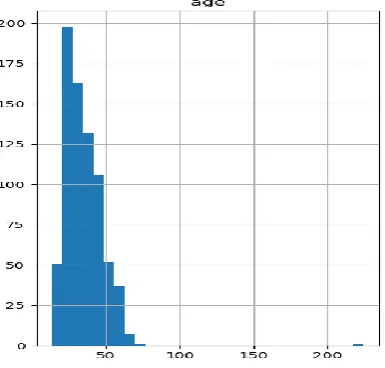
Classification of blood donors by age is also done for further analysis. The result of this is shown in the graph below.
Fig. 5 Classification of blood donor based on their age
D. Result Analysis
On the basis of implementation, we have done till now on the given dataset it has been concluded that peoples between the age groups of 25-35 are frequently donated. And based on the results after clustering and classification of blood donors we can predict whether a specific donor can donate blood or not using the RFM model and logistic regression.
VI. CONCLUSION
In this paper, we have thought about the execution of different binary classification algorithms not investigated beforehand on grouped data and non-clustered data to check whether we can all the more likely anticipate if an individual will give blood or not.
Since Big data has radically augmented the measure of data accessible to blood banks, they can utilize their immense database to be better get ready for future crises and spare lives all the while. This project plans to make appropriate and most extreme utilization of the blood donated by donors as a lot of patients die every year when they experience a deficiency of blood and are unfit to secure it in an appropriate measure of time.
ACKNOWLEDGEMENT
We thank our guide, Mr. Chetan Patil who has extended all valuable guidance and help through various stages for the development of the project. His valuable suggestions were of immense help throughout the project work.
We convey our sincere regards to our respected principal Dr. G.V.Mulgund and Head of Department Dr. G.A.
Walikar for their valuable support
.
R
EFERENCES
[1] Javed Akhtar Khan M.R. Alony, "A New Concept of Blood Bank Management System using Cloud
Computing for Rural Area," International Journal of Electrical, Electronics ISSN No. (Online): 2277-2626 and Computer Engineering 4(1): 20-26(2015)
[2] Maryam Ashoori, Zahra Taheri, "Using Clustering Methods for Identifying Blood Donors Behavior",
ICEEE Journal, Aug 20,21,22-2013.
[3] Ritika, Aman Paul, "Prediction of Blood Donors‟ Population using Data Mining Classification Technique",
International Journal of Advanced Research in Computer Science and Software Engineering, Volume 4, Issue 6, June 2014.
[4] https://www.kaggle.com/pcharambira/predicting-blood-donations Y. Li, G. Xia, 2010.
[5] DW Bates, S. S.-M. (2014). Big data in health care: using analytics to identify and manage high-risk and
high-cost patients. Health Affairs.