Available Online atwww.ijcsmc.com
International Journal of Computer Science and Mobile Computing
A Monthly Journal of Computer Science and Information Technology
ISSN 2320–088X
IMPACT FACTOR: 6.017
IJCSMC, Vol. 7, Issue. 6, June 2018, pg.37 – 48
IOS Based Aquascape Component Selection
Application Uses a Genetic Algorithm
Ilman Febrian
1, Ariyani Wardhana
2 ¹Information System & Mercubuana University, Indonesia²Information System & Mercubuana University, Indonesia 1
[email protected]; 2 [email protected]
Abstract- Aquascape became one of the hobby that began to demand by the people, ranging from lower middle class society and upper middle class society. Basically aquascape has the sense that art to create an ecosystem consisting of plants, wood, stone, and fish in an aquarium. Many people like and want to create aquascape but do not know what components are needed to create an aquascape. Therefore, an idea for designing an application that can determine what components are needed to create aquascape based on the cost. Application of aquascape component selection is designed with Prototype system development method. Analysis and design of this application is described in the form of use case diagrams, class diagrams, sequence diagrams, mockups, and database design. As for the selection of aquascape components using genetic algorithm. The result of this research is in the form of analysis and design of application of aquascape component selection which can run on device having IOS operating system.
Keywords: Aquascape, Applications, Prototype, Genetic Algorithm, IOS
I. INTRODUCTION
Every human being has a sense of saturation in carrying out daily activities. There are many ways that can be done to eliminate saturation, one of which is to do activities that we like the hobby. Currently a lot of hobbies that can be done, one of which is the hobby of making aquascape that began to demand by various circles of society in recent years. There are still many people who do not know the meaning of aquascape. Aquascape is the art of positioning stones, plants, driftwood, and corals in an aquarium (Martin, 2013).
II. LITERATURE REVIEW 2.1 Aquascape
Aquascape is an aquarium containing ornamental fish and ornamental plants whose appearance, design, layout and water circulation are made as closely as possible with the original habitat to form a good ecosystem (Widjaja, 2013).
2.2 IOS
IOS is the name of the operative system delivered by apple with every mobile device sold (except for the Apple Watch that has its OS called watchOS). The system is currently in version number 11. Although we could develop our applications for older systems, this is not recommended unless we have very strong reasons to do so. Statistics show that at any given time, the latest operative system is installed in over 90% of active devices, and therefore most developers only create applications for the latest version of iOS (Gauchat, 2017).
2.3 Unified Modeling Language
The unified modeling language (UML) is a graphical language for visualizing, specifying, constructing, and documenting the artifacts of a software-intensive system. The UML gives ypu standart way to write a system's blueprints, covering conceptual things such as business processes and system functions, as well as concrete things such as classes written in a specific programming language, database schemas, and reusable software components (Booch, Rumbaugh, & Jacobson, 2005).
2.4 Systems Development Method
The system development method used to create this system is the Prototype method. Selection of this method is based on the advantage of getting fast feedback from users. Prototype method is suitable to make a system to be developed again. The early stages of the prototype method is the communication stage, at this stage the analysis of the needs of users. After obtaining the user's needs, rapid planning and rapid design modeling will be made at this stage in the design of the application based on software aspects that can be viewed by the user (eg display format or user interface design). After the design is made then the next stage is making prototype based on the design that has been made in the previous stage. The next stage of the prototype that has been made will be submitted to the user's goal to evaluate the prototype that has been made before and provide feedback that is used to improve the needs of users (Pressman, 2010).
Figure 1. Stages of the Prototype method
2.5 Genetic Algorithm
Figure 2. Genetic Algorithm Flowchart
III.RESULTS AND DISCUSSION 3.1 Requirement Analysis
Applications to be created have a purpose to facilitate the people who want to make aquascape in terms of aquascape component selection based on the cost. This application will be created on IOS based mobile devices. In the analysis and design stage to determine what components are needed in making aquascape using Genetic Algorithm.
3.2 Genetic Algorithm Calculation
An example of a Genetic Algorithm calculation used to solve the problem of selecting the Aquascape component. There is an equation as follows:
Basic Fertilizer + Liquid Fertilizer + Growing Media + Carbon Dioxide + Lamp + Filter <= Cost
The purpose is to find the value of each component of the aquascape and if the value of each component is summed up the result does not exceed the cost incurred by the user.
3.2.1 Making Chromosomes
Because the sought is the value of basic fertilizer, liquid fertilizer, growing media, carbon dioxide, lamps, and filters then these variables serve as genes to make chromosomes.
3.2.2 Creating Initial Population
The process of making the initial population is done by giving the initial value of the genes. The sample specified number of population is 5, then:
Chromosome [1] = [PD; PC; MT; K; L; F] = [ 30000; 150000; 150000; 250000; 400000; 70000]
Chromosome [2] = [PD; PC; MT; K; L; F] = [130000; 40000; 50000; 800000; 120000; 170000]
Chromosome [3] = [PD; PC; MT; K; L; F] = [ 60000; 45000; 30000; 50000; 70000; 350000]
Chromosome [4] = [PD; PC; MT; K; L; F] = [110000; 100000; 80000; 600000; 240000; 350000]
Explanation:
PD = Basic Fertilizer, PC = Liquid Fertilizer, MT = Growing Media, K = Carbon Dioxide, L = Lamp, F = Filter
3.2.3 Chromosome Evaluation
Based on the problem to be solved is to find the value of each variable which, if the summed result does not exceed the cost entered by the user, then the objective function that can be used to get the solution is as follows:
Objective Function (Chromosome) = (PD + PC + MT + K + L+ F) – Cost
Example of cost entered by the user is 500000, then the result of the calculation of objective functions are:
Objective Function(Chromosome[1]) = 550000
Objective Function(Chromosome[2]) = 810000
Objective Function(Chromosome[3]) = 105000
Objective Function(Chromosome[4]) = 980000
Objective Function(Chromosome[5]) = 375000 Total = 2820000
Average Objective Function = Total / Sum Population = 2820000 / 5 = 564000
3.2.4 Selection
In the selection phase, chromosome making process which has a small objective function has high probability value. Therefore the function can be used as follows:
Fitness = (1 / (Objective Function + 1))
Then the calculation of fitness values are :
Fitness[1] = 0.0000018
Fitness[2] = 0.0000012
Fitness[3] = 0.0000095
Fitness[4] = 0.0000010
Fitness[5] = 0.0000027 Total = 0.0000162
The next stage is to calculate the probability value with the following formula:
P[i] = Fitness[i] / Total
Then the results of the calculation of probability values are:
P[1] = 0.1111
P[2] = 0.0741
P[3] = 0.5864
P[4] = 0.0617
P[5] = 0.1667
The next step is calculate the cumulative value of probability, then the result of the calculation is :
C[1] = 0.1111
C[2] = 0.1852
C[3] = 0.7716
C[4] = 0.8333
C[5] = 1
The next step generates a random value R with a range of 0 to 1:
R[1] = 0.8161
R[2] = 0.2018
R[3] = 0.1199
R[4] = 0.9069
After obtaining the cumulative value of probability it can be done selection process using roulete-wheel. The process is to generate a random value R with a range of 0 to 1. If R [k] <C [1] then select chromosome 1 as the parent, if the condition is not met then select chromosome K as parent with condition C [k-1 ] <R <C [k]. Roulette wheel rotation is done as much as the number of population is 5 times and in each round, select one chromosome for new population. Then the new chromosome from the selection process as follows:
Chromosome [1] = [PD; PC; MT; K; L; F] = [110000; 100000; 80000; 600000; 240000; 350000]
Chromosome [2] = [PD; PC; MT; K; L; F] = [ 60000; 45000; 30000; 50000; 70000; 350000]
Chromosome [3] = [PD; PC; MT; K; L; F] = [130000; 40000; 50000; 800000; 120000; 170000]
Chromosome [4] = [PD; PC; MT; K; L; F] = [ 55000; 40000; 75000; 400000; 180000; 125000]
Chromosome [5] = [PD; PC; MT; K; L; F] = [ 60000; 45000; 30000; 50000; 70000; 350000]
3.2.5 Crossover
After the selection process then the next process is a crossover process. One method used for the crossover process is a one-cut point, which is the random selection of a single position on the parent chromosome and then a gene exchange. The chromosome to serve as the parent is randomly selected and the number of crossover chromosomes is affected by the crossover_rate (ρc) parameter.
For example specified crossover_rate = 25% or 0.25. The first process is to generate a random number R as many as the population :
R[1] = 0.5995
R[2] = 0.2001
R[3] = 0.1996
R[4] = 0.7711
R[5] = 0.1234
The selection of chromosomes as parent is done by condition if R [k] <ρc, of the random number R is then the parent is chromosome [2], chromosome [3] and chromosome [5]. After the parent selection process is completed, the next process is to determine the crossover position by generating random numbers ranging from 1 to (chromosome-1), in which case the random number generated is 1 - 5. For the cross-cut-point position selected using the number random 1-5 as much as the number of crossovers that occur, for example:
C[1] = 4
C[2] = 2
C[3] = 1
Offspring[2] = Chromosome [2] > < Chromosome [3]
= [60000;45000;30000;50000;70000;350000] > < [130000;40000;50000;800000;120000;170000] = [130000;40000;50000;50000;120000;170000]
Offspring[3] = Chromosome [3] > < Chromosome [5]
= [130000;40000;50000;800000;120000;170000] > < [60000;45000;30000;50000;70000;350000] = [60000;40000;30000;50000;70000;350000]
Offspring[5] = Chromosome [5] > < Chromosome [2]
= [60000;45000;30000;50000;70000;350000] > < [60000;45000;30000;50000;70000;350000] = [60000;45000;30000;50000;70000;350000]
New chromosomes after going through the crossover process are :
Chromosome [1] = [PD; PC; MT; K; L; F] = [110000; 100000; 80000; 600000; 240000; 350000]
Chromosome [2] = [PD; PC; MT; K; L; F] = [130000; 40000; 50000; 50000; 120000; 170000]
Chromosome [3] = [PD; PC; MT; K; L; F] = [ 60000; 40000; 30000; 50000; 70000; 350000]
Chromosome [4] = [PD; PC; MT; K; L; F] = [ 55000; 40000; 75000; 400000; 180000; 125000]
Chromosome [5] = [PD; PC; MT; K; L; F] = [ 60000; 45000; 30000; 50000; 70000; 350000]
3.2.6 Mutation
The next step is the mutation process by substituting one randomly selected gene with a new value obtained randomly. The process first calculates the total length of genes present in one population with the following formula :
Then get the total gene = 6 * 5 = 30. After gene obtained total then subsequently generate a random number 1 to total gen. For example specified mutation_rate 10% or 0.1 then: Mutations = 0.1 * 30 = 3
After a random number is generated the positions of genes 4, 7, and 30 are mutated. Next the random number generated is 370000, 85000, 320000 then the chromosome population after undergoing the mutation process are :
Chromosome [1] = [PD; PC; MT; K; L; F] = [110000; 100000; 80000; 370000; 240000; 350000]
Chromosome [2] = [PD; PC; MT; K; L; F] = [ 85000; 40000; 50000; 50000; 120000; 170000]
Chromosome [3] = [PD; PC; MT; K; L; F] = [ 60000; 40000; 30000; 50000; 70000; 350000]
Chromosome [4] = [PD; PC; MT; K; L; F] = [ 55000; 40000; 75000; 400000; 180000; 125000]
Chromosome [5] = [PD; PC; MT; K; L; F] = [ 60000; 45000; 30000; 50000; 70000; 320000]
Objective Function (Chromosome[1]) = 750000
Objective Function (Chromosome[2]) = 15000
Objective Function (Chromosome[3]) = 100000
Objective Function (Chromosome[4]) = 375000
Objective Function (Chromosome[5]) = 75000 Total = 1315000
Average Objective Function = Total / Sum Population = 1315000 / 5 = 263000
3.3 System Design
System design is made based on functional requirements and described by using UML (Unified Modeling Language)
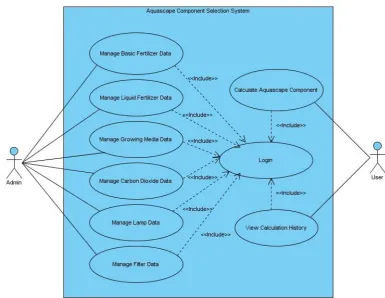
3.3.1 Use Case Diagram
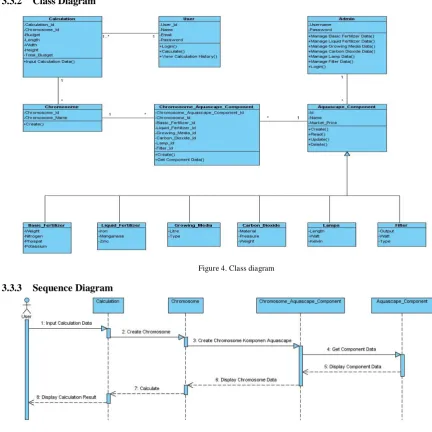
3.3.2 Class Diagram
Figure 4. Class diagram
3.3.3 Sequence Diagram
Figure 5. Sequence diagram 3.3.4 Administrator Prototype Design
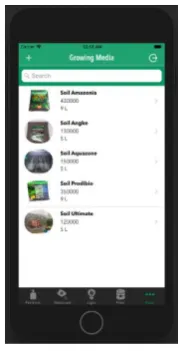
Figure 9. Lamp page Figure 10. Filter page Figure 11. Growing Media page
Figure 12. Carbon dioxide page Figure 13. Insert filter page Figure 14. Update filter page
3.3.5 User Prototype Design
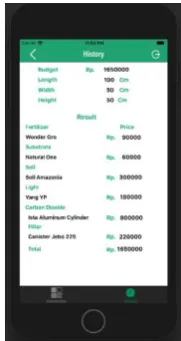
Figure 18. Calculation page Figure 19. History page
3.3.6 Proposed Testing
Table 1. Proposed Testing
No Purpose Test Example Expected Result Tested by Testing Date
1
To check whether the admin login system is running or not.
The system can display the admin main page if the username and password entered are correct.
ILMAN
2
To check whether the system can insert filter data into the database on the insert filter page.
The system can save filter data into the database if all fields are filled correctly.
ILMAN
3
To check whether the system can display a data filter on the page filter.
The system can display filter data without any error.
ILMAN
4
To check whether the system can change filter data on filter update page.
The system can change the filter data on the update filter page if the changed
5
To check whether the system can delete filter data on the filter page.
The system can delete filter data without any error.
ILMAN
6
To check whether the system can search filter data on the filter page.
The system can display search results by filter name, market price, or filter output.
ILMAN
7
To check whether the user login system is running or not.
The system can display the user main page if the email and password entered are
correct. ILMAN
8
To check whether the system can perform
aquascape component calculations on the calculation page.
The system can perform aquascape component
calculation if all the required data is entered correctly.
ILMAN
9
To check whether the system can display the history of calculations on the history page.
The system can display the calculation history if the user has done the previous
calculation. ILMAN
3.3.7 Specification
For application development Hardware :
Processor Intel Core i5 dual-core 1.8GHz
Ram 4 Gb
Intel HD Graphics 5000 screen
Internal Memory 128 Gb
13,3 inch Monitor
Software :
MacOS High Sierra Operating System
Xcode 9
Swift 4 Programming Language
For testing application
Hardware
:
Processor Apple A11 Bionic
Ram 2 Gb
HD Retina Display
Internal Memory 32 Gb
5,5 inch Monitor
Software :
IOS 11 Operating System
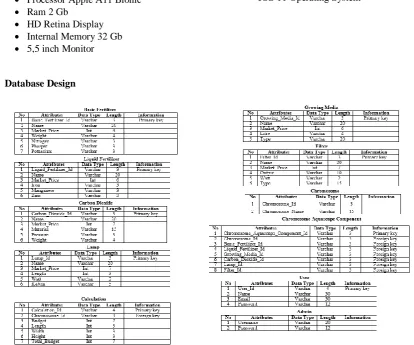
3.3.8 Database Design
Figure 20. Database design
IV.CONCLUSIONS
From the analysis and design of Application Selection of Aquascape Components that have been described above it can be concluded as follows:
Analysis and design of this application if implemented will facilitate aquascape beginner or community aquascape to create aquascape in terms of aquascape component selection in accordance with the cost.
Analysis and design of the Selection Application The Aquascape component is illustrated in the form of use case diagrams, class diagrams, sequence diagrams, mockups, and database designs, which are expected to be implemented in the future.
Analysis and design of calculation systems to solve the problem of choosing aquascape component using Genetic Algorithm.
V. SUGGESTION
Based on the analysis and design of Application Selection of Aquascape Components can be given some suggestions as follows :
For future applications are expected to be developed more widely such as the addition of calculated features of dissolved carbon dioxide, calculation of light needs, calculation of fertilizer needs and others.
R
EFERENCES
[1]. Febriyana, R., & Mahmudy, W. F. (2016). Penjadwalan Kapal Penyeberangan Menggunakan
Algoritma Genetika. Jurnal Teknologi Informasi dan Ilmu Komputer (JTIIK) Vol. 3, No. 1.
[2]. Gauchat, J. D. (2017). iOS Apps for Masterminds, 3rd Edition. Toronto: Mink Books.
[3]. Grady Booch, J. R. (2005). The Unified Modelling Language User Guide, Second Edition.
Addison Wesley Professional.
[4]. Hijriana, N. (2015). Penerapan Metode Algoritma Genetika Uuntuk Permasalahan Penjadwalan
Perawat. INFO TEKNIK Vol. 16, No. 1.
[5]. Kurniawan, A., Satoto, K. I., & Kridalukmana, R. (2015). Perancangan dan Pengembangan
Permainan Jelajah Indonesia Berbasis iOS Menggunakan GameSalad. Jurnal Teknologi dan Sistem Komputer Vol. 3, No. 1.
[6]. Kusuma, A. I., Widodo, A. W., & Fauzi, M. A. (2018). Optimasi Sisa Bahan Baku Pada Industri
Mebel Menggunakan Algoritma Genetika. Jurnal Pengembangan Teknologi Informasi dan Ilmu Komputer Vol. 2, No. 3.
[7]. L, N. V., Pranggono, H., & Syakirin, M. B. (2016). Pengaruh Penggunaan Pasir Malang Sebagai
Filter Dalam Media Air Limbah Batik Terhadap Kelangsungan Hidup Ikan Koi (Cyprinus carpio Linn). PENA Akuatika Vol. 14, No. 1.
[8]. Manggolo, I., Marzuki, M. I., & Alaydrus, M. (2011). Optimalisasi Perencanaan Jaringan Akses
Serat Optik Fiber To The Home Menggunakan Algoritma Genetika. InComTech, Jurnal Telekomunikasi dan Komputer, vol. 2, no.2.
[9]. Martin, M. (2013). Aquascaping: Landscaping Like a Pro Aquarist's Guide to Planted Tank
Aesthetics and Design, Second Edition. Ubiquitous Publishing.
[10].Pressman, R. S. (2010). Software Engineering A Practitioner’s Approach, Seventh Edition. New
York: McGraw-Hill.
[11].Priambodo, B. (2015). Pengembangan Aplikasi Penjadwalan Kuliah Semester I Menggunakan
Algoritma Genetika. JURNAL ILMIAH FIFO, Vol. VII, No.1.
[12]. Putri, M., Muhammad, F., Hidayat, J., & Raharjo, S. (2016). Pengaruh Beberapa Konsentrasi Molase terhadap Kualitas Air Pada Akuarium Ikan Bandeng. Jurnal Biologi Vol. 5, No. 2. [13]. Satzinger, J. W., Jackson, R. B., & Burd, S. D. (2012). Systems Analysis and Design in a
Changing World, Sixth Edition. Boston: Joe Sabatino.
[14]. Suharmon, R., & Bahriun, T. A. (2014). Perancangan Aalat Pemberi Makan Ikan Otomatis dan
Pemantau Keadaan Akuarium Berbasis Mikrokontroler ATMEGA8535 . SINGUDA ENSIKOM VOL. 7, NO. 1.
[15]. Suprayogi, D. A., & Mahmudy, W. F. (2015). Penerapan Algoritma Genetika Traveling
Salesman Problem with Time Window: Studi Kasus Rute Antar Jemput Laundry . Jurnal Buana Informatika Vol. 6, No. 2.
[16]. Taufiq, M. N., Dewi, C., & Mahmudy, W. F. (2017). Optimasi Komposisi Pakan Untuk
Penggemukkan Sapi Potong Menggunakan Algoritma Genetika. Jurnal Pengembangan Teknologi Informasi dan Ilmu Komputer Vol. 1, No. 7.
[17]. Wardana, A. K., & Hartati, S. (2017). Sistem Penjadwalan Pertandingan Pencak Silat Berbasis Algoritme Genetika . IJCCS Vol. 11, No. 2.