Emerging nuclear collectivity in
124−130Te
B. J. Coombes1, A. E. Stuchbery1, J. M. Allmond2, A. Gargano3, J. T. H. Dowie1, G. Georgiev4, M. S. M. Gerathy1,
T. J. Gray1, T. Kibédi1, G. J. Lane1, B. P. McCormick1, A. J. Mitchell1, N. J. Spinks1, and B. P. E. Tee1
1Department of Nuclear Physics, Research School of Physics, The Australian National University, Canberra, ACT, 2601, Australia
2Physics Division, Oak Ridge National Laboratory, Oak Ridge, Tennessee 37831, USA
3Istituto Nazionale di Fisica Nucleare, Complesso Universitario di Monte S. Angelo, Via Cintia, I-80126 Napoli, Italy
4CSNSM, CNRS/IN2P3; Université Paris-Sud, UMR8609, F-91405 ORSAY-Campus, France
Abstract.The emergence of nuclear collectivity near doubly-magic132Sn was explored along the stable, even-even124−130Te isotopes. Preliminary measurements of theB(E2; 4+
1 → 2+1) transition strengths are reported from Coulomb excitation experiments primarily aimed at measuring thegfactors of the 4+1 states. Isotopically enriched Te targets were excited by 198-205 MeV58Ni beams. A comparison of transition strengths obtained is made to large-scale shell-model calculations with successes and limitations discussed.
1 Introduction
Studies of the emergence of collective excitations across isotopic chains give essential information on the degrees of freedom important in creating nuclear collectivity and the nature of the collectivity that develops. The stable even isotopes from120Te to130Te are two protons away from the Z=50 closed shell and the highest mass isotopes are close to theN=82 closed neutron shell. They can be compared to the Cd isotopes (Z=48) with two proton holes, which have been more extensively studied. There is an ongoing discussion on the nature of the collectivity that, in the Cd isotopes, is traditionally associated with anharmonic vi-brations [1–6].
The Te isotopes show increasing collectivity as they depart further from doubly-magic132Sn. The large num-ber of stable Te isotopes allows an extensive and system-atic study of the emergence of collectivity across a single isotopic chain by Coulomb excitation.
Recent work on the Xe isotopes (Z=54) has suggested that the g factors and E2 transition strengths for states above the first 2+states converge more slowly to the col-lective limits than the 2+1 states and have suggested that collectivity begins with the 2+1 state before moving to the higher excited states [7]. A natural next step in the study of such phenomena is the Coulomb excitation of the Te isotopes, which are closer to the Z=50 shell clo-sure. The Te isotopes lie between the Xe and Sn isotopes and have been investigated previously [8–15] with com-parison made to the harmonic vibrational model, however, the transition strengths between the 2+1 and 4+1 have not previously been reported in128,130Te. The previous mea-surement in126Te has a large (∼40%) uncertainty. In the unstable isotopes132,134Te, the 6+states are isomeric and have previously measured lifetimes andgfactors; also the 4+1 state has a known lifetime in 134Te [16, 17]. These
properties are largely consistent with a (πg7/2)2 seniority
structure [18, 19]. The systematic development of collec-tivity is observable inB(E2; 2+1 →0+1) values, which show a gradual increase in transition strength towards the neu-tron mid-shell. In this work, we aim to determine the fea-sibility of using data collected in a recent transient-field
g-factor measurement [20] to investigate the changing col-lectivity of the 4+1 → 2+1 transition strengths in the stable, even-even124−130Te isotopes including the previously un-reported values in128,130Te.
2 Experiment
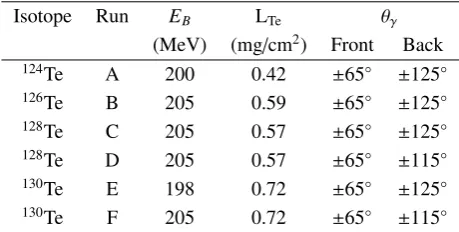
Enriched 124−130Te targets of ∼0.6 mg/cm2 with ∼5 mg/cm2 iron and ∼6-9 mg/cm2 copper backing layers were bombarded with 198-205 MeV58Ni ions at a beam current of∼1.5 pnA. Backscattered beam particle-γ coincidences were measured with an XIA Pixie-16 digital pulse processor [21]. The experiment was performed with beams from the ANU 14UD Pelletron accelerator and with the ANU hyperfine spectrometer [22]. The target was kept at a constant temperature of ∼4 K by a Sumitomo RDK-408D cryocooler to help prevent beam-induced damage to the target. Cooling the target was necessary due to the relatively low melting point of Te (449.5◦C). The
Table 1.Experimental details:EBis the58Ni beam energy and
LTeis the target thickness. The anglesθγare the polar angles to the centres of the Clover detectors.
Isotope Run EB LTe θγ
(MeV) (mg/cm2) Front Back
124Te A 200 0.42 ±65◦ ±125◦
126Te B 205 0.59 ±65◦ ±125◦
128Te C 205 0.57 ±65◦ ±125◦
128Te D 205 0.57 ±65◦ ±115◦
130Te E 198 0.72 ±65◦ ±125◦
130Te F 205 0.72 ±65◦ ±115◦
large amplitude and low-frequency oscillations under beam which could be readily filtered out by the analog electronics modules. (We have yet to fully understand the origin of this behaviour.) The processed signals were input to the digital data acquisition system. Details of beam energies, target thickness andγ-ray detector angles are given in Table 1. Detector angles were chosen to be close to the angle of maximum sensitivity in theg-factor measurement.
3 Results and Discussion
The transitions observed in the Coulomb excitation mea-surements are listed in Tables 2-5. Several transitions were significantly broadened by in-flight Doppler shift, causing overlap with other transitions. As some of the transitions are not well separated, the intensities, especially for the weaker transitions, can be difficult to extract. Figures 1 and 2 show examples of the measured energy spectra.
Experimental data were analysed using the semi-classical Coulomb-excitation code Gosia[24]. The stop-ping powers of Ziegler [25] were used where required. Transition strengths were extracted relative to the known 2+1 → 0+1 transition strengths [26–29]. Analysis was also performed to measure transition strengths relative to the recently measured58Ni transition strength [30]. The
re-sulting 2+1 →0+1 transition strengths agree with the previ-ously measured values within∼10%, with the exception of
124Te, which is found to be 20% lower. The experimental
beam energies were chosen to maximize excitation for the simultaneousg-factor measurement. Coulomb excitation is termed safe when there is no significant overlap of the projectile and target wavefunctions. A common method to ensure this is to maintain a nuclear surface separation of 5 fm [24]. In the present experiment, for a head-on collision, this corresponds to∼69% of the Coulomb bar-rier with the Coulomb barbar-rier as defined in Ref. [31] and a nuclear radius parameter of r0 = 1.25 fm. The
exci-tation occurs at∼72-75% of the barrier and is therefore not purely safe Coulomb excitation, which increases the uncertainty in the measured B(E2) values as the nuclear effects can interfere constructively or destructively. The magnitude of the (typically destructive) nuclear interfer-ence can be estimated by a Ptolemy[32] distorted wave Born approximation calculation. A worst-case-scenario
calculation suggested that up to a 40% difference could be caused by the nuclear interactions at the scattering an-gles used in the present work. It is not clear that this effect would cancel in the relative transition-strength analysis. It is possible to perform an analysis using coupled calcu-lations including the nuclear effects [31], however these calculations have not been performed.
Although the data taken in the present experiment were insufficient to determine the signs of the matrix elements involved in Coulomb excitation, the results can be sen-sitive to the relative signs. This effect can be large and cannot be determined without measurements that include multiple scattering angles or beam energies.
Despite these difficulties, an exploratory analysis of the excited-state Coulomb excitation was performed. The aim of this analysis was to determine the 4+1 → 2+1 ma-trix elements, while other mama-trix elements were allowed to vary where a measurement of the relevant yield was possi-ble. There are a number of previously measured lifetimes of higher excited states and mixing ratios of the transi-tions between higher excited states [8–10, 26–29] which were used to constrain matrix elements that could not be determined in the current experiment. The signs of all ma-trix elements, including those determined from previously measured lifetimes, were taken to be those predicted by shell-model calculations, as were the matrix elements in-volving weakly populated states.
Shell-model calculations were performed with the large-scale shell-model code Antoine [33]. Calculations were performed with a100Sn core and with two body
ma-trix elements from the CD-Bonn potential. Empirical ef-fective charges ofep = 1.7eanden = 0.9ewere used in the calculations, which are similar to those used in other studies in the region [7, 34]. Both protons and neutrons were allowed to occupy the full (g7/2,d5/2,d3/2,s1/2,h11/2)
model space. The transition strengths predicted by the shell-model calculations and experimentally determined
B(E2) values are shown in Table 6. The signs predicted by shell-model calculations for theE2 matrix element be-tween the 2+1 and 4+1 states denotedM23(relative to a
pos-itive 2+1 →0+1 matrix element) are given next to the shell-model values in Table 6. The effect of changing the sign ofM23can be large and is given in the same table for
con-text. This sensitivity is due to the significant excitation strength from paths through higher excited states, such as through excitations to the 4+2 state. The shell-model calcu-lations are reasonably successful in reproducing the transi-tion strengths for the 2+1 →0+1 transitions. However, there is a consistent underestimation of∼10%. The 4+1 → 2+1 transition strengths determined in the present work agree well with the shell-model calculations close to132Sn, how-ever, the calculations do not capture the increase in transi-tion strength suggested by the present data as the number of neutron-holes increases away from132Sn.
Table 2.Observed transitions in124Te. Level energies, spins and parities taken from Ref. [26].
Iπi Ei Eγ Iπf Ef
(keV) (keV) (keV)
2+1 602.7 602.8 0+1 0
4+1 1248.6 645.7 2+1 602.7 2+2 1325.5 722.4 2+1 602.7
1325.7 0+1 0
0+2 1657.3 1054.7 2+1 602.7 6+1 1747.0 498.3 4+1 1248.6 0+3 1882.9 556.9 2+2 1325.5 4+2 1957.9 ∼710 4+1 1248.6
∼1350 2+1 602.7
Table 3.Observed transitions in126Te. Level energies, spins and parities taken from Ref. [27].
Iπi Ei Eγ Iπf Ef
(keV) (keV) (keV)
2+1 666.4 666.4 0+1 0
4+1 1361.4 694.9 2+1 666.4 2+2 1420.2 753.8 2+1 666.4
1420.2 0+1 0
6+1 1776.2 414.7 4+1 1361.4 0+2 1873.4 1207.3 2+1 666.4
23 2045.2 2045.2 0+1 0
Table 4.Observed transitions in128Te. Level energies, spins and parities taken from Ref. [28].
Iπi Ei Eγ Iπf Ef
(keV) (keV) (keV)
2+1 743.2 742.9 0+1 0
4+1 1497.0 753.6 2+1 743.2 2+2 1520.0 776.4 2+1 743.2
1520.3 0+1 0
6+1 1811.1 314.0 4+1 1497.0 0+2 1978.8 1235.6 2+1 743.2 4+2 2027.8 530.7 4+1 1497.0 4+2 2027.8 1284.6 2+1 743.2
Table 5.Observed transitions in130Te. Level energies, spins and parities taken from Ref. [29].
Iπi Ei Eγ Iπf Ef
(keV) (keV) (keV)
2+1 839.5 839.4 0+1 0
2+2 1588.3 748.4 2+1 839.5
1588.0 0+1 0
4+1 1633.0 793.3 2+1 839.5 2+3 1885.7 ∼1045 2+1 839.5 (0)+2 1964.8 1125.2 2+1 839.5 4+2 1981.5 348.6 2+1 1633.0
0 2 4 6 8 10 12 14 16 18 20
0 200 400 600 800 1000 1200 1400 1600 41→2
1
22→21 58
Ni 21→0
1 129
Te
131
I
59
Ni
130
Te
x10x10
3 Counts
Energy (keV)
Figure 1. Energy spectrum taken at 65◦
in Run F as defined in Table 1 (enriched130Te target). The decay of the first excited state has been scaled down by a factor of 10.
3 4 5 6 7
02→21 42→2
1 23→2
1 129
Te
x10
2 Counts
3 4 5 6 7
900 950 1000 1050 1100 1150 1200 02→21
42→21
23→2
1 129
Te
x10
2 Counts
Energy (keV)
Figure 2.Spectra for the region from 900 to 1200 keV in Run F as defined in Table 1 (enriched130Te target). The top and bottom panels display data from 65◦
and 115◦
detectors, respectively.
has not yet been reached at 124Te. The lower mass
iso-topes120,122,124Te have known transition strengths between
the 4+1 and 2+1 states [35]. The only overlapping measure-ments between these and present studies are for the124Te B(E2; 4+1 → 2+1) and B(E2; 2+2 → 2+1) values. The pre-liminary measured ratio ofB(E2; 4+1 → 21+)/B(E2; 2+1 →
0+1) =1.7(3) differs at the 1.8σlevel from the previously reported value (1.16(5)). The discrepancy is not so large as to be unreasonable; however, it must be resolved to under-stand the nature of the developing collectivity. There is a similar difference in theB(E2; 2+2 →2+1)/B(E2; 2+1 →0+1) values between the same previous experiment and the present work. The present value of 1.9(4) differs from the previously determined value of 1.12(18) by 1.8σ. In the present analysis, the inferred 2+2 → 2+1 transition strength is particularly sensitive to the transition strengths between weakly excited states. It is worth noting that the present measurement compares well with transitions out of the 6+ states where previous transition strengths are known be-tween the 6+1 and 4+1 states. These values may be com-pared in Tables 6 and 7. As stated previously, the Coulomb excitation here is not purely safe, which may explain the differences between the present and previous work.
Table 6.Transition strengths in124−130Te. Data from Nuclear Data Sheets [26–29] and the present work. Transition strengths measured in this work are given without uncertainties. A 20% uncertainty
is assumed for all measured transition strengths. Experimental values are given next to the signs of the matrix elements predicted by the shell-calculations (SM). Details of the shell-model calculations
are given in the text.
Isotope Sign(M23) B(E2; 2+1 →0+1) B(E2; 4+1 →2+1) B(E2; 6+1 →4+1)
(W.u.) (W.u.) (W.u.)
Exp SM Present Previous SM Exp SM
124Te + 48
124Te − 31.1(5) 26 54 35.8(16)a 30 27 17
126Te + 25.4(7) 23 31 34(16)b 25 17.8(6) 14
126Te − 36
128Te + 19.68(18) 18 19 19 9.7(6) 10
128Te − 26
130Te + 18
130Te − 15.1(3) 14 14 13 6.1(3) 7
aRef. [35] bRef. [36]
Table 7.Transition strengths in124−130Te. A 20% uncertainty is assumed for all measured transition strengths. Experimental
(Exp) and shell-model (SM) values are presented.
Isotope Ei Iiπ Ef Iπf B(E2)
(keV) (keV) (W.u.)
Exp SM
124Te 1325.5 2+
2 602.7 2+1 58 32
124Te 1747.0 6+
1 1248.6 4+1 25 17
126Te 1420.2 2+
2 666.4 2+1 34 28
126Te 1776.2 6+
1 1361.4 4+1 18 14
128Te 1520.0 2+
2 743.2 2+1 26 14
128Te 1811.1 6+
1 1497.0 4+1 15 10
130Te 1588.3 2+
2 839.5 2+1 12 5.4
130Te 1964.8 (0)+
2 839.5 2+1 0.7 1.4
0 10 20 30 40 50 60
124 126 128 130
2+→0+ 4+→2+ 6+→4+
B(E2) (W.u.)
A
Figure 3. Systematics of measuredB(E2) values across the Te isotopes. Data from this work and Nuclear Data Sheets [26–29].
Neutron transfer reactions were observed in runs B-F, clearly showing that direct nuclear effects are present and therefore that the Coulomb excitation cannot be assumed safe; the present results must be considered preliminary. Measurements at safe energies are clearly required.
Additional measurements are anticipated. The present data allow for informed planning of Coulomb excitation measurements on the Te isotopes including the number and identity of excited states expected in such measure-ments as well as enabling reliable estimates of the beam time required for each isotope.
4 Conclusion
The 4+1 → 2+1 transition strengths in124−130Te have been
estimated from Coulomb excitation data obtained in a re-centg-factor measurement. Despite the beam energies be-ing above those considered ‘safe’, and evidence of nuclear interactions from both calculations and observed transfer reactions, new results for128,130Te were obtained that show agreement with shell-model calculations. TheB(E2; 4+1 →
2+1)/B(E2; 2+1 → 0+1) ratio increases from130Te towards
124Te, as neutrons are removed from the N = 82
shell-closure. Some discrepancy between the present and pre-vious measurements of transition strengths in 124Te has been observed, with the shell-model calculations in better agreement with the previous measurement [35]. However, in neither case does B(E2; 4+1 → 2+1)/B(E2; 2+1 → 0+1) in
124Te reach the vibrational limit. The present results
References
[1] S. K. Chamoli, A. E. Stuchbery, S. Frauendorfet al., Phys. Rev. C,83, 054318 (2011).
[2] A. E. Stuchbery, S. K. Chamoli, T. Kibédi, Phys. Rev. C,93, 031302 (2016).
[3] B. J. Coombes, A. E. Stuchbery, A. Blazhevet al., Phys. Rev. C,100, 024322 (2019).
[4] E. A. Coello Pérez, T. Papenbrock, Phys. Rev. C,94, 054316 (2016). .
[5] P. E. Garrett, J. L. Wood, J. Phys. G Nucl. Partic.,37, 064028 (2010).
[6] P. E. Garrett, T. R. Rodríguez, A. Diaz Varelaet al., Phys. Rev. Lett.123, 142502 (2019).
[7] E. E. Peters, A. E. Stuchbery, A. Chakrabortyet al., Phys. Rev. C99, 064321 (2019).
[8] J. R. Vanhoy, J. A. Tanyi, K. A. Crandell et al., Phys. Rev. C69, 064323 (2004).
[9] S. F. Hicks, J. R. Vanhoy, S. W. Yates, Phys. Rev. C
78, 054320 (2008).
[10] S. F. Hicks, J. C. Boehringer, N. Boukharoubaet al., Phys. Rev. C86, 054308 (2012).
[11] S. F. Hicks, J. R. Vanhoy, P. G. Burkett et al., Phys. Rev. C95, 034322 (2017).
[12] H. Sabri, Z. Jahangiri, M. A. Mohammadi, Nucl. Phys. A946, 11 - 28 (2016).
[13] N. J. Stone, A. E. Stuchbery, M. Danchev et al., Phys. Rev. Lett.94, 192501 (2005).
[14] A. E. Stuchbery, A. Nakamura, A. N. Wilsonet al., Phys. Rev. C76, 034306 (2007).
[15] A. E. Stuchbery, N. J. Stone, Phys. Rev. C 76, 034307 (2007).
[16] C. Goodin, N. J. Stone, A. V. Ramayyaet al., Phys. Rev. C78, 044331 (2008).
[17] A. Wolf and E. Cheifetz, Phys. Rev. Lett.36, 1072 (1976).
[18] J. M. Allmond, D. C. Radford, C. Baktash et al., Phys. Rev. C84, 061306(R) (2011).
[19] A. E. Stuchbery, J. M. Allmond, A. Galindo-Uribarri
et al., Phys. Rev. C88, 051304(R) (2013). [20] B. J. Coombeset al., (in preparation).
[21] XIA, Pixie-16 Data Sheet, XIA LLC,
31057 Genstar Rd., Hayward, CA
94544, USA, https://www.xia.com/ wp-content/uploads/2018/05/
Pixie-16_flyer_190327.pdf.
[22] A. E. Stuchbery, A. B. Harding, D. C. Weisseret al., Nucl. Instrum. Methods951, 162985 (2020). [23] C. J. Gross, T. N. Ginter, D. Shapiraet al., Nucl.
In-strum. Methods450, 12 - 29 (2000).
[24] T. Czosnyka, D. Cline, C. Y. Wu, B. Am. Phys. Soc.
28, 745 (1983).
[25] J. F. Ziegler, J. P. Biersack,The Stopping and Range of Ions in Matter, (Springer, Boston, MA 1985) ISBN: 9781461581055.
[26] J. Katakura, Z. D. Wu, Nucl. Data Sheets109, 1655 (2008).
[27] J. Katakura, K. Kitao, Nucl. Data Sheets 97, 765 (2002).
[28] Z. Elekes, J. Timar, Nucl. Data Sheets 129, 191 (2015).
[29] B. Singh, Nucl. Data Sheets93, 33 (2001).
[30] J. M. Allmond, B. A. Brown, A. E. Stuchberyet al., Phys. Rev. C90, 034309 (2014).
[31] M. Samuel, U. Smilansky, Phys. Lett. B28, 318-320, (1968).
[32] M. H. Macfarlane, S. C. Pieper, Argonne National Laboratory Report, Report No. ANL-76-11 1978 (unpublished).
[33] E. Caurier, G. Martinez-Pinedo, F. Nowacki et al., Phys. Rev. C95064324, (2017).
[34] E. Teruya, N. Yoshinaga, K. Higashiyama et al., Phys. Rev. C92, 034320 (2015).
[35] M. Saxena, R. Kumar, A. Jhinganet al., Phys. Rev. C
90, 024316 (2014).