Study of Parameters Effect on Hydrodynamics of a Gas-Solid
Chamber Experimentally and Numerically
Mahdi Hamzehei 1,x, Hassan Rahimzadeh 2
Abstract: In this research, gas velocity, initial static bed height and particle size effect on hydrodynamics of a non-reactive gas–solid fluidized bed chamber were studied experimentally and computationally. A multi fluid Eulerian model incorporating the kinetic theory for solid particles was applied to simulate the unsteady state behavior of this chamber and momentum exchange coefficients were calculated by using the Syamlal- O’Brien drag functions. Simulation results were compared with the experimental data in order to validate the CFD model. Pressure drops predicted by the simulations at different particle sizes and initial static bed height were in good agreement with experimental measurements at superficial gas velocity higher than the minimum fluidization velocity. Simulation results also indicated that small bubbles were produced at the bottom of the bed. These bubbles collided with each other as they moved upwards forming larger bubbles. Furthermore, this comparison showed that the model can predict hydrodynamic behavior of gas solid fluidized bed chambers reasonably well.
1. I
NTRODUCTIONFluidized bed driers and chambers are used in a wide range of applications in various industrial operations, including chemical, mechanical, petroleum, mineral, and pharmaceutical industries. Understanding the hydrodynamics of fluidized bed chambers is essential for choosing the correct operating parameters for the appropriate fluidization regime [1-4]. Computational fluid dynamics (CFD) offers an approach to understanding the complex phenomena that occur between the gas phase and the particles. The Eulerian-Lagrangian and Eulerian-Eulerian models have been applied to the CFD modeling of multiphase systems. For gas-solid flows modeling, usually, Eulerian-Lagrangian are called discrete particle models and Eulerian-Eulerian models are called granular flow models. Granular flow models (GFM) are continuum based and are more suitable for simulating large and complex industrial fluidized bed chambers containing billions of solid particles. These models, however, require information about solid phase rheology and particle-particle interaction laws. In principle, discrete particle models (DPM) can supply such information [5-8]. DPMs in turn need closure laws to model fluid-particle interactions and fluid-particle-fluid-particle interaction parameters based on contact theory and material properties. In principle, it is possible to work our way upwards from direct solution of Navier-Stokes equations. Lattice-Boltzmann models and contact theory to obtain all the necessary closure laws and other parameters required for granular flow
1x Department of Mechanical Engineering, Islamic Azad University, Ahvaz Branch, Ahvaz, Iran,
2 Department of Mechanical Engineering, Amirkabir University of Technology, Tehran, Iran
models. However, with the present state of knowledge, complete a priori simulations are not possible. It is necessary to use these different models judiciously. Combined with key experiments, to obtain the desired engineering information about gas-solid flows in industrial equipment. Direct solution of Navier-Stokes equations or lattice Boltzmann methods are too computation intensive to simulate even thousands of solid particles. Rather than millions of particles, DPMs are usually used to gain an insight into various vexing issues such as bubble or cluster formations and their characteristics or segregation phenomena. A few hundred thousand particles can be considered in such DPMs [4, 5, 7].
Multiphase flow processes are key element of several important technologies. The presence of more than one phase raises several additional questions for the chamber engineer. Multiphase flow processes exhibit different flow regimes depending on the operating conditions and the geometry of the process equipment. Multiphase flows can be divided into variety of different flows. One of these flows in gas-solid flows. In some gas-solid chambers (fluidized chambers); gas is the continuous phase and solid particles are suspended within this continuous phase. Depending on the properties of the gas and solid phases, several different sub-regimes of dispersed two-phase flows may exist. For relatively small gas flow rates, the drier may contain a dense bed of fluidized solid particles. The bed may be homogenously fluidized or gas may pass through the bed in the form of large bubbles. Further increase in gas flow rate decreases the bed density and the gas-solid contacting pattern may change from dense bed to turbulent bed, then to fast-fluidized mode and ultimately to pneumatic conveying mode. In all these flow regimes the relative importance of gas-particle, particle-particle, and wall interaction is different. It is, therefore necessary to identify these regimes to select an appropriate mathematical model [5-9].
The fundamental problem encountered modeling of these chambers is the motion of two phases where the interface is unknown and transient, and the interaction is understood only for a limited range of conditions. Also, a large number of independent variables such as particle density, size and shape can influence hydrodynamic behavior [2,3,5].
Taghipour et al. [8] have conducted experimental and computational studies of gas–solid fluidized bed chamber hydrodynamics. The simulation results were compared to those obtained from the experiments. The model predicted bed expansion and gas–solid flow patterns reasonably well. Furthermore, the predicted instantaneous and time-average local voidage profiles showed similar trends with the experimental results. Kaneko et al. [9] developed a DEM simulation code incorporated with the reaction and energy balances based on the soft sphere interaction at particle collision for a fluidized bed olefin polymerization. Heat transfer from particles to the gas was estimated using Ranz– Marshall equation. Their results were fairly realistic concerning particle and gas temperature behavior and also the bubbling behavior in a gas fluidized bed at elevated pressure. Hot spot formation was observed on the distributor near the wall of the fluidizing column.
and generate more heat than coarse particles. Their results indicate that considering two solid phases, particles with smaller diameters have lower volume fraction at the bottom of the bed and higher volume fraction at the top of the bed. In addition, it was revealed that bed expansion was larger when a bimodal particle mixture was applied compared with the case of mono-dispersed particles. Also, gas temperature increases as it moves upward in the chamber due to the heat of polymerization reaction leading to the higher temperatures at the top of the bed.
Chiesa et al. [12] have presented a computational study of the flow behavior of a lab-scale fluidized bed. They have also compared experiments results of a two-dimensional lab-scale bubbling fluidized bed with their computational results. Their results showed, when Eulerian and Lagrangian approaches were applied, the numerical simulations led to a rather similar pattern with the experimental data. These simulation results were much closer to the experimental results than the results of the continuous model. Gobin et al. [13] numerically simulated a fluidized bed using two-phase flow method. In their research, time-dependent simulations have been performed for industrial and pilot chamber operating conditions. The numerical predictions are in good qualitative agreement with the observed behavior in terms of bed height, pressure drop and mean flow regimes. Van Wachem et al. [14] verified experimentally Eulerian-Eulerian gas-solid model simulations of bubbling fluidized beds with existing correlations for bubble size or bubble velocity. A CFD model for a free bubbling fluidized bed was implemented in the commercial code CFX. This CFD model was based on a two fluid model including the kinetic theory of granular flow. CFD simulation of fluidized bed chamber has also been conducted by Fan et al. [15] focusing on the chemical kinetic aspects and taking into account the intra-particle heat and mass transfer rates, poly-disperse particle distributions and multiphase fluid dynamics. Gas–solid heat and mass transfer, polymerization chemistry and population balance equations were developed and solved in a multi-fluid code (MFIX) in order to describe particle growth. Also, Zhong et. al. [16] studied the maximum spoutable bed heights of a spout-fluid bed packed with six kinds of Geldart group D particles were. They obtained the effects of particle size, spout nozzle size and fluidizing gas flow rate on the maximum spoutable bed height. Their results shown that the maximum spoutable bed height of spout-fluid bed decreases with increasing particle size and spout nozzle size, which appears the same trend to that of spouted beds. Lettieri et al. [17] used the Eulerian–Eulerian granular kinetic model available within the CFX-4 code to simulate the transition from bubbling to slugging fluidization for a typical Group B material at four fluidizing velocities. Results from simulations were analysed in terms of voidage profiles and bubble size, which showed typical features of a slugging bed, and also good agreement between the simulated and predicted transition velocity.
1.
EXPERIMENTAL SET-
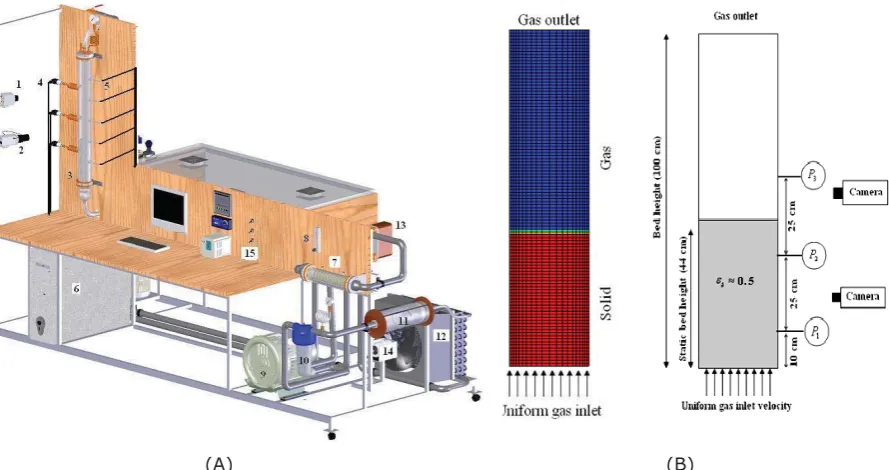
UPExperiments were conducted in a Pyrex cylinder with 100cm height, 25 cm diameter as shown schematically in Figure 1 (A). The distributor consisted of a perforated plate of open area ratio 0.8%. Spherical particle of 175, 275 and 375Pm diameter and density 2500 kg/m3 were fluidized with air at 1 kpa pressure. The static bed height was 44cm with a solids volume fraction of 0.5. The distributor consisted of a perforated plate of open arearatio 0.8%. A blower supplied the fluidizing gas.
(A) (B)
Figure 1. (A): A view of experimental set-up (1- digital camera, 2-digital video recorder, 3- Pyrex chamber, 4- pressure transducers, 5-thermocouples, 6- computer , A/D and DVR cards, 7-
electrical heater, 8-rotameter, 9-blower, 10- filter, 11-14- cooling system, 15- controller system) (B): Geometry, meshing of fluidized bed chamber and pressure transducers position.
A pressure-reducing valve was installed to avoid pressure oscillations and achieve a steady gas flow. The gas flow rates were measured by an air rotameter. Pressure fluctuations in the bed were obtained by three pressure transducers. Also, for controlling and monitoring the fluidized bed operation process, A/D, DVR cards and other electronic controller system were applied. The ratio of the distributor pressure drop to the bed pressure drop exceeded 11% for all operating conditionsinvestigated. Figure 1 (B) shows pressure transducers position. The overall pressure drop and bed expansion were monitored at different gas velocity. A digital camera (Canon 5000) and a digital video recorder (SAMSUNG, SDC-415) were employed to photograph the flow regimes and bubble formation through the transparent wall during the experiments.
2. NUMERICAL PROCEDURE
2.1. Governing Equations
The continuity equation for gas and solid phases without mass transfer between phases respectively are:
0
)
(
)
(
w
w
g g g g gv
t
D
U
D
U
,w
(
)
(
)
0
w
g s s s sv
t
D
U
D
U
(2) The conservation of momentum for the gas phase and solid phase is described by:)
(
.
)
.(
)
(
g gv
g g gv
gv
g gP
g g g gg
gs g st
D
U
D
U
D
V
D
U
E
Q
Q
&
&
&
&
&
&
w
w
(3))
(
.
)
(
)
(
s s s s s s s sP
g s s sg
gs g st
D
U
Q
D
U
Q
Q
D
V
D
U
E
Q
Q
&
&
&
&
&
&
w
w
(4)
Where
V
is Reynolds stress tensor, g is gravitational constant and(D
spE
gs(Q
&gQ
&s))is an interaction force (drag and buoyancy forces) representing the momentum transfer between gas and solid phase [5, 8].Several drag models exist for the gas-solid inter phase exchange coefficient
E
gs. In thisresearch O’Brien drag model was used [17, 18]. The drag law of Syamlal-O’Brien is based on the measurements of the terminal velocities of particles in fluidized or settling beds. The inter phase exchange coefficient is expressed as
¨ ¨ © § ¸¸¹ · g s s r s D s s r g g s gs C
d
X
X
X
X
U
D
D
E
& &, 2
,
Re 4
3 , 2
, Re 8 . 4 63 .
0 ¸¸¹·
¨¨© § s r s D C
Q (5)
And
v
r,s, a terminal velocity correlation, is expressed as 2 2,s
0
.
5
A
0
.
06
Re
s(
0
.
06
Re
s)
0
.
12
Re
s(
2
B
A
)
A
r
X
(6)14 . 4 g
A
D
°¯ ° ® ! d 85 . 0 85 . 0 8 . 0 65 . 2 28 . 1 g g g g if if B D D DD (7)
The stress tensor for the gas phase is given by
V
gP
gI
W
g (8)where Pg is the pressure. The viscous stress tensor,
W
g, is assumed to be of theNewtonian form (
I
is the identity tensor ,D
gis the strain rate tensor for the gas phase)I
D
tr
D
g g g g gg
g
D
P
D
O
W
2
,D
g>
v
g(
v
g)
T@
2
1
(9)
Granular flows can be classified into two distinct flow regimes: a viscous or rapidly shearing regime, in which stresses arise because of collisional or translational transfer of momentum, and a plastic or slowly shearing regime, in which stresses arise because of coulomb friction between grains in enduring contact. In this work, a combination of viscous and plastic regime was applied to investigate the behavior of granular flow.
°¯ ° ® ! d * * g g v s v s g g p s p s s if I P if I P D D W D D W
V (10)
where Ps is the pressure and
W
sis the viscous stress in the solid phase. The superscript pstands for plastic regime and v for viscous regime. In fluidized-bed simulations,
H
*g isusually set to the void fraction at minimum fluidization [15]. The granular pressure and the granular stress are given by
s s v
s
K
P
1D
24
, svD
s vstr
D
sI
v
s
2
P
O
(
)
where
O
vs, the second coefficient of viscosity for the solid phase and the factorP
sv , the shear viscosity for the solid phase and the strain rate tensor,D
s are given bys s v
s
K
D
4
O
2 , s sv
s
K
D
4
P
3 ,D
s>
v
s(
v
s)
T@
2
1
(12)
Similarity to the functions typically used in plastic flow theories, an arbitrary function that allows a certain amount of compressibility in the solid phase represents the solid
pressure term for plastic flow regime:
P
sP
*p
s
D
(13)where
P
*is represented by an empirical power lawP
*10
25(
D
*gD
g)
10 (14) A solids stress tensor based on the critical state theory iss p s p
s
P
D
W
2
,D p s
I
P
2 *2
sin
I
P
(15)I
is the angle of internal friction, andI
2Dis the second invariant of the deviatoric stress tensor [15, 20].The granular temperature
(
4
)
of solid phase as an order of solid fluctuation is defined asone-third of the mean square velocity of particles random motion. Therefore granular energy is defined as the specific energy of solid particles fluctuation. In this work the following algebraic granular temperature equation was used with the assumptions that the granular energy is dissipated locally, the convection and diffusion contributions are negligible and retaining only the generation and dissipation terms [11, 14].
2 4 2 2 2 4 2 2 2 1 1 2 2 4 ° ° ¿ °° ¾ ½ ° ° ¯ °° ® »¼ º «¬ ª ¸¹ · ¨© § ¸¹ · ¨© § ¸¹ · ¨© § ¸¹ · ¨© § 4 K D tr K D tr K K D tr K D tr K s s s s s s s s s s D D D
D (16)
where
D
sis the solids strain rate tensor, and with the abbreviations :e
ss sg
ssK
12
1
U
0, , 2 0, 33
2
)
1
(
3
4
K
g
e
d
K
sU
s ssD
s ssS
(17)>
@
5
}
1
8
1
3
1
4
.
0
1
3
3
{
2
, 0 , 0 3S
D
D
S
U
s ss ssss s ss ss ss s
s
g
e
g
e
e
e
d
K
(18)S
U
s ss s ssd
g
e
K
0,2
4
1
12
(19)
When using this algebraic equation in stead of solving the balance for the granular
temperature, much faster convergence is obtained during simulations [13,14].
g
o,ssis theradial distribution function that for one solids phase [8, 22], where
e
ssis the coefficientof restitution for particle collisions.
2.2. Initial and boundary conditions
boundary condition was out flow and was assumed to be fully developed flow. Table 1 shows values of model parameters that used in the simulations. The other variables were subject to the Newmann boundary condition. The gas tangential normal velocities on the wall were set to zero (no slip condition). The normal velocity of the particles was also set at zero. The following boundary equations apply for the tangential velocity and granular temperature of particles at the wall [25-28]
n
g
w s
s ss o s s
s s w
s
w
w
4
,, max , ,
3
6
Q
D
SU
D
P
Q
(20)The general boundary condition for granular temperature at the wall takes the form
w ss s
s o s s s w
s
w ss
s s w s
e
g
n
e
k
, max ,
2 / 3 2 ,
,
,
w
3
SU
6
D
D
Q
4
4
w
4
4
(21)Here
v
s,w is the particle slip velocity,e
ss,wis the restitution coefficient at the wall andmax ,
s
D
is the volume fraction for the particles at maximum packing [11,15,28]Table.1. Values of model parameters that used in the simulations and experiments.
Description Value Comment Solids density ,
s
U 2500 kg/m3 Glass beads
Gas density,
U
g 1.225 kg/m3 Air at inlet temperatureMean particle diameter
d
s 175, 275, 375Pm Uniform distributionCoefficient of restitution,
e
ss 0.9 Fixed valueMaximum solids packing,
D
max 0.61 Syamlal et al. (1989)Angle of internal friction,
I
30o Johnson and Jackson(1987) Initial solid packing 0.6 Fixed valueFluidized bed diameter 25 cm Fixed value Fluidized bed height 100 cm Fixed value Initial static bed height 20, 30, 40 cm Specified
Superficial gas velocity 38 cm/s Fixed value
Inlet boundary conditions Velocity Superficial gas velocity Outlet boundary conditions Out flow Fully developed flow Time steps 0.001 s Specified
Maximum number of iterations 20 Specified Convergence criteria 10-3 Specified
2.3. CFD simulation and computation solution
3. RESULTS AND DISSCUSION
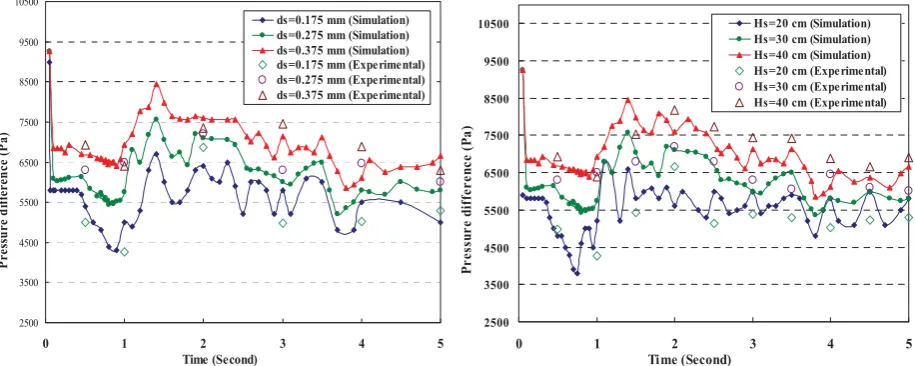
Simulation results were compared with the experimental data in order to validate the model. Pressure drop was measured experimentally for three sizes of solid particle and compared with those predicted by CFD simulation. As indicated in Figures 2, the bed overall pressure drop decreased significantly at the beginning of fluidization and then fluctuated around a near steady-state value after about 3.5 s. Pressure drop fluctuations are expected as bubbles continuously split and coalesce in a transient manner in the fluidized bed. The results of Figure 2 (Left) show with increasing the particles size, pressure drop increase. Comparison of the model predictions, using the Syamlal–O’Brien drag functions, and experimental measurements on pressure drop show good agreement for most operating conditions. These results (for ds=0.275 mm) are the same with Tagipour et al. [8] and Behjat et al. [11] results.
2500 3500 4500 5500 6500 7500 8500 9500 10500
0 1 2 3 4 5
Time (Second)
P
re
ss
u
re d
if
fere
n
ce (
P
a
)
ds=0.175 mm (Simulation) ds=0.275 mm (Simulation) ds=0.375 mm (Simulation) ds=0.175 mm (Experimental) ds=0.275 mm (Experimental) ds=0.375 mm (Experimental)
Figure 2. Comparison of experimental and simulation bed pressure drop (P1-P2) at different time
(Left) and at different solid particle sizes (Right).
Comparison of experimental and simulated bed pressure drop (Pressure difference between two positions, P1-P2 and P1-P3) for two different particle sizes, ds=0.175 mm and ds=0.375 mm, at different superficial gas velocity are shown in Figure 2 (Left) and Figure 3 (Left). Pressure transducers positions (P1, P2, P3) also were shown in Figure 1 (B). The simulation and experimental results show better agreement at velocities above
Umf. The discrepancy for U < Umf may be attributed to the solids not being fluidized, thus being dominated by inter particle frictional forces, which are not predicted by the multi fluid model for simulating gas-solid phases.
These figures show that with increasing gas velocity, initially the pressure drops (P1-P2 and P1-P3) increase, but the rate of increase for (P1-P3) is larger than for (P1-P2). As indicated in Figure 3 (Right) the bed overall pressure drop decreased significantly at the beginning of fluidization and then fluctuated around a near steady-state value after about 4 s. This trend is perhaps due to the expansion of the bed and the decrease in the amount of solids between ports 1 and 2. As the gas velocity increases further, the wall shear stress increases and the pressure drop begins to increase. Ports 1 and 3 cover the entire height of the dense bed in the column, and thus (P1-P3) increases with gas velocity. Pressure drop fluctuations are expected as bubbles continuously split and coalesce in a transient manner in the fluidized bed.
2500 3500 4500 5500 6500 7500 8500 9500 10500
0 1 2 3 4 5
Time (Second)
P
re
ss
u
re
d
if
fe
ren
ce
(
P
a
)
Comparison of experimental and simulated bed pressure drop for two different initial bed height, Hs=30, Hs=40 cm, at different superficial gas velocity are shown in Figure 3 (Right). The results show with increasing the initial static bed height and gas velocity, pressure drop (P1-P2 and P1-P3) increase but the rate of increasing for (P1-P3) is larger than (P1-P2). Comparison of the model predictions and experimental measurements on pressure drop (for both cases) show good agreement at different gas velocity.
Figure 3. Comparison of experimental and simulated bed pressure drop at different gas velocity, particle sizes and static bed height.
The results show with increasing the initial static bed height, pressure drop increase because of increasing the amount of particle, interaction between particle-particle and gas-particle. The results show with increasing the particle size, gas velocity and initial static bed height pressure drop (P1-P2 and P1-P3) increases. Comparison of the model predictions and experimental measurements on pressure drop (for both cases) show good agreement at different gas velocity.
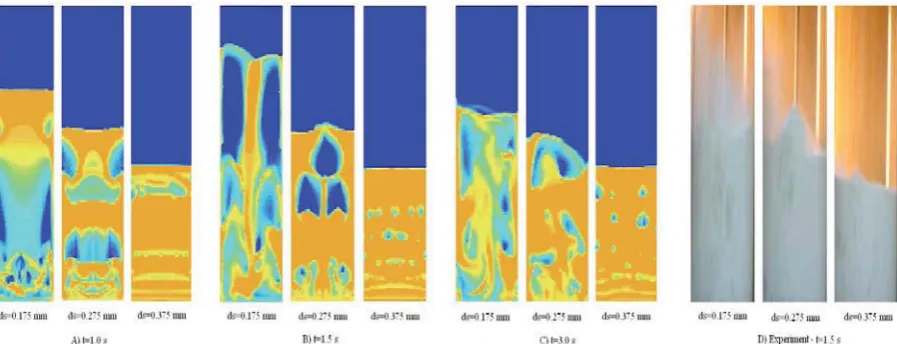
Figure 4. Comparison of experiment and simulated void fraction and bubbles for three particle sizes and three different times.
The contour plots of solids fraction shown in Figure 4 indicate similarities between the experimental and simulations for three particle sizes and at three different times. The results show that the bubbles at the bottom of the bed are relatively small. The
0 1000 2000 3000 4000 5000 6000 7000 8000 9000 10000
0 10 20 30 40 50 60 70 80
Gas velocity (Vg) cm/s
P
ress
u
re d
iffer
en
ce
(P
a)
experiments indicated small bubbles near the bottom of the bed; the bubbles grow as they rise to the top surface with coalescence. The increase in bed expansion and variation of the fluid-bed voidage can be observed. At the start of the simulation, waves of voidage are created, which travel through the bed and subsequently break to form bubbles as the simulation progresses. Initially, the bed height increased with bubble formation until it leveled off at a steady-state bed height. The observed axisymmetry gave way to chaotic transient generation of bubble formation after 1.5 s. The bubbles coalesce as they move upwards producing bigger bubbles. The bubbles become stretched as a result of bed wall effects and interactions with other bubbles. The elongation of the bubbles is due to wall effects and interaction with other bubbles. Syamlal–O'Brien drag model provided similar qualitative flow patterns. The size of the bubbles predicted by the CFD models are in general similar to those observed experimentally.
0.4 0.7 1 1.3 1.6 1.9 2.2 2.5
0 0.2 0.4 0.6 0.8 1
Gas Velocity (Ug) m/s
H/
H
0
ds=0.175 mm (Simulation) ds=0.175 mm (Experimental) ds=0.275 mm (Simulation) ds=0.275 mm (Experimental) ds=0.375 mm (Simulation) ds=0.375 mm (Experimental)
Figure 5. Comparison of experimental and simulated bed expansion ratio for different solid particle sizes (Left) and for different initial static bed height (Right).
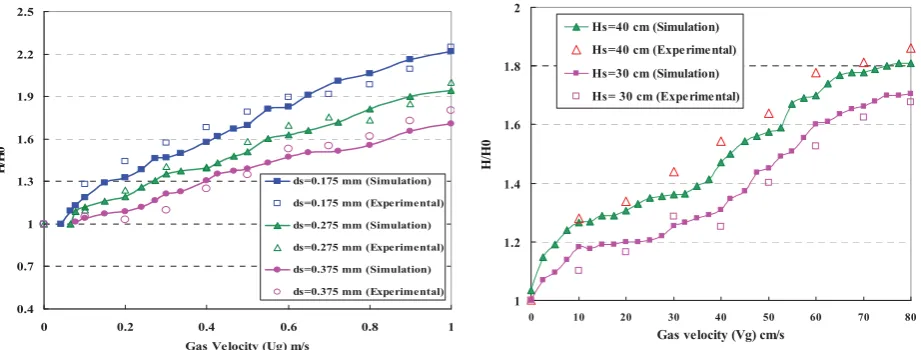
Any discrepancy could be due to the effect of the gas distributor, which was not considered in the CFD modeling of fluid bed. In practice, jet penetration and hydrodynamics near the distributor are significantly affected by the distributor design. Time-averaged bed expansions as a function of superficial velocities are compared in Figure 5 (Left). This figure shows that the model predicts the correct increasing trend of the bed height with the increase of superficial gas velocity. All cases demonstrate a consistent increase in bed expansion with gas velocity and predict the bed expansion reasonably well. There are, however, some deviations under predict the experimental values. This figure shows that with increasing the particles sizes, bed expansion ratio decreases. On the other hand, for the same gas velocity, bed expansion ratio is lager for smaller particles.
The experimental data of time-average bed expansion ratio were compared with corresponding values predicted for various velocities as depicted in Figure 5 (Right) The time-average bed expansion ratio error between CFD simulation results and the experimental data for two different initial bed height, Hs=30, Hs=40 cm, are 6.7% and 8.7% respectively. Both cases demonstrate a consistent increase in bed expansion with gas velocity and predict the bed expansion reasonably well. It can be seen that Syamlal– O'Brien drag function gives a good prediction in terms of bed expansion and also, Syamlal–O'Brien drag law able to predictthe minimum fluidization conditions correctly.
1 1.2 1.4 1.6 1.8 2
0 10 20 30 40 50 60 70 80
Gas velocity (Vg) cm/s
H/
H
0
Hs=40 cm (Simulation)
Hs=40 cm (Expe rime ntal)
Hs=30 cm (Simulation)
4. CONCLUSION
In this research, unsteady state hydrodynamics in a gas–solid fluidized bed chamber has been investigated. Preliminary investigation of multiphase flow models revealed that Eulerian-Eulerian model is suitable for modeling of industrial fluidized bed chambers. The model includes continuity equations and momentum equations for both phases and the equations for granular temperature of solid particles. A suitable numerical method that employs finite volume method has been applied to discritize the equations. Simulation results also indicated that small bubbles were produced at the bottom of the bed. These bubbles collided with each other as they moved upwards forming larger bubbles. In order to validate the model, an experimental setup was fabricated and a series of tests were performed. The predicted bed expansion ratio and pressure drop were compared with corresponding values of experimentally measured data. The modeling predictions compared reasonably well with experimental bed expansion ratio measurements and qualitative gas–solid flow patterns. Pressure drops predicted by the simulations were in relatively close agreement with the experimental measurements for gas velocities higher than the minimum fluidization velocity. Furthermore, comparison between experimental and computational simulation showed that the model can predict the hydrodynamic behavior of a fluidized bed chamber reasonably well. Extension of the present simulation to the three-dimensional (3D) gas-solid flows with heat transfer is left for a future work.
5. REFERENCES
[1] Gidaspow, D., Multiphase Flow and Fluidization, First ed, London, 1994.
[2] Kunii, D., Levenspiel ,O., Fluidization Engineering, Second ed. Butterworth-Heinemann, Boston, 1991.
[3] Ranade, V.V., Computational Flow Modeling for Chemical Chamber Engineering, First ed. Academic press, New York, 2002.
[4] Huilin. L., Wentie,L., Feng, L., Guangbo, Z., Huilin, H.L., Wentie, L., Feng, L., Guangbo, Z., Yurong, H., Eulerian simulations of bubble behavior in a two-dimensional gas–solid bubbling fluidized bed, Int. J. of Energy Research, 26, 2002, pp.1285–1293.
[5] Grace, J.R., Taghipour, F., Verification and validation of CFD models and dynamic similarity for fluidized beds. Powder Technology , 2004, pp.139, 99–110.
[6] Bird, R.B., Stewart, W.E., Lightfoot, E.N., Transport Phenomena, Wiley, 2002.
[8] Taghipour, F., Ellis, N., Wong, C., Experimental and computational study of gas–solid fluidized bed hydrodynamics, Chemical Engineering Science, 60, 2005, pp. 6857–6867.
[9] Kaneko Y., Shiojima. T., Horio. M., DEM simulation of fluidized beds for gas-phase olefin polymerization, Chemical Engineering Science, 54, 1999, pp. 5809–5821.
[10] Huilin, L., Yurong, H., Gidaspow, D., Hydrodynamic modeling of binary mixture in a gas bubbling fluidized bed using the kinetic theory of granular flow, Chemical Engineering Science, 2003, pp. 1197–1205.
[11] Behjat. Y, Shahhosseini.S, Hashemabadi.S.H, CFD modeling of hydrodynamic and heat transfer in fluidized bed chambers, International Communications in Heat and Mass Transfer, 35, 2008, pp. 357–368
[12] Chiesa, M., Mathiesen, V., Melheim, J.A.., Halvorsen, B., Numerical simulation of particulate flow by the Eulerian–Lagrangian and the Eulerian–Eulerian approach with application to a fluidized bed, Computers & Chemical Engineering , 29, 2005, 291–304.
[14] Van Wachem . B.G.M., Schouterf .J.C., Krishnab. R., and Bleek . van den.C.M., Eulerian Simulations of Bubbling Behaviour in Gas-Solid Fluidized Beds, Computers chem. Eng. , Vol. 22, 1998, pp. 299-306.
[15] Fan.R., Marchisio., D.L., Fox. R.O., CFD Simulation of Polydisperse Fluidized-Bed Polymerization Chambers, Department of Chemical Engineering, Iowa State University, 2114 Sweeney Hall, Ames, IA 50010-2230, USA, 2003.
[16] Lettieri. P., Saccone. G., Cammarata. L., Predicting the Transition from Bubbling to Slugging Fluidization Using Computational Fluid Dynamics ,Trans IChemE, Part A, 2004 Chemical Engineering Research and Design, 82(A8): 939–944
[17] Zhong.W, Zhang.M, Jin.B, “Maximum spoutable bed height of spout-fluid bed”, Chemical Engineering, 124, 2006, pp. 55–62.
[18] Syamlal, M., O’Brien, T.J., Computer simulation of bubbles in a fluidized bed. A.ICh.E. Symposium Series 85, 1989, pp. 22–31.
[19] Syamlal, M., O’Brien, T.J., Fluid dynamic simulation of O3 decomposition in a bubbling fluidized bed. A.I.Ch.E. Journal 49, 2003, pp. 2793–2801
[20] Gamwo.I.K, Soong.Y, Lyczkowski.R.W, Numerical simulation and experimental validation of solids flows in a bubbling fluidized bed, Powder Technology, 103, 1999, pp. 117–129.
[21] Pain, C., Mansoorzadeh, S., Oliveira, C.R.E.D., Goddard, A.J.H., Numerical modeling of gas–solid fluidized beds using the two-fluid approach, International Journal for Numerical Methods in Fluids, 36, 2001, pp. 91–124.
[22] Lun, C.K.K., Savage, S.B., Jeffrey, D.J., and Chepurniy, N., Kinetic Theories for Granular Flow: Inelastic Particles in Couette Flow and Slightly Inelastic Particles in a General Flow Field, J. Fluid Mech., 140, 1984, pp. 223-256.
[23] Lun, C.K.K., and Savage, S.B., A Simple Kinetic Theory for Granular Flow of Rough, Inelastic, Spherical Particles, J. Appl. Mech., 54, 1987, pp. 47-53.
[24] Goldschmidt, M.J.V., Kuipers, J.A.M., van Swaaij, W.P.M., Hydrodynamic modeling of dense gas fluidized beds using the kinetic theory of granular flow: effect of coefficient of restitution on bed dynamics. Chemical Engineering Science, 56, 2001, pp. 571–578.
[25] Wei. D., Xiaojun, B.,, Jian, X.,Weisheng,W., computational fluid dynamics (CFD)
modeling of spouted bed:influence of frictional stress, maximum packing limit and coefficient ofrestitution of particles, Chemical Engineering Science, 61, 2006, pp. 4558.
[26] Hui, K., Haff, P.K. and Jackson, R., Boundary Conditions for High-Shear Grain Flows. J.F.M. 145, 1984 pp. 223-233.
[27] Johnson, P.C. and Jackson, R., Frictional-Collisional Constitutive Relations for Granular materials, with Application to Plane Shearing. J. Fluid Mech., 176, 1987,pp. 67.
[28] Patankar, S.V., Numerical heat transfer and fluid flow, First ed. Hemisphere Publishing, Washington, DC, 1980.
[29] Hamzehei, M., Rahimzadeh, H., Experimental and Numerical Study of Hydrodynamics with Heat Transfer in a Gas-Solid Fluidized bed Chamber at Different Particle Sizes, Ind. Eng. Chem. Res., 48, , 2009, pp. 3177–3186.
[30] Hamzehei, M., Rahimzadeh, H., Ahmadi, G., Computational and Experimental Study of Heat Transfer and Hydrodynamics in a 2D Gas-Solid Fluidized Bed Reactor, Ind. Eng. Chem. Res. 2010, 49, pp. 5110–5121.