1
Light physical activity is positively associated with cognitive performance in older community 1
dwelling adults 2
2
Abstract
4 5
Objectives: To evaluate the associations between an objective measure of different intensities of 6
physical activity, upper- and lower-limb muscle strength and psychomotor performance and set-7
shifting domains of cognitive executive function in older adults. 8
Design: A cross-sectional study. 9
Methods: From the Tasmanian Older Adult Cohort Study, 188 community-dwelling older adults 10
(53.7% female; mean age ± SD 63.98 ± 7.3 years) undertook 7-day physical activity behaviour 11
monitoring using an accelerometer. Dynamometers were used to assess leg extension strength. The 12
Trail Maker Tests were used to measure psychomotor processing speed and set-shifting performance. 13
Results: When controlling for age, smoking history, alcohol intake, educational achievement and 14
neuropsychological functioning, higher levels of light physical activity, but not sedentary behaviour 15
or moderate or vigorous physical activity, was found to be associated with better set-shifting 16
performance. Neither physical activity behaviour or muscle strength were found to be associated with 17
psychomotor performance. In addition, older age, greater alcohol intake, and lower levels of 18
educational attainment, verbal learning and memory performance were significantly associated with 19
lower scores on the set-shifting task; whereas older age and reduced neuropsychological functioning 20
were associated with lower psychomotor processing speed scores. 21
Conclusions: Light physical activity is associated with higher executive functioning in community-22
dwelling older adults and this strengthens the evidence supporting exercise as a neuroprotective agent. 23
Further studies are needed to understand why light physical activity behaviour positively influences 24
executive functioning, and how such physical activity can be implemented into the daily routine of 25
older adults. 26
27
3
1. Introduction
29
Participation in physical activity (PA) by older adults reduces the risk of chronic disease, and 30
encourages the maintenance of muscle strength1 and functional independence.2 It is also possible that 31
regular PA might delay the age-related decline in cognitive function.2 32
The collective evidence demonstrates PA positively influences cognition across a range of 33
domains.3 A meta-analysis of prospective studies that examined the association between PA and 34
cognitive decline in older adults found a low to moderate level of PA significantly (-35%) reduced the 35
risk of decline.4 Others found an inverse relationship between increased muscle strength5 and 36
cardiorespiratory fitness6 and cognitive decline. 37
Questionnaires and other self-report measures have historically been used to derive 38
population-based measurements of habitual PA, despite their limited reliability and validity.7 39
Objective measures of PA are furthering our understanding of the association between cognition and 40
PA, and there is emerging evidence cognitive function is improved by both light8 and moderate-to-41
vigorous PA.8,9 42
Further population-based studies are required to clarify the association between cognition, 43
muscle strength and objectively measured PA behaviours. In an ageing Australian population, 44
understanding this association might aid the development of interventions aimed towards delaying or 45
slowing the rate of cognitive decline. The aim of this study was to investigate cross-sectional 46
associations between different intensities of PA, muscle strength and executive functioning as indexed 47
by set-shifting and psychomotor performance in older adults. It was hypothesized that more active and 48
stronger participants would have enhanced set-shifting and faster psychomotor speed whereas 49
increased sedentary time would be associated with poorer set-shifting and psychomotor performance. 50
51
2. Method
52
Participants were drawn from the Tasmanian Older Adult Cohort (TASOAC), an ongoing, 53
prospective, population-based study of community-dwelling older adults. An equal number of men 54
and women between the ages of 50 and 79 years were randomly selected from the electoral roll in 55
4
contraindication for magnetic resonance imaging and institutionalisation. Of the 1,100 enrolled in the 57
study, 1,099 attended a clinic for baseline assessment between March 2002 and September 2004. 58
Phase 2 follow-up data was collected for 875 participants approximately 2.7 years later, and Phase 3 59
data was collected for 767 participants approximately 5 years later. Our study consists of 111 females 60
(64.23 ± 7.095 years) and 99 males (mean ± SD, age 63.92 ± 7.326 years) that had complete Phase 2 61
accelerometer, cognition and muscle strength measures. The study was approved by the Southern 62
Tasmanian Health and Medical Human Research Ethics committee, and written informed consent was 63
obtained from all participants. 64
The waist-to-hip ratio (WHR) is a surrogate obesity indicator that has been shown to be a 65
more effective predictor of mortality and cardiovascular disease than other anthropometric measures, 66
such as body mass index.10 It is determined by dividing the participants average waist circumference 67
by their average hip circumference. The measurements were taken either directly over the skin or over 68
light clothing, measured to the 0.1 cm and repeated. A third measurement was taken if there was more 69
than a 2 cm difference between the first two measures. With the participant standing with their feet 70
together and arms relaxed by their side, the waist measurement was taken at the level of the mid-point 71
between the inferior margin of the last rib and the crest of the ilium in the mid-axillary plane and is 72
taken at the end of a normal expiration. This hip circumference measure is taken at the level of the 73
greatest posterior protuberance of the buttocks and with the participants gluteal muscles in relaxed. 74
Level of educational attainment was based on recognised Australian educational standards 75
and obtained in a structured interview in response to the following question: What is the highest 76
qualification you have completed? The respondents were to select one of the following: 1) No formal 77
qualifications; 2) School or Intermediate Certificate; 3) Higher School or Leaving Certificate; 4) 78
Trade/apprenticeship; 5) Certificate/diploma; 6) University Degree; or 7) Higher University Degree. 79
Smoking history was assessed by determining if the participant was, or had previously been, a 80
‘regular smoker’ (viz. someone that had smoked at least 7 cigarettes, cigars or pipes weekly for at 81
least 3 months). Self-reported alcohol intake (g/day) was measured using the validated Cancer 82
5
Isometric leg strength of the hip extensors and quadriceps was assessed in both legs 84
simultaneously (to the nearest kilogram) using a dynamometer (TTM Muscular Metre, Tokyo, Japan). 85
The best score from two attempts was recorded. This test has previously been described in detail.12 86
The Trail Maker Test (TMT), a widely used neuropsychological assessment, was used to 87
assess set-shifting and psychomotor speed.13 The TMT is a two-part (TMT-A and TMT-B) assessment 88
of general brain function. The TMT-A requires participants to connect numbers with a line, whilst the 89
TMT-B requires both letters and numbers to be connected. TMT-A assesses visuo-perceptual and 90
motor abilities, whilst the TMT-B assesses working memory and task-switching skills.13 Participants 91
were administered a pen and paper version of the TMT according to the established guidelines14 in a 92
laboratory-based setting. Faster completion of the test indicated better performance. 93
A revised version of the Hopkins Verbal Learning Test-Revised (HVLT-R)15 has high utility 94
as a screening instrument for amnestic mild cognitive impairment and early Alzhiemer’s disease 95
(AD).16 Participants were administered the HVLT-R according to the established guidelines14 in a 96
laboratory- based setting. The performance measures were a total number of words recalled for each 97
of 3 learning trials (HVLT total recall; range 0 – 36) and the total number of words recalled in a 98
delayed trial (HVLT delayed recall; range 0-12). 99
Accelerometer-determined PA was assessed using an ActiGraph GT1M (Actigraph, 100
Pensacola, FL) which provides information on the frequency, intensity, and duration of PA using a 101
built-in single axis accelerometer which measures vertical accelerations at the hip at a sampling 102
frequency of 30 Hz. Actigraph accelerometers and software are a valid and reliable means of 103
measuring PA.17 Each participant was instructed to wear an accelerometer for 7 consecutive days 104
following their clinic visit. Participants were provided with a daily diary where they recorded the time 105
they put the accelerometer on in the morning and took it off at the end of each day, as well as the 106
duration and reason for any periods where they took the accelerometer off (non-wear time). 107
The number of counts was collected in 1-minute epochs. Sedentary activity was classified as 108
less than 250 counts per minute (cpm), light (251-1951 cpm), moderate (1952-5724 cpm) and 109
6
METS), 3 - 5.9 METS, ≥ 6 METS respectively. The sedentary activity cut-off was proposed by 111
Matthew,18 and cut-offs for the other categories of PA were as per the Freedson equation.19 For each 112
of the 7 days, the accelerometer registered the amount of time (min/day) the participant spent in light, 113
moderate, and vigorous activity. Sedentary time was then calculated using the total wear time reported 114
in the daily diary minus any non-wear time, light, moderate, and vigorous activity. Sedentary, light, 115
moderate and vigorous activity were then averaged by the total number of valid days (a valid day was 116
one in which the accelerometer was worn for > 10 hours) to produce an average time spent in each 117
activity category per day. Participants had to have at least 5 valid days to be included in the analysis. 118
Therefore for the analysis each participant had a value (min/day) of sedentary, light, moderate, and 119
vigorous which was the average over the time the accelerometer was worn. 120
Multiple regression analyses, using SPSS version 22© software, were employed to explore the 121
cross-sectional association between TMT parts A and B and sedentary, light, moderate, and vigorous 122
levels of PA and leg muscle strength. Interactions and indirect effects were assessed using the 123
MODPROBE and INDIRECT macros for SPSS, respectively.20,21 Sample outliers were identified 124
using boxplots, kernel density estimation with rug plots and standard scores for the variables. The 125
assumption of normality was assessed by examining residuals scatter plots for the dependent 126
variables. Power analysis22 indicated that with alpha set at 0.05 and Power at 0.80, a minimum of 127 127
participants would be required to reliably detect small-to-medium effects, which are of similar 128
magnitude to those found in previous PA and cognition research.3,23 129
130
3. Results
131
Twenty outlier cases (9.5% of the sample, 10 Female) that had a standard score of 3 or greater 132
were removed from the analyses. Another two cases (0.95% of the sample) were removed because of 133
missing HVLT-R data, resulting in 188 participants being included in the analyses (see Table 1 for 134
participant characteristics). The sample analysed differed little from the initial sample prior to 135
7
assumption of normality was met. The Variance Inflation Factors for the predictor variables were less 137
than 2.5 and the Tolerances were greater than 0.2, indicating that there was no multicollinearity. 138
The correlation matrix (see Table 2) shows that no significant correlations were found 139
between total wear time minutes, TMT-A performance and sedentary behaviour, light PA, moderate 140
PA or vigorous PA. However, the correlations between TMT-B performance, total wear time minutes, 141
light PA and moderate PA were significant. More time spent engaged in PA was associated with 142
faster TMT-B completion times. The correlation between TMT-A performance and the level of 143
education attained was not significant. However, the correlation between TMT-B performance and 144
level of education attained was significant, with higher levels of education attainment associated with 145
faster TMT-B completion times. Additionally, the correlations between level of education attained 146
and sedentary behaviour and light PA were significant. A higher level of education attained was 147
associated with more sedentary behaviour, and less time engaged in light PA. Additionally, Table 2 148
shows that the level of redundancy between the different categories of PA was acceptable. 149
TMT-A was regressed on age, gender, level of education attained, WHR, history of cigarette 150
smoking, alcohol intake, and HVLT total recall. The model was significant, accounting for 9.4% of 151
TMT-A, F(7, 180) = 2.66, p = <0.012, R2 = 0.094. Age and HVLT total recall were the only 152
significant factors associated with TMT-A performance (B = 0.277, 95% CI [0.036, 0.518], p = 0.024 153
and B = -0.378, 95% CI [-0.750, -0.007], p = 0.046, respectively). The non-significant variables were 154
removed and total wear time minutes, leg muscle strength, and sedentary, light, moderate, and 155
vigorous levels of PA were simultaneously added. Again, the model was significant, accounting for 156
9.5% of TMT-A, F(7, 180) = 2.684, p = <0.011, R2 = 0.095, R2∆ = 0.014, p = 0.743. Age and HVLT 157
total recall remained the only statistically significant predictors (B = 0.326, 95% CI [0.072, 0.579], p 158
= 0.012 and B = -0.504, 95% CI [-0.849, -0.158], p = 0.005, respectively). Total wear time minutes, 159
leg muscle strength, sedentary behaviour, and light, moderate, and vigorous PA added a trivial 160
amount to the variability of TMT-A performance. It is well established that psychomotor speed 161
declines with normal aging,24 so the regression model for TMT-A will not be reported further. 162
TMT-B was regressed on age, gender, level of education attained, WHR, history of cigarette 163
8
accounting for 31.4% of TMT-B performance, F(7, 180) = 11.786, p = <0.001, R2 = 0.314. Gender 165
and WHR (B = -0.669, 95% CI [-12.703, 11.368], p = 0.913 and B = -7.816, 95% CI [-58.932, 166
43.299], p = 0.763, respectively) were not significant and their unique contributions to the variability 167
in TMT-B performance were trivial, so they were removed from the model. 168
Next, total wear time minutes, leg muscle strength, and sedentary, light, moderate, and 169
vigorous levels of PA were simultaneously added. It was significant and accounted for 36.2% of 170
TMT-B performance, F(10, 177) = 10.027, p = <0.001, R2 = 0.362. This represented a significant 171
increase of 4.8% from the first model, R2∆ = 0.048,p = 0.024. Leg muscle strength and total wear 172
time were not significant minutes (B = 0.58, 95% CI .037, .153], p = 0.232 and B = -.056, 95% CI [-173
.117, .006], p = 0.077, respectively) and their unique contributions to the variability in TMT-B 174
performance were trivial (0.5% and 1% of the variance, respectively). They were removed from the 175
model. The model continued to account for 35.6% of variability in TMT-B performance, F(9, 178) = 176
10.940, p = <0.001, R2 = 0.356, R2∆ = 0.043, p = 0.022. The final model for TMT-B is presented in 177
Table 3. Light PA was significant and uniquely accounted for 2.6% of the variability in TMT-B 178
performance. A one minute increase in time spent performing light PA was associated with a 0.114 179
second reduction in the time taken to complete the TMT-B when all other factors were held constant. 180
Sedentary, moderate, and vigorous levels of PA were non-significant variables. However, they were 181
not removed from the model, as PA is a naturally occurring continuous variable that was categorized 182
to facilitate comparison with previous research in the area of interest. The remaining factors (age, 183
HVLT total recall, level of education attained, alcohol intake, and smoking) were significant and each 184
uniquely accounted for a small amount of variability in TMT-B performance (see Table 3). The most 185
notable was level of education attained, which accounted for 8.2% of the variability in TMT-B 186
performance. Finally, variance common to multiple factors accounted for 10.37% of the variability in 187
TMT-B performance. There were no significant interactions or indirect effects at the criterion alpha 188
level of 0.05. 189
190
4. Discussion
9
The utility of accelerometers to objectively measure PA behaviour distinguishes this study as 192
one of the few that accurately quantifies the associations between cognitive functioning, muscle 193
strength, and PA behaviour. In our cross-sectional analysis of older adults, older age and reduced 194
cognitive functioning was negatively associated with psychomotor speed. However, there was no 195
significant association between PA behaviour or muscle strength and psychomotor speed. 196
Alternatively, when controlling for smoking history, alcohol intake, level of education attained and 197
cognitive functioning, our regression model identified light PA to be positively associated with set-198
shifting ability. The relatively small amount of variability in cognitive function accounted for by light 199
PA is consistent with the effects found in previous research.3 An increase in time taken to complete 200
the set-shifting task was associated with older age, increased alcohol intake, a history of smoking, 201
lower levels of educational attainment and reduced neuropsychological functioning. 202
Our finding that objectively measured light PA was associated with enhanced set-shifting 203
ability is consistent with previous evidence that demonstrated light-intensity PA is associated with 204
higher levels of domain-specific (word fluency) executive function.8 It is an important finding in the 205
context of the appropriateness of the prescription of light-intensity PA to older adults that may be 206
deconditioned or are new to exercise and thus restricted to light exercise only. Our finding also 207
support previous reports of an association between cardiorespiratory fitness and global cognitive 208
performance and TMT-B performance in non-demented individuals.25 Though it is notable that we 209
found an association even when age was controlled for, which was not the case in the Burns et al. 210
study.25 211
Exercise confers benefits by preserving frontal, parietal and temporal cortex grey matter 212
volume26 and hippocampal volume27 in older adults. Larger hippocampi and higher fitness levels have 213
been correlated with better spatial memory performance,27 and there is good evidence that higher 214
levels of PA can reduce the likelihood of developing cognitive impairment.28 Collectively, PA appears 215
to influence the brain in a manner that translates to preserving cognitive function. How this occurs, 216
and what specific cognitive processes are influenced by the various modes and intensities of PA is 217
10
The absence of significant associations between cognitive function and moderate and 219
vigorous PA contrasts previous research by Kerr et al. (2013), who found only moderate-to-vigorous 220
intensity PA was significantly associated with cognitive functioning.9 The contrasting results may be 221
explained by a number of methodological differences: Kerr et al. classified PA behaviour into low-222
light, high-light, and moderate-to-vigorous intensity PA; the study participants had an older average 223
age (83 years); 70% were university educated and all were residing in retirement communities. 224
Neither study found any interactions, however Kerr et al. used an alpha level of 0.10, whereas we 225
used a more stringent alpha of 0.05. Had we used the same alpha level as Kerr et al., we would have 226
reported significant interaction effects. Furthermore, although Kerr et al. transformed their data for 227
analysis and then back-transformed them so the results would be in a meaningful metric, they reported 228
mean values.9 However, back transformation gives the geometric mean, which is a close 229
approximation of the median.29 We report mean values. These differences make it difficult to directly 230
compare the two studies. 231
Another finding of interest is that the level of education attained was the largest unique 232
contributor to the total variability in set-shifting performance. A faster TMT-B completion time was 233
found to be associated with a higher level of education attainment. Furthermore, the correlation 234
between HVLT total recall score and the level of education attained was significant and positive. 235
These findings are consistent with previous research, which has shown a higher level of education 236
attainment is associated with better performance on neuropsychological tests.23 Possibly of greater 237
interest though, is the contrast between the positive bivariate association between the level of 238
education attained and sedentary behaviour and the inverse association between the level of education 239
attained and light PA. 240
Additionally, although total wear time was not a significant predictor and accounted for little 241
of the variability in TMT-B scores in the regression models, it had a strong positive bivariate 242
association with sedentary PA. That is, as wear time increased so did sedentary PA. The other PA 243
categories only had weak to moderate associations with total wear time. It is also notable that 244
11
factors. These results highlight the complexity of the associations between variables that impact on 246
cognitive functioning in older adults, and further research is necessary to disentangle them. 247
This study has several limitations. It is possible that the wearable accelerometers influenced 248
the PA behaviours of the participants, though unlike other activity monitors, the accelerometers used 249
in this study do not provide the wearer with feedback and thus minimise any motivating impact they 250
might have on the participants PA behaviours. We also acknowledge that the ActiGraph GT1M may 251
underestimate light activity and overestimate sedentary behaviour.30 Whilst our findings cannot be 252
applied to institutionalised older adults or those over 80 years of age, they can be applied to 253
community dwelling older Australian adults who are under 80 years of age. Finally, the cross-254
sectional design of the present study does not allow for strong claims about causality. That is, 255
notwithstanding our findings, we are unable to determine the potential direction of the association 256
between PA behaviour and cognitive functioning. 257
258
5. Conclusion
259
This study found light PA is associated with higher levels of cognitive functioning in a 260
sample of older adults. The significance of this finding should not be underestimated, as this is one of 261
the few studies of its type to employ an objective measure of PA behaviours. Notwithstanding the 262
existing evidence of the benefits of PA for cognitive functioning, our findings have important 263
implications for the appropriate prescription of exercise to preserve older adult’s executive 264
functioning. For older adults new to exercise, or with pre-existing comorbidities, the initial 265
engagement in PA should be at a light level, including low-intensity aerobic-based activities such as 266
walking and gardening. Future studies should focus on determining the influence of PA behaviour on 267
cognitive functioning over time and establish exercise prescription guidelines for the neuroprotection 268
of older adults. 269
270
Practical Implications
271
12
A greater intensity of PA and increased sedentary time may not necessarily enhance cognitive 273
functioning. 274
Elderly individuals who are deconditioned or new to exercise might benefit physically and 275
cognitively from light PA. 276
277
Acknowledgements
278
The TASOAC study was supported by the National Health and Medical Research Council of 279
Australia; Arthritis Foundation of Australia; Tasmanian Community Fund; University of Tasmania 280
Institutional Research Grants Scheme. This analysis was supported by the Australian Government’s 281
Collaborative Research Networks program. We wish to thank the TASOAC staff and volunteers, in 282
particular the study coordinator Catrina Boon, and we are appreciative of the time and efforts of all 283
the TASOAC participants. 284
285
References
286
1. A guide for population-based approaches to increasing levels of physical activity. 287
Implementation of the WHO global strategy on diet, physical activity, and health. Geneva, 288
Switzerland: World Health Organisation 2007. Available at 289
http://www.who.int/dietphysicalactivity/pa/en/index.html. 290
2. Paterson DH, Warburton DER. Physical activity and functional limitations in older adults: a 291
systematic review related to Canada’s physical activity guidelines. Int J Behav Nutr Phys Act
292
2010; 7:38. 293
3. Hillman CH, Erickson KI, Kramer AF. Be smart, exercise your heart: exercise effects on 294
brain and cognition. Nat Rev Neurosci 2008; 9(1):58-65. 295
4. Sofi F, Valecchi D, Bacci D et al. Physical activity and risk of cognitive decline: a meta-296
analysis of prospective studies. J Intern Med 2011; 269(1):107-117. 297
5. Boyle PA, Buchman AS, Wilson RS et al. Association of muscle strength with the risk of 298
Alzheimer disease and the rate of cognitive decline in community-dwelling older persons. 299
Arch Neurol 2009; 66(11):1339-1344.
13
6. Barnes DE, Yaffe K, Satariano WA et al. A longitudinal study of cardiorespiratory fitness and 301
cognitive function in healthy older adults. J Am Geriatr Soc 2003; 51(4):459-465. 302
7. Shephard RJ. Limits to the measurement of habitual physical activity by questionnaires. Br J
303
Sports Med 2003; 37(3):197-206.
304
8. Wilbur J, Marquez DX, Fogg L et al. The relationship between physical activity and 305
cognition in older Latinos. J Gerontol B Psychol Sci Soc Sci 2012; 67(5):525-534. 306
9. Kerr J, Marshall SJ, Patterson RE et al. Objectively measured physical activity is related to 307
cognitive function in older adults. J Am Geriatr Soc 2013; 61(11):1927-1931. 308
10. Myint PK, Kwok CS, Luben RN et al. Body fat percentage, body mass index and waist-hip-309
ratio as predictors of mortality and cardiovascular disease. Heart 2014; 100(20):1613-1619. 310
11. Giles GG, Ireland PD. Dietary Questionnaire for Epidemiological Studies (Version 2), 311
Melbourne, The Cancer Council Victoria, 1996. 312
12. Scott D, Blizzard L, Fell J et al. Prospective associations between ambulatory activity, body 313
composition and muscle function in older adults. Scand J Med Sci Sports 2011; 21(6):e168-314
175. 315
13. Sánchez-Cubillo I, Perieáñez JA, Adrover-Roig D et al. Construct validity of the trail making 316
test: role of task switching, working memory, inhibition/interference control, and visuomotor 317
abilities. J Int Neuropsychol Soc 2009; 15(3):438-450. 318
14. Strauss E, Sherman EMS, Spreen O. A compendium of neuropsychological tests:
319
administration, norms, and commentary, 3rd ed., New York, Oxford University Press, 2006.
320
15. Benedict RHB, Schretlen D, Groninger L et al. Hopkins verbal learning test – revised: 321
normative data and analysis of inter-form and test-retest reliability. Clin Neuropsychol 1998; 322
12(1):43-55. 323
16. González-Palau F, Franco M, Jiménez F et al. Clinical utility of the Hopkins verbal test-324
revised for detecting Alzheimer’s disease and mild cognitive impairment in Spanish 325
14
17. Vanhelst J, Mikulovic J, Bui-Xuan G et al. Comparison of two actigraph accelerometer 327
generations in the assessment of physical activity in free living conditions. BMC Res Notes
328
2012; 5:187. 329
18. Matthew CE. Calibration of accelerometer output for adults. Med Sci Sports Exerc 2005; 330
37(11 Suppl):S512-522. 331
19. Freedson PS, Melanson E, Sirard J. Calibration of the computer science and applications, Inc. 332
accelerometer. Med Sci Sports Exerc 1998; 30(5):777-781. 333
20. Hayes AF, Matthes J. Computational procedures for probing interactions in OLS and logistic 334
regression: SPSS and SAS implementations. Behav Res Methods 2009; 41(3):924-936. 335
21. Preacher KJ, Hayes AF. Asymptotic and resampling strategies for assessing and comparing 336
indirect effects in multiple mediator models. Behav Res Methods 2008; 40(3):879-891. 337
22. Faul F, Erdefelder E, Buchner A et al. Statistical power analyses using G*Power 3.1: tests for 338
correlation and regression analyses. Behav Res Methods 2009; 41(4):1149-1160. 339
23. Scherder E, Scherder R, Verburgh L et al. Executive functions of sedentary elderly may 340
benefit from walking: a systematic review and meta-analysis. Am J Geriatr Psychiatry 2014; 341
22(8):782-791. 342
24. Era P, Sainio P, Koskinen S et al. Psychomotor speed in a random sample of 7979 subjects 343
aged 30 years and over. Aging Clin Exp Res 2011; 23(2):135-144. 344
25. Burns JM, Cronk BB, Anderson HS et al. Cardiorespiratory fitness and brain atrophy in early 345
Alzheimer’s disease. Neurology 2008; 71(3):210-216. 346
26. Colcombe SJ, Erickson KI, Raz N et al. Aerobic fitness reduces brain tissue loss in aging 347
humans. J Gerontol A Biol Sci Med Sci 2003; 58(2):176-180. 348
27. Erickson KI, Prakash RS, Voss MW et al. Aerobic fitness is associated with hippocampal 349
volume in elderly humans. Hippocampus 2009; 19(10):1030-1039. 350
28. Kramer AF, Erickson KI, Colcombe SJ. Exercise, cognition, and the aging brain. J Appl
351
Physiol 2006; 101(4):1237-1242.
352
29. Bland JM, Altman DG. Transformations, means, and confidence intervals. BMJ 1996; 353
15
30. Cain KL, Conway TL, Adams MA et al. Comparison of older and newer generations of 355
actigraph accelerometers with the normal filter and the low frequency extension. Int J Behav
356
Nutr Phys Act 2013; 10:51.
16
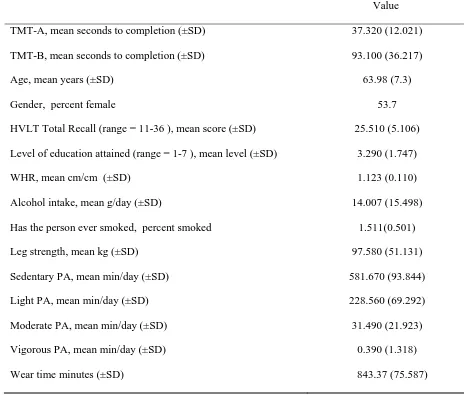
Table 1
Participants characteristics (n = 188).
Value
TMT-A, mean seconds to completion (±SD) 37.320 (12.021)
TMT-B, mean seconds to completion (±SD) 93.100 (36.217)
Age, mean years (±SD) 63.98 (7.3)
Gender, percent female 53.7
HVLT Total Recall (range = 11-36 ), mean score (±SD) 25.510 (5.106)
Level of education attained (range = 1-7 ), mean level (±SD) 3.290 (1.747)
WHR, mean cm/cm (±SD) 1.123 (0.110)
Alcohol intake, mean g/day (±SD) 14.007 (15.498)
Has the person ever smoked, percent smoked
Leg strength, mean kg (±SD)
Sedentary PA, mean min/day (±SD)
Light PA, mean min/day (±SD)
Moderate PA, mean min/day (±SD)
Vigorous PA, mean min/day (±SD)
Wear time minutes (±SD)
1.511(0.501)
97.580 (51.131)
581.670 (93.844)
228.560 (69.292)
31.490 (21.923)
0.390 (1.318)
17
Table 2
Bivariate correlations for variables entered into the multiple regressions (n = 188).
alpha = 0.05. Note: *<0.05, **<0.01.
1 2 3 4 5 6 7 8 9 10 11 12 13 14 15
1 TMT-A 1
2 TMT-B .469** 1
3 Age .206** .281** 1
4 Gender -.082 -.042 .006 1
5 HVLT total recall -.227** -.349** -.164* .314** 1
6 Level of education attained -.063 -.315** .075 -.113 .195** 1
7 WHR -.108 -.121 -.073 .597** .251** -.012 1
8 Alcohol intake .125 -.218** -.123 -.277** .089 .106 -.102 1
9 Has the person ever smoked .019 -.137 .078 .158* .022 -.124 .184* -.160* 1
10 Leg strength .013 -.047 -.198** -.753** -.137 .093 -.406** .268** -.119 1
11 Sedentary PA .082 .050 .147* -.008 .001 .184* -.098 -.045 -.104 -.024 1
12 Light PA -.039 -.242** -.261** .008 .092 -.172* .122 .053 .168* .120 -.621** 1
13 Moderate PA -.047 -262** -.329** -.138 .135 .043 .163* .063 .018 .276** -.384** .412** 1
14 Vigorous PA .030 -.114 -.124* -.104 .057 .105 .055 .136 -.002 .184* .084 .008 .247** 1
18
Table 3
Summary of the multiple regression analysis results for TMT-B (set-shifting performance) (n = 188).
Factor B SE t 95% Confidence Interval for B S2
Lower Bound Upper Bound
Age 0.963 0.331 2.912 0.310 1.616 0.031
HVLT total recall -1.455 0.447 -3.253 -2.337 -0.572 0.038
Level of education attained -6.348 1.336 -4.752 -8.984 -3.712 0.082
Alcohol intake -0.380 0.144 -2.630 -0.664 -0.095 0.025
Has the person ever smoked -13.593 4.558 -2.982 -22.589 -4.598 0.032
Sedentary PA -0.051 0.031 -1.629 -0.112 0.011 0.010
Light PA -0.114 0.043 -2.690 -0.198 -0.030 0.026
Moderate PA -0.180 0.121 -1.484 -0.419 0.059 0.008
Vigorous PA 0.402 1.487 0.270 -2.533 3.337 0.0003
alpha = 0.05. Note: S2 is the squared semi-partial correlation. Whereas, R2 is the percent of variability in the dependent variable that is accounted for by a
linear combination of all factors in the regression model, S2 is thepercent of variability in the dependent variable that is uniquely accounted for by a single