An electron transparent proton detector for neutron decay studies
S. A. Hoedla兲 and A. R. Youngb兲
Triangle University Nuclear Laboratory, Duke University, Durham, North Carolina 27708
H. Ade
Department of Physics, North Carolina State University, Raleigh, North Carolina 27695
A. Lozanoc兲
Department of Chemical Engineering, North Carolina State University, Raleigh, North Carolina 27695
共Received 21 October 2005; accepted 22 February 2006; published online 19 April 2006兲
We have developed an ultrathin共⬍100 nm兲, very strong polyimide foil which can span more than 6⫻6 cm2and is ideal for the fabrication of low energy proton detectors. We have produced a proton detector geometry in which protons incident on the foil with kinetic energies greater than about 25 keV produce, on average, more than ten secondary electrons in a conversion crystal evaporated on the back face of the foil. These secondary electrons can be “postaccelerated” and counted in a variety of detectors. The polyimide foils are much more durable than carbon foils previously used in similar detection geometries. LiF was chosen as the conversion crystal, which is relatively insensitive to exposure to air, improving their secondary electron yield under typical operating conditions. In addition, we describe the operation of a very simple, small scale proton accelerator and detector testing chamber capable of providing up to 10 kHz of beam with energies between 10 and 50 keV onto a biased target with a maximum ion contamination of 0.5%. © 2006 American Institute of Physics.关DOI:10.1063/1.2186970兴
I. INTRODUCTION
Measurements of the angular correlations between the decay products of free neutrons and the initial neutron spin direction provide high precision tests of the standard model without the nuclear structure corrections associated with measurements in higher mass nuclei.1Recent progress in the development of cold neutron beam techniques and ultracold neutron共UCN兲sources has made measurements of free neu-tron decay possible that are directly competitive with the super allowed 0+→0+ decays in lowZ nuclei, and has mo-tivated a generation of experiments on neutron decay.1
A great deal of emphasis has been placed on measure-ments of the asymmetry in neutron decay because the de-tection of the  particle is relatively straightforward. The physics reach of free neutron decay measurements can be greatly extended by the simultaneous detection of both the decay  particle共782 keV end point energy兲and the recoil proton共754 eV end point energy兲.2Because angular correla-tions involving the particle and the proton have differing sensitivities to various extensions to the electroweak stan-dard model,3 one can probe physics beyond the standard model with proton detection capability. In addition to these correlations, implementing simultaneous detection provides one with a powerful tool for eliminating one of the largest systematic uncertainties in previous  asymmetry measure-ments: uncertainty in the absolute degree of neutron
polar-ization. By simultaneously measuringand proton asymme-tries and taking their ratio, one determines a quantity which is independent of the neutron polarization to first order and can be used to extract the relevant physical parameters for neutron decay.
A scheme similar to the one we present here was at-tempted by the PERKEO II group utilizing carbon foils with MgO conversion crystals.4Using this technique as a starting point, we have developed a detector technology which em-ploys more durable and practical foils and utilizes a conver-sion crystal whose electron yield is not strongly degraded by exposure to air and whose performance is superior to MgO when implemented in practical experiments.
In this paper we present the construction and prototype tests of a proton conversion foil. In Sec. II, we outline the motivation for proton conversion foils as low energy proton detectors; next, some of the options we considered for foil substrates and conversion materials are presented 共Secs. III and IV兲. In Sec. V we present measurements of the second-ary yield. We then describe the proton accelerator and detec-tor testing apparatus we constructed to evaluate our foils in Sec. VI. In Sec. VII we present calculations of the resultant proton detection efficiencies for our measured yields, and finally in Sec. VIII we present our conclusions.
II. THE PROTON DETECTION TECHNIQUE
The low energy of the recoil protons makes effective detection a technical challenge. With suitable acceleration, they can be detected with scintillators,3silicon detectors,5or microchannel plate detectors.2Alternatively, the accelerated protons can be converted into secondary electrons.6,7
Our approach is to permit the recoil protons from UCN a兲Present address: Center for Experimental Nuclear and Particle
Astrophys-ics, University of Washington, Box 354290, Seattle, Washington 98195.
b兲Also at Department of Physics, North Carolina State University, Raleigh, North Carolina 27695.
c兲Present address: Instituto de Ciencia y Tecnología de Polímeros, CSIC, Juan de la Cierva 3, 28006-Madrid, Spain.
decay to drift through a fiducial decay volume and then pass a grounded grid共see Fig. 1兲. The protons are then accelerated into a very thin共⬃100 nm兲, biased foil共⬃−25 kV兲. The foil consists of a very strong substrate, coated with a high yield conversion crystal. As the protons exit the backside of the foil, they pass through a ⬃10 nm thick layer of insulating crystal and liberate secondary electrons. These secondary electrons are then accelerated by the foil bias into a conven-tional electron detector: a gas counter, a plastic scintillator, or even a silicon detector. Electrons from neutron decay pass through the foil unhindered and can be detected by the same electron detector.
This technique allows one to use a -decay spectrom-eter, such as the one already under construction by the UCNA collaboration at Los Alamos8to measure the asym-metry, as a complete neutron decay detector. By placing the proton to electron conversion foils in front of the electron detectors, one can simultaneously detect and identify the electrons and protons from neutron decay.
III. THE SUBSTRATE
Carbon foils, used as substrates for nuclear physics tar-gets, are a natural choice for the detector foil. Reference 4 reports the production of 8 – 22g / cm2 thick foils over square apertures of 13⫻9.5 cm2. Unfortunately, these foils must be handled with extreme care. Table I lists other can-didates and their relevant properties. We found that 6F6F
共synthesized in one of our laboratories兲 offered the most promise due to its tensile strength, temperature stability, and ease of thin-film manufacture.
6F6F 共CAS No. 32036-79-6 or CAS No. 29896-40-0 also known as 6FDA-4,4
⬘
-6FDA兲is a fluorinated polyimide which is synthesized through a condensation reaction be-tween dianhydride and diamine monomers. 共See Ref. 9 for an example of a synthesis process and see Ref. 10 for a summary of industry standard select properties, but note that our 6F6F probably derives its great strength from the high molecular weight synthesis process developed by one of the authors of this paper, Lozano.兲 6F6F is soluble in polar organic solvents, such as tetrahydrofuran 共THF兲 or N-methyl-2-pyrrolidone. The H2O contact angle for 6F6F foils still on a silicon substrate was 83.5± 0.2°, indicating that the foils are slightly hydrophilic. These properties enable a simple and inexpensive manufacture method of very thin 6F6F foils: spin coating.Our manufacture process is as follows: We first mixed a 1% solution, by weight, of 6F6F in high purity THF in a precleaned共through a plasma discharge process兲20 ml boro-silicate glass vial 共I-CHEM C226-0020兲. The mixture was stirred with a teflon coated magnetic rod for 4 h and then allowed to sit over night. The mixture was then filtered twice through a 0.2m polytetrafluoroethylene共PTFE兲membrane with a glass microfiber prefilter in a polypropylene housing 共Whatman AV125EORG兲 and then stored in a second pre-cleaned vial.
We spun our foils onto 100 mm diameter silicon wafers. The polarity of the silicon共norp兲and crystal orientation of the surface were not critical. The surface of the wafers, as received from the manufacturer, was extremely hydrophobic. THF, a polar solvent, will not wet a hydrophobic surface, and thus, spin coating on the silicon wafers as delivered was not possible. We therefore treated the silicon surface with a mer-cury discharge lamp in ambient atmospheric conditions for 1 h. The UV light, in combination with the ozone generated by the UV interaction with atmospheric O2, terminated the surface with ⬃10 Å of hydrophilic SiO2 and removed any residual hydrocarbon contamination.11 Before spin coating, the wafer was given a rinse with de-ionized water and blown dry with filtered research grade N2. The rinse step ensured that at least a monolayer of H2O covered the silicon surface. The 6F6F/THF solution was extracted from the storage vial into a 5 ml polyethylene/polypropylene syringe through a B-D 20G 1 1 / 2 precision glide needle. 3 ml of the solution was then deposited through the needle onto the silicon wafer which was then immediately spun at 1000 rpm for 30 s. The surface tension of the polymer/solvent solution, in combina-tion with the adhesion 共or wetting兲 of the solution to the substrate, balances the centrifugal force of the spinning ac-tion to produce a layer of uniform thickness. The thickness is a function of the polymer concentration in the solvent solu-tion and the speed of rotasolu-tion. A theoretical descripsolu-tion of the process for polystyrene thin films is presented in Ref. 12.
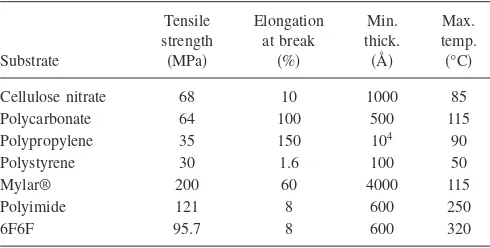
Following the above surface treatments, removal of the 6F6F foil from the silicon substrate was very easy. Held at the edges by hand, we slowly dipped the silicon wafer into a tank of water at a slight angle to the surface of the water. The TABLE I. Selected properties of prospective substrate materials taken from
Refs. 29–31 and www.goodfellow.com. The minimum thickness of polyim-ide and 6F6F is from this research. The minimum thickness of polystyrene is from Ref. 12. Mylar® is biaxially oriented.
Substrate
Tensile strength
共MPa兲
Elongation at break
共%兲
Min. thick.
共Å兲
Max. temp.
共°C兲
Cellulose nitrate 68 10 1000 85 Polycarbonate 64 100 500 115 Polypropylene 35 150 104 90
Polystyrene 30 1.6 100 50
Mylar® 200 60 4000 115
Polyimide 121 8 600 250
6F6F 95.7 8 600 320
6F6F immediately parted from the wafer and floated onto the surface of the water. When sufficient polymer had floated off, we could use our other hand to take hold of the waferunder the surface of the water and continue parting the foil from the silicon. Once completely removed, the wafer was al-lowed to drop to the bottom of the water tank. We gently removed the 6F6F foil from the surface of the water by care-fully positioning an edge of an appropriate frame next to the foil. Equally carefully, the edge of the foil was made to con-tact an edge of the frame, whereupon the foil would adhere to the frame. The frame was then slowly lifted from the water, perpendicular to the water surface, such that the foil spanned the opening area of the frame. The frame/foil combination was then heated at a moderate temperature 共⬃30 ° C兲until the water evaporated, and the foil relaxed in the frame to achieve a taut surface. The smallest foils made via this method were on circular frames with an open diam-eter of 0.64 cm. The largest foils were circular with a 10 cm diameter and mounted on square frames with an open side of length 5.6 cm. The strength of the resulting foils is impres-sive. In contrast to carbon foils, one can walk, talk, and breath on 6F6F foils in open air without breaking them. They also routinely survived pump down in vacuum systems with-out requiring a lengthening of the roughing pump time.
We measured the mass thickness of the 6F6F foils by measuring the energy loss of a 45 keV proton beam through the foil. The proton accelerator is described in Sec. VI. The 6F6F foil was mounted so that it could be moved out of the beam, thus allowing the 50 mm2 silicon detector to be cali-brated by the proton beam itself. Using a SRIM2000 simulation,13 we estimated the energy loss of a 45 keV pro-ton beam through the 6F6F foil as a function of the foil thickness, taking into account the angular acceptance of the 50 mm2 silicon detector 共⌬= 0.02 rad兲. With this method, we measured the thickness of two foils to be 11.5± 1.5 and 8.6± 1.0g / cm2. The results are summarized in Table II. The two foils were manufactured using the same technique as described above, by the same experimenter, on the same day, indicating that the foil thickness is not easy to precisely reproduce.
IV. THE CONVERSION CRYSTAL
Typical secondary electron emitters include metal oxides and alkali halides. Note that the yield from 6F6F, as that of most plastics, is relatively poor at, on average, 1 secondary per incident proton. In selecting a crystal, the overriding con-straints are that the crystal must be able to be easily and cheaply deposited onto 6F6F, and must be able to survive exposure to the ambient atmosphere. Promising candidates
include LiF, Al2O3, hexatriacontane and diamond due to their high yield and surface stability. Note that although MgO has been considered in the past for similar applications, its surface is more reactive than that of NaCl to both H2O and CO2;14 the secondary yield is not stable to exposure to these gases.15
Al2O3has the distinct advantage that its surface is robust to atmospheric exposure. Alumina ceramic has an electron impact induced secondary yield between 5 and 7 at an inci-dent energy of 1 keV. At the same energy, a sapphire crystal has a yield of 10.1.16 Deposition of Al2O3 on 6F6F foils, however, may be difficult. Of the alkali halides, LiF has the most stable surface. At an incident energy of 600 eV, a vacuum cleaved crystal has a peak yield of 7.15At an inci-dent energy of 1.1 keV, a vacuum evaporated thin film has a peak yield of 8.17 Brief exposure of LiF to water vapor ap-pears to reduce the electron affinity and increase the second-ary yield.18 The principal advantage of LiF is the ease of thermal vacuum deposition. In this paper, we explore how well LiF will work as a conversion crystal. For comparison we also have tested CsI, since it is a common photocathode material for x-ray and UV photon detectors.19
In passing, we note two additional materials which we have identified, warranting further research due to their negative electron affinity 共NEA兲: Hexatriacontane18 共HTC, n-C36H74, CAS No. 630-06-08兲and deuterium or cesium ter-minated diamond-like-carbon.20–22 NEA materials present the distinct advantage that low energy secondary electrons created in the crystal which reach the material surface are “pushed” out of the crystal instead of reflected back into the material by the more typically positive work function. In addition, these materials have long secondary electron at-tenuation lengths, meaning that secondaries created deep in the material have a greater chance of reaching the surface. From a practical perspective, both HTC and hydrogen termi-nated diamond are resilient to atmospheric exposure, and stable in UHV conditions. HTC can also be readily vacuum evaporated.
V. MEASURED SECONDARY YIELD
We constructed proton conversion foils in the following manner. First, we manufactured 67.5 nm thick 6F6F films supported on stainless steel frames with a circular aperture of 6.3 mm. Next, we evaporated Al onto both sides of the 6F6F. The Al provides electrical conductivity to the foil, necessary for continuous proton conversion. Without breaking vacuum, we next evaporated the conversion crystal. Table III summa-rizes the deposition parameters. The deposition vacuum was maintained through a LN2 cold trap by an oil diffusion pump, filled with Santovac 5, backed by an oil-based rough-TABLE II. The results of energy loss measurements through two 6F6F foils.
We assume a mass density of 1.47 g / cm3from Ref. 10. The uncertainty in
the areal density is dominated by the uncertainty of the proton stopping power in 6F6F.
Foil Eloss共keV兲 Areal density共g / cm2兲 Thickness共Å兲
1 7.5 11.5± 1.5 780± 100
2 5.6 8.6± 1.0 580± 75
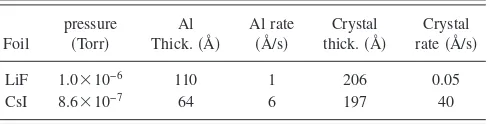
TABLE III. The vacuum evaporation deposition parameters for the proto-type detectors.
Foil
pressure
共Torr兲
Al Thick.共Å兲
Al rate
共Å/s兲
Crystal thick.共Å兲
Crystal rate共Å/s兲
LiF 1.0⫻10−6 110 1 206 0.05
ing pump. The aluminum source was a piece of 99.99% pure aluminum wire in a tantalum boat. The LiF source was a 99.9% pure powder in a tantalum boat. The CsI source was a single crystal, also in a tantalum boat. All sources were prop-erly out-gassed before evaporation. Immediately following the evaporation, all foils had a mirrorlike quality. After 5 to 10 min of exposure to air, however, the CsI foil rapidly acquired an opaque blue appearance. After a few hours of exposure to the atmosphere, the LiF foils became crinkly. Once placed in an evacuated chamber, however, the LiF foils regained their mirrorlike appearance, indicating that either the 6F6F or the LiF layer absorbed atmospheric gases or water vapor. The CsI foil never lost the blue color, indicating a permanent change most likely due to water adsorption.
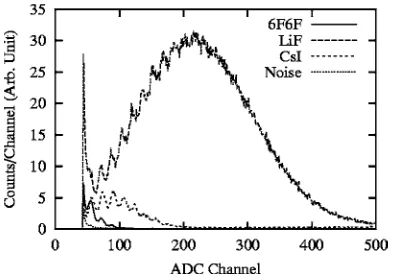
Each detector was exposed to a proton beam with a ki-netic energy between 20 and 45 keV and at a rate between 100 and 1000 Hz. At each energy, the proton detectors were biased to −20 kV. The liberated secondary electrons were accelerated into a silicon detector with an efficiency of nearly 100%共see the discussion at the end of this paper兲. The pulse height histogram of the pulses from the silicon detector was then recorded with an Ortec PC-based multi-channel analyzer. The extraction and focus voltages of the electrode structure were adjusted to maximize the mean of the pulse height distribution共see discussion at end of this paper兲. Fig-ure 2 presents representative spectra for an uncoated 6F6F foil, a CsI coated foil, and a LiF coated foil, at an incident proton energy of 45 keV. The first peak is due to electronic noise and proton energy deposition in the silicon detector. We hypothesize that the first electron peak is near analog-to-digital converter 共ADC兲 channel 50. The 6F6F itself gener-ates few secondary electrons. The CsI coated foil also gen-erates relatively few SE; yet, the CsI spectrum also has a very long tail. We hypothesize that the tail may be due to the scintillating properties of CsI. The protons may be creating scintillator light, which, in turn, excites the silicon detector or liberates secondaries from other parts of the vacuum sys-tem, which, in turn, are detected by the silicon detector.
Focusing now on LiF coated foils, interpretation of the secondary electron spectrum is complicated by two factors:
electron backscatter from the silicon detector itself and pro-ton field reflection from the electric fields in the focusing electrodes共also referred to as a proton “bounce” in this pa-per兲. 20 keV electrons have a 17% chance of backscatter from silicon; scattered electrons have a much lower chance of being seen in the detector and thus reduce the observed secondary yield. Protons which exit the 6F6F foil will decel-erate in the electric fields; if their energy is low enough, they will turn around, hit the 6F6F foil, and generate another sec-ondary electron shower. Using a SRIM2000calculation to es-timate the proton energy and direction after passage through the foil, combined with an electric field transport algorithm to trace the path of the protons in the electrode structure, we estimate that only 9% of the protons for the 25 keV test returned to the foil and generated secondary electrons that could be seen. For the 35 and 45 keV test cases, we esti-mated that no protons could return to the foil. The spectra presented in Fig. 2 are thus dominated by single proton-foil interactions.
We analyzed the spectrum in the following manner. First, a Gaussian fit was applied to the first 11 electron peaks in the spectrum to identify the electron number as a function of the ADC channel. On the basis of these fits, the spectrum was rebinned in units of the electron number to simplify the analysis. One can show that electron backscatter from the surface of our Si detector changes the observed probability distribution according to
Pobs共N兲=
兺
n=N
⬁ n!
N!共n−N兲!共1 −兲
Nn−N
Plib共n兲, 共1兲
where N is the number of secondary electrons observed in the silicon detector, is the probability that a 20 keV elec-tron will backscatter共0.17兲, andPlib共n兲is the probability that nelectrons will be liberated by one incident proton. We have considered two possible forms ofPlib共n兲: first, neglecting the possibility of a proton field reflection, we let
Plib=e−共n−兲2/22. 共2兲
Second, to account for a proton field reflection, we let FIG. 2. The pulse height spectrum in the silicon detector when prototype
uncoated and CsI and LiF coated foils were exposed to a 45 keV proton beam. The first peak in the spectrum was due to electronic noise; the addi-tional distinct peaks in the spectrum represent addiaddi-tional electrons liberated by the foil and detected by the silicon detector. Each secondary had an energy of 20 keV. The absolute normalization of the spectrum are scaled for clarity.
Plib共n兲=共1 −b兲P共n兲+b
兺
j=0
j=n
P共j兲P共n−j兲, 共3兲
where b is the probability that a proton will return to an active area of the proton detector, andP共n兲is the probability that a single proton traverse or impact will liberate n elec-trons. In this second case,P共n兲is chosen to be
P共n兲=e−共n−兲2/22. 共4兲
For the two forms of Plib共n兲, ,, andb, are estimated on the basis of a nonlinear least-squares fit to the rebinned data. Figure 3 plots the 25 keV rebinned data and the two fits. Table IV lists the fit parameters at each proton energy. Notice that the proton field reflection fit accounts for the distribution tail much better than the backscatter fit alone suggesting that we saw evidence for proton field reflection. The proton re-turn probability b is consistent with our expectations at 25 keV, but not at 35 or 45 keV. Other rare events may contribute to the probability tail, such as proton impact on the focusing electrode structure, an occurrence that would mimic a proton field reflection. Note that the difference in the estimated yield is less than 3% between the two fitting cases. Note also that to an accuracy of 5%, the average yield can be estimated on the basis of a Gaussian fit to the ob-served spectrum:=obs/共1 −兲. The width of the Gaussian distribution is much broader than expected from counting statistics alone: = 1.7
冑
. This is probably due to energy and angle straggle of the protons through the foil.We performed a simple aging test for the LiF prototypes in the following manner. Two prototype detectors, each coated with 50 Å of Al followed by 60 Å of LiF at a depo-sition rate of 0.25 Å / sec, were manufactured simultaneously. The secondary yield of one foil at 45 keV was immediately measured. After one week storage in a container filled with ambient air, the yield of the other foil at 45 keV was mea-sured. Figure 4 plots the spectra. The average yield 共 cor-rected for electron backscatter兲 fell from 12.5 to 6.5. The reduced variance,/
冑
increased from 1.7 to 2.2. Clearly, despite the stability of the LiF surface, care must be taken for long term storage of the LiF foils.VI. A SIMPLE PROTON ACCELERATOR
To test the prototype conversion foils and obtain the data presented in Sec. VI, we built a simple proton accelerator 共see Fig. 5兲 capable of providing protons at a rate of 0 – 10 kHz with a kinetic energy up to 50 keV and a maxi-mum ion contamination of less than 0.5%. The accelerator consisted of the following elements in beam order: a H2 vari-able leak and gas handling system, a 100 W light bulb
fila-ment and associated power supply, a 60 kV electrostatic ac-celeration column, a dry pumping station, an electromagnet to separate the ion species, and a series of apertures to define the entrance and exit path of the beam. Note that due to the very low count rate requirements, neither steering nor focus-ing elements were necessary or used. Each side of the accel-eration column could be biased independently of the other to ±40 kV. This bias scheme allowed the proton energy, deter-mined by the potential difference across the acceleration col-umn, to be different than the foil bias. Except for the proton source, all electronics, such as pumps, the magnet, and the electron detectors were operated at ground potential. The end of the accelerator was connected to a detector testing chamber.
Protons were liberated from H2by the ionizing action of electrons emitted by a hot, 100 W light bulb filament sus-pended between two feedthroughs in the middle of a 5 cm long, 11 cm OD Al spool piece 共see Fig. 6兲. The upstream end of this spool piece was closed off by a brass plate, opened at the edges for vacuum pump out. The downstream end was limited by an Al aperture, directly connected to the acceleration column. The exit aperture and filament were held at a fixed potential by a high voltage power supply. The cylindrical walls and brass plate were positively biased with a 300 V battery with respect to the filament and exit aper-ture. The bias served to extract electrons from the filament and provide sufficient energy for H2ionization in addition to focusing the ions through the exit aperture. The filament was powered by a variac connected to a 50 kV, 250 W, isolation transformer.
Following the acceleration column, the ions passed TABLE IV. The fit parameters for the prototype LiF foil.
Incident energy共keV兲
Backscatter Proton bounce
b
25 10.3 5.6 10.0 5.2 0.08 35 12.2 6.1 11.9 5.8 0.07 45 13.3 6.7 13.1 6.6 0.03
FIG. 4. The spectra from a LiF prototype tested immediately by a 45 keV proton beam and tested after one week exposure to atmospheric conditions.
through two 3 mm diameter circular apertures punched in a 0.25 mm thick tantalum foil placed 30 cm apart at a suffi-cient distance from the bending magnet to ensure that the fringe field from the bending magnet was less than the Earth’s field. After the apertures, the protons passed through a 15 cm diameter, 2.5 cm high, cylindrical bending magnet chamber by making a 30° turn. The magnet chamber, biased at up to +40 kV, was insulated from the grounded magnet pole tips by a 6 mm thick sheet of ultra high molecular weight共UHMW兲polyethylene. UHMW polyethylene has the highest known dielectric strength共2300 V / mil兲 of the com-mercially available plastics. After the bend, the ions traveled through another two 3 mm diameter apertures located 100 cm apart.
A. Tests of the proton accelerator
At a fixed proton source pressure 共5⫻10−5Torr兲, fila-ment power 共5 W兲, and acceleration potential 共40 kV兲, we recorded the count rate in a channeltron detector, positioned immediately downstream from the last aperture, as a function of the magnetic field in the bending magnet. A representative scan is plotted in Fig. 7. By also introducing He gas, we were able to positively identify four peaks due to H2: H+, H2+, H3+, and a peak due to the dissociation of H2+ into H and H+. Assuming a circular path in the bending magnet, and an equal sharing of momentum in the dissociation case, one would expect the magnetic field of the peaks
Hdis: H+: H 2 +: H
3
+: He+to be in the ratio 1 /
冑
2 : 1 :冑
2 :冑
3 : 2. Wefind the ratio to be 0.682:1:1.43:1.76:2.04. The deviation from the expected ratio is less than 3%.
We realized the best performance when hydrogen gas was not leaked into the vacuum. See Fig. 8 for a scan at 25 keV. The operation proceeded as follows: first, we flooded the vacuum system with H2 up to a pressure of 1
⫻10−3 Torr. We then pumped out the H
2to a pressure of 1
⫻10−5 Torr before operating the accelerator. When the ac-celerator was used continuously, H2 “treatments” were needed approximately once a day. A very conservative limit on the ion species contamination can be determined by di-viding the peak height by the value of the lowest trough at fields above the H+peak. We put an upper bound on the ion contamination of 1.2% at 10 keV, 0.3% at 25 keV, and 0.1% at 40 keV.
B. The detector testing chamber
We built a detector testing chamber共see Fig. 9兲 which had four critical elements: an inner beam pipe to carry the beam pipe potential from outside the detector chamber FIG. 6. A scale schematic of the proton source. The filament and exit
aper-ture could be biased up to ±40 kV共HV in the diagram兲.
FIG. 7. Count rate in a Channeltron detector, as a function of the field in the bending magnet for hydrogen and helium gas. The origin of the lowest field, unlabeled peak remains unknown. The He gas case has been scaled down by a factor of 1000 for greater clarity.
FIG. 8. An example of the count rate in the Channeltron detector as a function of the magnet current when H2was not continuously introduced
into the accelerator.
FIG. 9. A cross section schematic of the inside of the detector chamber. For clarity, structural elements are not shown. These include support and guide rails for the inner beam pipe, the detector translation stage, insulating sup-ports for the focus electrodes, and the mounting fixtures of the 50 mm2
through the inside of the chamber to the surface of the biased foil, a vertically translatable silicon detector共25 mm2 active area兲 to monitor the proton beam quality, a horizontal and vertical translation stage to scan the spatial response of the foils, and electrode elements to focus secondary electrons created by the conversion foil into another silicon detector 共50 mm2active area兲located at the end of the chamber. The 25 mm2 detector was mounted on a copper cold finger con-nected to a LN2dewar in the vacuum system. Brass collars at the ends of the inner beam pipe minimized beam defocusing by ensuring that electric potential gradients were far from the center of the beam path. The chamber could achieve an ulti-mate pressure of 5⫻10−7Torr.
C. Secondary electron focusing elements
The energy and angle distribution of secondaries pro-duced by proton passage through LiF or CsI is unknown. For electron23and ion24impact on Al, a cosweighted distribu-tion has been observed. X-ray impact on LiF gives a peak secondary energy of ⬃3 eV and a maximum secondary en-ergy of 16 eV.25 It is expected that the energy and angle
distribution of the secondaries is independent of the type or energy of the incident radiation.26We designed the electrode structure to optimally focus secondaries produced in a 3 mm radius circle 共twice the radius of the final beam aperture兲 with a cos weighted angular distribution with energies be-tween 0.1 and 50 eV into the 50 mm2silicon detector.
For a small diameter −20 kV biased foil, our design con-sisted of an extraction plate 共biased to −19 kV兲, which en-sured optimal collection and prefocusing of the secondary electrons, an acceleration region, which accelerated the elec-trons to their full energy, and an Einzel lens, consisting of a ground cylinder, a biased cylinder 共−15 kV兲, and then an-other ground cylinder, which provided the final focus. A la-beled cutaway view of the equipotential surfaces is presented in Fig. 10. The trajectory path of 0.1 and 50 eV electrons is presented in Fig. 11. A Monte Carlo simulation of the trans-port of 104 electrons calculated a collection efficiency of 100% for both 0.1 and 50 eV electrons. For larger foils, we added a 2 mm pitch grid biased at +200 V with respect to the foil between the foil and the extraction plate. This grid FIG. 10. A cutaway view of the equipotential surfaces near the focus elements as calculated byRELAX3D. Each equipotential surface represents 5% of the potential of the proton foil共typically −20 keV兲. The inner beam pipe, located immediately to the left of the proton detector, and the 200 V grid used for larger detection foils, are .
prevented larger foils from breaking due to the electrostatic force between the foil and the extractor plate.
VII. SIMULATED PROTON COUNTING EFFICIENCIES
Any electron detector could be used to observe second-ary electrons共SEs兲from the proton conversion foil; a multi-wire proportional counter共MWPC兲, however, offers perhaps the simplest way to distinguish-decay electrons from sec-ondary electrons. With a series of Monte Carlo simulations we have studied the expected response. The model MWPC consists of a 6m thick mylar entrance window followed by a 2.0 cm thick active region filled with 100 Torr of neopen-tane
共C5H12, = 3.8⫻10−4 g / cm3兲 and a 6m thick mylar MWPC exit window. Neopentane was chosen as a prospec-tive MWPC fill gas due to its high ion pair yield共estimated to be 1 ion pair/88 eV deposited27兲 and low averageZ. For analysis simplicity, we assume that the ion collection effi-ciency in the MWPC is 100%.
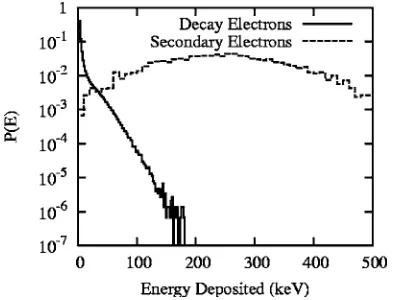
We simulated the impact of 3000 protons on a 30 kV biased conversion foil backed by the model MWPC. For each proton impact on the conversion foil, the number of liberated secondaries was sampled from a Gaussian distribu-tion with a mean of 20 and a standard deviadistribu-tion of 7.6, consistent with the measured statistical distribution. Using a PENELOPEsimulation,28the total energy deposition in the ac-tive region of the MWPC was modeled for this number of normal incident 30 keV electrons. For comparison, the en-ergy deposition by electrons from  decay in the UCNA experiment was also modeled withPENELOPE. Note that this simulation includes the effect of a magnetic field expansion region in the decay spectrometer which parallelizes the elec-tron trajectories and reflects backscatter elecelec-trons back into the MWPC. Figure 12 plots the results of these simulations. We find that with an energy deposition threshold of 75, 100, and 125 keV, protons will be detected with an efficiency of 97%, 94%, and 90% respectively. If a 125 keV energy cut is applied to separate -decay electrons from protons, we an-ticipate that only 0.02% of the -decay electrons will be misidentified as protons in the MWPC. In the UCNA project, a plastic scintillator will be implemented behind the MWPC
for -decay detection. Thus, a proton signal in the MWPC will not be miscounted as a-decay electron.
Lastly, the energy loss and backscatter of-decay elec-trons due to passage through the conversion foil was simu-lated. We find that only 0.12% of the incident flux is back-scattered from the conversion foil with an energy greater than 50 keV and only 0.02% is backscattered with an energy greater than 75 keV. The same simulation indicates that 99% of the transmitted -decay electrons will lose less than 1 keV, 99.9% will loose less than 3 keV, and 99.99% will loose less than 5 keV. By comparison 99.9% of the-decay electrons will loose more than 1 keV on passage through the MWPC.
VIII. CONCLUSIONS
The development of electron transparent, low energy proton detectors holds the promise of greatly extending the physics reach of neutron decay experiments currently de-signed to detect onlyparticles following neutron decay. By suitably spin coating a fluorinated polyimide 共6F6F兲 on a silicon wafer we have been able to fabricate 600 Å thick plastic substrates which can span more than 6⫻6 cm2. At neutron decay energies, electrons are nearly unaffected by passage through such material. Perhaps more critically, these foils are substantially stronger and more durable than carbon foils used for similar applications in the past. The addition of a thin layer of LiF enables the conversion of 25 keV recoil protons into⬃10.3 secondary electrons, which when instru-mented in a suitable high voltage stack, can be readily de-tected in a neutron decay spectrometer. Given the measured yield, we estimate a proton detection efficiency of nearly 97% when instrumented in front of a simple multiwire pro-portional counter. Furthermore, we have constructed a small scale proton accelerator optimized for proton detector devel-opment.
As a final note, we believe that the small scale proton accelerator we have developed for the proton detector devel-opment work may be useful to others working on related problems.
ACKNOWLEDGMENTS
Thanks to Werner Tornow for his interest and support. This research was funded through DOE Grant Nos. DE-FG02-97ER41033, DE-FG02-03ER41231, DE-FG02-97ER41042 and NSF Grant Nos. 0100689 and 9807133. Thanks also to Bicron Inc. for the CSI crystal.
1H. Abeleet al., Phys. Rev. Lett. 88, 211801共2002兲. 2A. P. Serebrovet al., Sov. Phys. JETP 86, 1074共1998兲. 3B. G. Erozolimski
, Y. A. Mostovoi, V. P. Fedunin, A. I. Frank, and O. V. Khakhan, Sov. J. Nucl. Phys. 28, 48共1978兲.
4A. Stolarz and P. Maier-Komor, Nucl. Instrum. Methods Phys. Res. A
480, 194共2002兲.
5L. J. Lisinget al., Phys. Rev. C 62, 055501共2000兲.
6C. Stratowa, R. Dobrozemsky, and P. Weinzierl, Phys. Rev. D 18, 3970
共1978兲.
7A. L. Hallin, F. P. Calaprice, D. W. MacArthur, L. E. Piilonen, M. B.
Schneider, and D. F. Schreiber, Phys. Rev. Lett. 52, 337共1984兲.
8A. R. Young, C. Morris, and the UCNA Collaboration, inFundamental
Physics with Pulsed Neutron Beams, edited by C. R. Gould, G. L. Greene,
F. Plasil, and W. M. Snow共World Scientific, Singapore, 2000兲, p. 164. FIG. 12. A Monte Carlo energy deposition histogram in the MWPC due to
9M. K. Ghosh and K. L. Mittal,Polyimides: Fundamentals and
Applica-tions共Marcel Dekker, New York, 1996兲.
10Polymers—A Property Database, edited by B. Ellis共Chapman and Hall/
CRC, New York, 2000兲.
11L. Zazzera and J. F. Evans, J. Vac. Sci. Technol. A 11, 934共1993兲. 12D. B. Hall, P. Underhill, and J. M. Torkelson, Polym. Eng. Sci. 38, 2039
共1998兲.
13J. F. Ziegler, J. P. Biersack, and U. Littmark,The Stopping and Range of
Ions in Solids 共Pergamon, New York, 1985兲; the most recent version,
SRIM2003is available from www.srim.org
14J. Heidberg, inAdsorption on Ordered Surfaces of Ionic Solids and Thin
Films, Springer Series in Surface Sciences Vol. 33, edited by H.-J. Freund
and E. Umbach共Springer-Verlag, New York, 1993兲.
15N. R. Whetten, J. Appl. Phys. 35, 3279共1964兲.
16J. P. Ganachaud and A. Mokrani, Surf. Sci. 334, 329共1995兲.
17M. V. Gomoyunova and N. A. Letunov, Sov. Phys. Solid State 7, 316
共1965兲
18A. Buzulutskov, A. Breskin, and R. Chechik, J. Appl. Phys. 81, 466
共1997兲.
19A. Breskin, Nucl. Instrum. Methods Phys. Res. A 371, 116共1996兲. 20A. Shih, J. Yater, P. Pehrsson, J. Butler, C. Hor, and R. Abrams, J. Appl.
Phys. 82, 1860共1997兲.
21J. B. Miller and G. R. Brandes, J. Appl. Phys. 82, 4538共1997兲. 22J. E. Yater and A. Shih, J. Appl. Phys. 87, 8103共2000兲. 23H. Jahrreis and W. Oppel, J. Vac. Sci. Technol. 9, 173共1972兲.
24J. Mischler, N. Benazeth, M. Negre, and C. Benazeth, Surf. Sci. 136, 532
共1984兲.
25B. L. Henke, J. Liesegang, and S. D. Smith, Phys. Rev. B 19, 3004
共1979兲.
26J. Schou, Scanning Microsc. 2, 607共1988兲.
27F. Sauli, inExperimental Techniques in High Energy Physics, edited by T.
Ferbel共Addison-Wesley, Menlo Park, CA, 1987兲.
28J. Sempau, E. Acosta, J. Baró, J. M. Fernández-Varea, and F. Salvat, Nucl.
Instrum. Methods Phys. Res. B 132, 377共1997兲.
29B. C. Auman, inAdvances in Polyimide Science and Technology:
Pro-ceedings of the Fourth International Conference on Polyimides, edited by
C. Feger, M. M. Khojasteh, and M. S. Htoo共Technomic, Lancaster, PA, 1991兲, pp. 15–32.
30F. R. Powell, R. A. M. Keski-Kuha, M. V. Zombeck, R. E. Goddard, G.
Chartas, L. K. Townsley, and J. M. Davis, in Grazing Incidence and
Multilayer X-ray Optical Systems, edited by R. B. Hoover and A. B.
Walker共SPIE, Bellingham, WA, 1997兲, Vol. 3113, pp. 432–440.