ABSTRACT
DUTTON, KATHRYN CHRISTINE. Consumer Acceptance of Nonwoven Fabrics for Apparel and Accessory End-Uses. (Under the direction of Dr. Cynthia L. Istook.)
Technological advancements have made substantial strides in the development of nonwoven fabrics. New generations of nonwoven fabrics are more durable, have better drape, are stretchable, and overall have a better hand than past generations of nonwoven fabrics. With these advancements come new product development opportunities. One possible opportunity is expansion into the apparel and accessories market, not as a support fabric, but as the shell (visible, outside) fabric.
The purpose of this study was to determine the consumer’s acceptance of nonwoven fabrics for apparel and accessory end-uses through the use of subjective fabric hand evaluation. A review of the literature guided the development of an appropriate subjective fabric hand evaluation method to study the average consumer’s acceptance of traditional woven fabrics versus spunlaced (spunbond and hydroentangled) nonwoven fabrics. In the development of this study, Bishop’s (1996) six elements were considered, in addition to, three key publications: Civille and Dus (1990); Cardello, Witherhalter, and Schutz (2003); and the AATCC Evaluation Procedure 5: Guidelines for the Subjective Evaluation of Fabric Hand (2006).
were conducted simultaneously. In Part I of the experiment, the subjects were asked to rate each of the six fabrics for comfort and five different attributes – cool/warm, smooth/rough, thin/thick, flexible/stiff, and tight/stretchy. The samples were presented to the subjects, one at time, in random order, and kept from their view. In Part II of the experiment, the subjects conducted a simple ranking procedure. They were shown four images, one a time, in random order. The four images included a short sleeve button-down collared shirt, a long sleeve button-down collared shirt, a pair of pleated shorts, and a bag. The six fabric samples were placed in front of the subjects in random order, on a non-textured, non-metal table. Again, the fabrics were kept from their view. The subjects were asked to rank the fabrics in order from most desirable (best) to least desirable (worst) for the image. Through the use of the statistical software JMP, nonparametric statistics were conducted to analyze the data and respond to the research questions.
Consumer Acceptance of Nonwoven Fabrics for Apparel and Accessory End-Uses
by
Kathryn Christine Dutton
A dissertation submitted to the Graduate Faculty of North Carolina State University
in partial fulfillment of the requirements for the Degree of
Doctor of Philosophy
Textile Technology Management
Raleigh, North Carolina 2009
APPROVED BY:
___________________________ ___________________________
Dr. Roger Woodard Dr. Michelle Jones
___________________________ ___________________________
Dr. Behnam Pourdeyhimi Dr. Cynthia Istook
ii
DEDICATION
To my wonderful family,
Mom, Dad, and Rho,
for all of their loving support and understanding.
^]
To Ben,
who may not have known what he was getting into three years ago,
but was there for support and encouragement
iii
BIOGRAPHY
iv
ACKNOWLEDGEMENTS
I would like to thank my committee chair, Dr. Cynthia Istook, for her guidance and support throughout this process and my college career. I would also like to thank my committee members Dr. Behnam Pourdeyhimi, Dr. Michelle Jones, and Dr. Roger Woodard. Dr. Pourdeyhimi’s knowledge and patience, with regard to fabric selection and preparation, was much appreciated. In addition, he provided me with opportunities throughout my graduate career that will not be soon forgotten. I have respected Dr. Jones throughout my college career for her knowledge, guidance, and support. Her open door policy and probing questions, resulted in many “ah ha” moments. Additionally, I now understand what she meant when she said, “you eat, sleep, live, and breathe your research!” Finally, without Dr. Woodard, I would still be buried under a pile of raw data. His guidance and extreme patience in answering all of my statistical questions was truly appreciated.
I would also like to thank the Nonwovens Cooperative Research Center (NCRC) for funding this research. My experiences as a NCRC student have been invaluable. The knowledge gained during this program will carry with me throughout my career. A special thank you to the following members of my industry committee; Carol Clemens, Bryan Colpo, Anna Conrad, Rory Holms, Frederic Noelle, Steve Ogle, Jan O’Regan, and Melissa Stewart.
v
an electronic version of my survey. Without him, I would still be sorting through surveys and entering data into excel.
A very big thank you to my family; who have always provided unconditional love and support. They have been there when the times got rough, but were not afraid to remind me that no one ever said this was going to be easy.
vi
TABLE OF CONTENTS
LIST OF TABLES ... ix
LIST OF FIGURES ... xiii
CHAPTER I: INTRODUCTION ... 1
Purpose of this Study ... 2
Significance of this Study ... 3
Scope of this Study ... 4
Limitations of this Study ... 4
CHAPTER II: LITERATURE REVIEW ... 5
Nonwovens and Apparel ... 5
Consumer Behavior ... 7
Comprehensive Consumer Decision-Making Process Models ... 8
Influence of the Internet ... 16
Future of Consumer Decision-Making Models in Apparel ... 17
Consumer Behavior and New Product Development ... 18
Fabric Hand Evaluation ... 20
Subjective Fabric Hand Evaluation ... 24
Objective Fabric Hand Evaluation ... 39
CHAPTER III: METHODOLOGY ... 45
Subject Recruitment ... 46
Fabric Sample Preparation ... 46
Testing Procedure ... 48
CHAPTER IV: RESULTS ... 53
Sample ... 53
Part I: Rating Results ... 60
Attribute Ratings of Nonwoven Fabrics in Comparison to Woven Fabrics ... 61
Attribute Ratings among Nonwoven Fabrics ... 66
Attribute Ratings among Woven Fabrics ... 68
Influence of Gender on Fabric Ratings ... 70
Influence of Age on Fabric Ratings ... 74
Relationship between Comfort and the Attribute Ratings... 78
Relationship between the Attribute Ratings ... 79
Part II: Ranking Results ... 82
Fabric Rankings of Nonwoven Fabrics in Comparison to Woven Fabrics ... 82
Fabric Rankings among Nonwoven Fabrics ... 86
Fabric Rankings among Woven Fabrics ... 87
Influence of Gender on Fabric Rankings ... 89
Influence of Age on Fabric Rankings... 92
vii
Relationship between Attribute Ratings and Fabric Rankings ... 99
Summary of Results ... 105
Part I: Rating Summary Results ... 105
Part II: Ranking Summary Results ... 112
CHAPTER V: SUMMARY, CONCLUSIONS, & FUTURE RESEARCH ... 120
Summary ... 120
Summary of Results ... 123
Conclusion ... 128
Part I: Rating ... 128
Part II: Ranking ... 136
Future Research ... 144
REFERENCES ... 147
APPENDIX A ... 156
Pretest ... 156
Pretest Methodology ... 156
Subject Recruitment ... 156
Sample Preparation ... 156
Development of Testing Procedure ... 158
APPENDIX B ... 164
Pretest Results ... 164
Pretest Subjects ... 164
Pretest Part I: Rating Results ... 165
Pretest Part II: Ranking Results ... 175
Proposed Changes in Testing Procedure ... 181
Attribute Reduction ... 181
Textured Fabric Addition ... 182
Other Changes Based on Pre-Test Findings ... 187
APPENDIX C ... 189
Pretest Questionnaire ... 189
Part I: Rating - Pretest Proctor’s Guide ... 190
Part I: Rating - Pretest Survey ... 191
Part II: Ranking - Pretest Proctor’s Guide ... 198
APPENDIX D ... 199
Questionnaire ... 199
Part I: Rating - Proctor’s Guide ... 200
Part I: Rating – Survey ... 201
Part II: Ranking – Proctor’s Guide & Ranking Form ... 207
APPENDIX E ... 208
Testing Date, Time, & Location ... 208
viii
Weather During Testing Dates ... 209
Weather Key ... 209
February 2009 ... 210
March 2009 ... 211
APPENDIX G ... 212
Quantiles: Rating ... 212
All Subjects... 212
By Gender ... 213
Quantiles: Ranking ... 216
All Subjects... 216
By Gender ... 217
Fabric Rankings between Products ... 219
APPENDIX H ... 222
Box Plots: Rating ... 222
Woven v. Nonwoven ... 222
Nonwoven v. Nonwoven ... 231
Woven v. Woven ... 234
Influence of Gender on Attribute Ratings ... 237
Box Plots: Ranking ... 243
Woven v. Nonwoven ... 243
Nonwoven v. Nonwoven ... 252
Woven v. Woven ... 255
Influence of Gender on Fabric Rankings ... 258
Fabric Rankings between Products ... 262
APPENDIX I ... 268
IRB Approval ... 268
ix
LIST OF TABLES
Table 1. Comprehensive Consumer Decision-Making Process Models ... 10
Table 2. Seven Stages of CDP: Components and Company Uses ... 13
Table 3. Universal Evaluative Criteria ... 20
Table 4. ASTM D-123 List of Terms Relating to the Hand of Fabrics ... 22
Table 5. Protocols of the Handfeel Spectrum Descriptive Analysis Method ... 31
Table 6. Guidelines recommended by AATCC Evaluation Procedure 5 ... 32
Table 7. Accepted Terminology in Fabric Hand Evaluation ... 35
Table 8. Test Methods Used to Objectively Measure Fabric Hand ... 40
Table 9. Instruments and Measurements of the Kawabata Evaluation System for Fabrics ... 42
Table 10. Instruments and Measurements of SiroFAST ... 43
Table 11. Fabric Samples ... 47
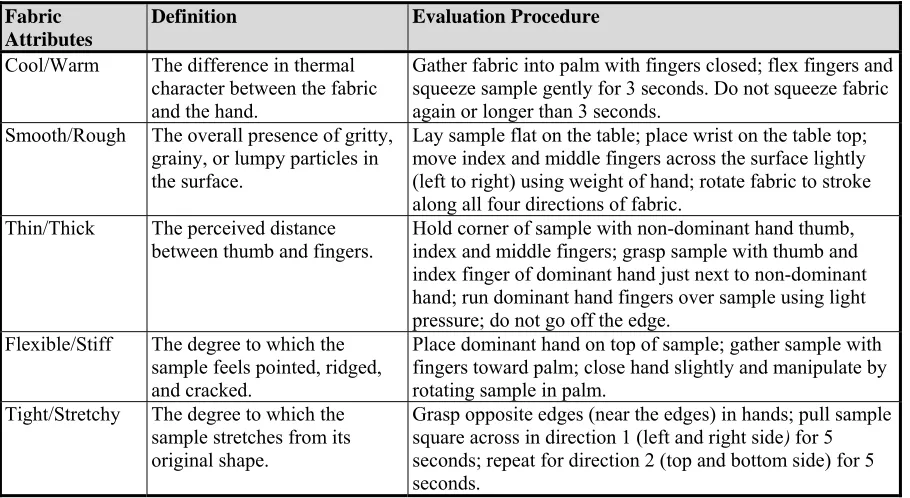
Table 12. Fabric Attribute Definitions and Evaluation Procedures ... 51
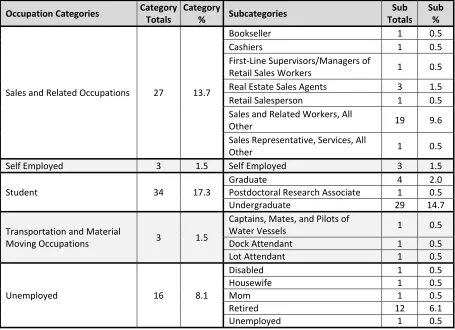
Table 13. Occupation of the Subjects ... 55
Table 14. Residency of the Subjects ... 59
Table 15. Median Attribute Ratings for all Subjects ... 65
Table 16. Wilcoxon Signed Rank Test: Comparison of Median Ratings between Woven and Nonwoven Fabrics for all Subjects ... 65
Table 17. Wilcoxon Signed Rank Test: Comparison of Median Ratings among Nonwoven Fabrics for all Subjects ... 68
Table 18. Wilcoxon Signed Rank Test: Comparison of Median Ratings among Woven Fabrics for all Subjects ... 70
Table 19. Median Attribute Ratings by Gender ... 73
x
Table 21. Spearman’s Correlation Coefficient: Relationship between Age and Fabric Ratings
... 77
Table 22. Spearman’s Correlation Coefficient: Relationship between Comfort and Fabric Attributes ... 81
Table 23. Median Fabric Rankings for all Subjects ... 85
Table 24. Wilcoxon Signed Rank Test: Comparison of Median Rankings between Woven and Nonwoven Fabrics for all Subjects ... 85
Table 25. Wilcoxon Signed Rank Test: Comparison of Median Ratings among Nonwoven Fabrics for all Subjects ... 87
Table 26. Wilcoxon Signed Rank Test: Comparison of Median Rankings among Woven Fabrics for all Subjects ... 89
Table 27. Median Fabric Rankings by Gender ... 91
Table 28. Wilcoxon Rank-Sum Test: Comparison of Median Rankings between Genders .... 91
Table 29. Spearman’s Correlation Coefficient: Relationship between Age and Fabric Rankings ... 94
Table 30. Wilcoxon Signed Rank Test: Comparison of Median Rankings by Products for all Subjects ... 98
Table 31. Spearman’s Correlation Coefficient: Relationship between Attribute Ratings and Fabric Rankings ... 104
Table 32. Difference between Fabric Ratings for Comfort ... 106
Table 33. Difference between Fabric Ratings for Cool/Warm ... 107
Table 34. Difference between Fabric Ratings for Smooth/Rough ... 107
Table 35. Difference between Fabric Ratings for Thin/Thick ... 108
Table 36. Difference between Fabric Ratings for Flexible/Stiff ... 109
Table 37. Difference between Fabric Ratings for Tight/Stretchy ... 110
Table 38. Difference between Fabric Rankings for a Long Sleeve Shirt ... 113
xi
Table 40. Difference between Fabric Rankings for a pair of Shorts ... 115
Table 41. Difference between Fabric Rankings for a Bag ... 115
Table 42. Summary of Fabric Rankings between Products ... 118
Table 43. Comfort Fabric Ratings ... 128
Table 44. Cool/Warm Fabric Ratings ... 129
Table 45. Smooth/Rough Fabric Ratings ... 130
Table 46. Thin/Thick Fabric Ratings ... 131
Table 47. Flexible/Stiff Fabric Ratings ... 132
Table 48. Tight/Stretchy Fabric Ratings ... 133
Table 49. Long Sleeve Shirt Fabric Rankings ... 136
Table 50. Short Sleeve Shirt Fabric Rankings ... 138
Table 51. Short Fabric Rankings ... 138
Table 52. Tote Bag Fabric Rankings ... 139
Table 53. PretestFabric Samples ... 158
Table 54. Pretest Fabric Attribute Definitions and Evaluation Procedures ... 161
Table 55. Pretest Median Attribute Ratings ... 171
Table 56. Wilcoxon Rank-Sum Test: Comparison of Medians between Pretest Woven and Nonwoven Fabrics ... 172
Table 57. Wilcoxon Rank-Sum Test: Comparison of Medians among Pretest Nonwoven Fabrics and among Pretest Woven Fabrics ... 172
Table 58. PretestSpearman's Correlation Coefficient ... 174
Table 59. Available Fabrics for the Study ... 183
Table 60. Pretest with Texture Nonwoven Fabric ... 184
xii
xiii
LIST OF FIGURES
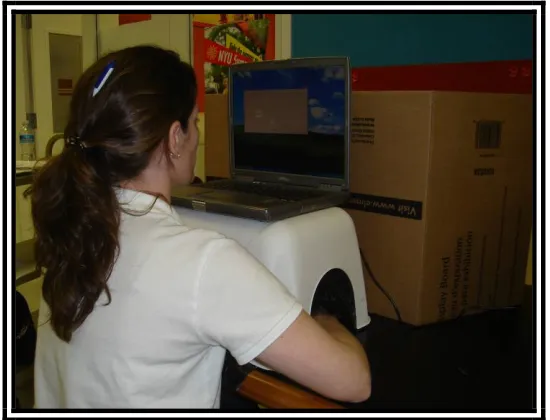
Figure 1. The experimental set-up for Part I: Rating. ... 49
Figure 2. The four images used in Part II: Ranking. ... 52
Figure 3. The experimental set-up for Part II: Ranking. ... 52
Figure 4. Age of the subjects. ... 53
Figure 5. Race of the subjects. ... 54
Figure 6. Household income level before taxes of the subjects. ... 55
Figure 7. Dollar amount subjects spend on clothing per year. ... 58
Figure 8. The experimental set-up for Pretest Part I: Rating. ... 159
Figure 9. The four images used in Pretest Part II: Ranking. ... 163
Figure 10. The experimental set-up for Pretest Part II: Ranking. ... 163
Figure 11. Pretest Tukey test results for the short sleeve button-down shirt. ... 176
Figure 12. Pretest Tukey test results for the long sleeve button-down shirt. ... 177
Figure 13. Pretest Tukey test results for the pleated shorts. ... 178
1
CHAPTER I: INTRODUCTION
The consumer decision-making process is, in part, driven by the attraction of the tactile properties – how good or comfortable a fabric feels. This process is perhaps more prominent for apparel product purchases than other textile products. Marketers are attuned to the consumer desire for “feel good” fabrics and have begun to use the comfort and touch sensations as a marketing strategy (Philippe et al., 2003). Cotton Incorporated, for example, has recently promoted the use of, or purchase of, cotton apparel by advertising the softness and comfort of the fabric’s feel through television and magazine media which can be seen on the company’s web page (Cotton Incorporated, 2008). A firm’s knowledge of consumer preference for fabric hand attributes is a valuable resource in the development and ultimately the success of the end product.
2
themselves to apparel applications. Though the understanding of consumer desires, this market could have the potential to expand.
Consumer testing can be used to determine consumer acceptance or preference of a product. Subjective evaluation of fabric hand is used to predict consumer acceptance of a textile product. Next to cost and appearance, hand is one of the first characteristics a consumer encounters. Instinctively, a consumer will use fabric hand to determine quality and suitability for end-use. Consumer opinion is a valuable resource for the design and development of fabrics. Understanding and incorporating consumer preferences can help designers tailor fabrics to meet these preferences and ultimately produce a successful product.
Purpose of this Study
The purpose of this study was to determine the consumer’s acceptance of nonwoven fabrics for apparel and accessory end-uses through the use of subjective fabric hand evaluation. A review of the literature guided the development of an appropriate subjective fabric hand evaluation method to study the average consumer’s acceptance of traditional woven fabrics versus spunlaced (spunbond and hydroentangled) nonwoven fabrics. The research questions included:
Research Question 1: How do nonwoven fabrics compare to woven fabrics?
3
1b. How do nonwoven fabrics rank in comparison to woven fabrics for general apparel and accessory products?
Research Question 2: How do nonwoven fabrics compare to one another?
2a. How do nonwoven fabrics rate among one another for comfort and each attribute? 2b. How do nonwoven fabrics rank among one another for general apparel and accessory
products?
Research Question 3: Does gender and age affect consumer acceptance of nonwoven fabrics?
3a. Does gender influence fabric rating and ranking responses? 3b. Does age influence fabric rating and ranking responses?
Significance of this Study
4
also be used to market nonwoven fabrics by understanding consumer interest in sensory attributes and advertising the product based on the desirable attributes.
Scope of this Study
This study focused on new generation nonwoven fabrics developed from the latest technologies; more specifically, spunlaid hydroentangled nonwoven fabrics. This technology creates a fabric suitable for apparel and accessory end-uses. However, even within the spunlaid hydroentangled category, numerous fabric designs are available, due to machine variables, fiber content, textures, and finishes. The scope of this study included three specific nonwoven fabrics: 1) a spunlaid islands-in-the-sea hydroentangled polyester/nylon blend nonwoven, 2) a spunlaid segmented pie hydroentangled polyester/nylon blend nonwoven, and 3) a textured spunbonded bicomponent hydroentangled elastomer/polyester blend nonwoven. In addition, six fabric attributes were included for the fabric evaluation. These were determined through a literature review to be most likely linked to determining consumer acceptance of fabrics. This study focused on male and female subjects, 18 and older, primarily from the central North Carolina region.
Limitations of this Study
5
CHAPTER II: LITERATURE REVIEW
Nonwovens and Apparel
While nonwovens have been used in the protective and medical clothing arenas, the market is reaching its saturation point. In North America, feminine care and baby care products each have a market penetration of approximately 90%, and medical fabrics are at approximately 80% penetration (Pourdeyhimi, 2004). Nonwoven products for apparel end-use, however, are only at approximately 10% market penetration, making the apparel market a viable area for expansion of nonwoven fabrics.
6
and windproof. However, what the industry needs is garment development so that the manufacturers can work on the comfort features of the fabrics (Walzer, 2001).
three-7
dimensional design using laserography technology which mimics denim and other twill fabrics (Maycumber, 2000).
In 2003, Australian Wool Innovation (AWI) and Macquarie Textiles began a project to develop nonwoven wool fabrics using the needlepunch process. The products are of interest for the defense and protective clothing arenas. To date, a nonwoven, wool-lined vest by Driza-Bone® (an Australian icon comparable to L.L. Bean) and a disposable blanket have been commercialized (Dockery, 2003). One nonwoven has proven successful in the apparel market; Ultrasuede® from Japan which was introduced to the market in the 1970s. The fabric, to this day, is still very expensive, which keeps the product in the high-end retail sector.
Nonwoven fabrics can be produced at higher speeds and greater widths in comparison to traditional woven and knit fabrics. Due to fabric characteristics, nonwoven fabrics do not fray, and therefore, require less sewing. The fabrics also do not have a grain which reduces fabric waste in the marker making and cutting process. Researchers and industry members feel the technology of nonwoven fabrics will soon be ready for apparel, but wonder if the consumers will be ready for nonwoven apparel.
Consumer Behavior
8
(Blackwell, Miniard & Engel, 2006; Robertson & Kassarjian, 1991). Consumer behavior is the study of how a consumer makes a decision and not just why a consumer makes a decision (Blackwell et. al., 2006). Research prior to the mid-1960s focused on the why, known as
buying behavior (Block & Roering, 1976; Erasmus et. al., 2001), but as consumer knowledge increased, researchers began to understand there was more to the decision than just the act of purchase. With the development of consumer decision models, research focused on the how
of consumer behavior, known as consumption behavior, which includes the process leading up to purchasing, purchasing, consuming, and disposing of a product or service (Ambaye, 2005; Block & Roering, 1976; Erasmus et. al., 2001; Walters & Paul, 1970). Consumer behavior knowledge is used by firms and marketers to increase profits, through use of consumer decision models, to better understand their target consumers. Knowledge gained from these consumer studies is used to influence target consumers through effective development of new or improved products and marketing mix strategies (Ambaye, 2005; Blackwell et. al., 2006; Howard, 1989; Howard & Sheth, 1969; Schiffman & Kanuk, 1978; Walters & Paul, 1970).
Comprehensive Consumer Decision-Making Process Models
9
guide, or framework, by students and researchers to study consumer behavior and assist firms and marketers in developing more effective strategies to persuade their target consumers (Blackwell et. al., 2006; Block & Roering, 1976; Engel & Blackwell, 1982; Erasmus et. al., 2001; Lewis & Littler, 1999; Walters & Paul, 1970). These models are not meant to be
interpreted as defining the “real world” (Ambaye, 2005; Engel & Blackwell, 1982; Walters & Paul, 1970). The following consumer decision-making process models have made significant contributions to the field: Nicosia (1966); Engel, Kollat, and Blackwell (1968); Howard and Sheth (1969); Schiffman and Kanuk (1978); and Blackwell, Miniard, and Engel (2006).
10
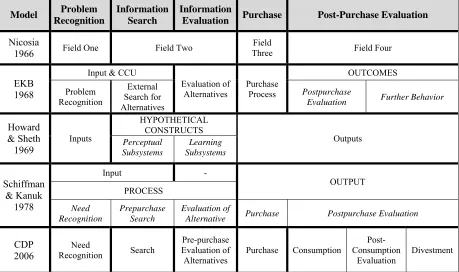
There have not been significant changes since the development of the original 1960s models. The change is seen in the knowledge gained on consumers through the use of these decision-making process models and by the way in which researchers and firms are collecting that knowledge. For example, the Internet has provided a new avenue in which to collect data, advertise, and sell.
Table 1. Comprehensive Consumer Decision-Making Process Models
Model Problem Recognition
Information Search
Information
Evaluation Purchase Post-Purchase Evaluation
Nicosia
1966 Field One Field Two
Field
Three Field Four
EKB 1968
Input & CCU
Evaluation of
Alternatives Purchase Process
OUTCOMES Problem Recognition External Search for Alternatives Postpurchase
Evaluation Further Behavior
Howard & Sheth 1969 Inputs HYPOTHETICAL CONSTRUCTS Outputs Perceptual Subsystems Learning Subsystems Schiffman & Kanuk 1978 Input - OUTPUT PROCESS Need Recognition Prepurchase Search Evaluation of
Alternative Purchase Postpurchase Evaluation
CDP 2006
Need
Recognition Search
Pre-purchase Evaluation of
Alternatives Purchase Consumption
Post-Consumption
Evaluation Divestment
11 Blackwell, Miniard, & Engel: 2006
The most recent and commonly used decision-making process model is the Blackwell, Miniard, and Engel’s Consumer Decision Process (CDP) model, which originated in 1968, by authors Engel, Kollat, and Blackwell. This model was a roadmap to understanding consumer behavior and consumer decisions. By the 1986, fifth edition of
Consumer Behavior, Kollet had departed the team and Miniard joined. These authors revised
the EKB model to the EBM model which consisted of seven decision-making stages still reflected in today’s model. The CDP model is general enough to be applied to many industries, to study the specific variables of the model, and to understand how those variables affect a specific industry, product, or consumer. Blackwell et. al. continued research on consumer behavior offers the most “state of the art” model to be used as a tool for gathering further knowledge to understand the future of the consumers’ decision process.
CDP Model Overview & Stages. The CDP is a seven stage decision-making model
12
and behavior change. There are three types of decision processes that can influence the CDP: initial purchases, repeat purchases, and impulse buying. Each of these processes involves different levels of time, search, and perceived risk. Other factors shown to affect the CDP are degree of involvement, perceptions of difference among alternatives, time availability, and the consumer’s mood state (Blackwell et. al., 2006). Table 2, developed by the author, with information gathered from the tenth edition of Consumer Behavior by Blackwell et. al.,
defines the seven stages of the CDP model, the components of each stage, and how companies can benefit from understanding each stage. The model can be viewed on page 85, in the tenth edition, of Consumer Behavior by Blackwell, Miniard, and Engel.
CDP Advantages & Disadvantages. The CDP model is the most “state of the art”
model due to the ongoing research by Blackwell et. al. and has benefited academia, market strategists, and firms. The model shows the consumers’ entire decision process activities including before, during, and after the purchase of a product (Blackwell et. al., 2006). However, the model is a general model, as are the others and meant to be used as a tool and not to define the “real world”.
Model Uses. Firms and researchers can use the CDP model to identify relationships
13
focusing on the first three stages of the CDP model and manufactures are assisting with in-store sales by training salespeople, and providing signage and fixtures. If the seven stages are understood, marketers will have a better understanding as to why consumers are buying, or not buying, products and how to get them to purchase, or continue to purchase, their products (Blackwell et. at., 2006).
Table 2. Seven Stages of CDP: Components and Company Uses
Stage Definition Components Company Uses
Need
Recognition •Recognition occurs when the consumer perceives the ideal, or desired, state is different from the actual state.
•Also known as problem
recognition.
A firm activates a need by: •Change consumer’s desired state
•Change how consumers perceives
their actual state
•Remind consumers of a need Demands stimulated by firms activating needs:
•Primary demand •Selective demand
Use of advertising to: •Change desired state
•Change perception of actual state •Remind consumers of product
benefits
Design or develop products to remind consumers of a need. Changes in consumer trends can
identify changes in needs
Æcreates opportunity for new products.
Search •Consumers search to find a
solution to satisfy their need or problem.
•Occurs once a need or problem is perceived.
•Consumers develop the external search set and evaluative criteria.
Reasons consumers may not act on a need:
•Feel they do not need to act •May not have the means to act Time spent on search:
•Seconds to months
•Depends on multiple variables •Perceived risk
Types of search: •Internal search •External search
Provide stimuli and information through:
•Advertisements & promotions •Salespeople
•Point-of-Sales (in-store) media •Internet
Firms use brand equity and brand image to get their message to the consumer and have the consumer retain the message.
Pre-Purchase Evaluation of Alternatives
•The consumer begins to evaluate all the alternative options they discovered during search. •Search and pre-purchase intermix. •Consumers develop an evoked set and evaluative criteria to choose among the evoked set.
•Consumers may use cognitive or emotional assessment during the evaluation process.
Ways to build criteria:
•Pre-existing criteria from memory •New criteria gained from search
Types of evaluation techniques: •Categorization or piecemeal
•Compensatory or
noncompensatory
Alternatives evaluated by two attributes:
•Salient •Determinant
Be a part of the evoked set. •Shows brand loyalty •Identifies competitors
14
Table 2. Seven Stages of CDP: Components and Company Uses (cont.)
Stage Definition Components Company Uses
Purchase •The decision or act to purchase.
•Based on pre-purchase evaluation.
Purchasing phases:
•Choice of retailer or retail outlet •Accept or not accept influences by
in-store choices
Companies micromanage all details of the consumers’ shopping experience through in-store choices:
•Salespeople •Promotions •Signage •Displays
Consumption •Occurs when the consumer has
made the purchase and takes possession of the product/service AND the product is used.
Consumption can be: •Immediate •Delayed
Understanding consumption can create opportunities for:
•Product improvements
•Packaging improvements
•New product development
Post-Consumption Evaluation
•The stage where the consumer experiences satisfaction or dissatisfaction.
•Evaluation is stored in memory for future purchases.
•The consumer may also
experience post-purchase regret, or cognitive dissonance.
•Consumer refers back to pre-purchase evaluation stage and uses evaluative criteria to assess satisfaction or dissatisfaction.
•Consumer may experience
post-purchase regret.
•Evaluation criteria used in brand extensions: satisfaction extends to perceived satisfaction of the brand in other categories
•Satisfied consumer: created brand loyalty and difficult for competitor to move in
•Dissatisfied consumer: competitors present consumer with a product that promises something better
•Post-purchase regret: companies acknowledge regret by providing hang tags, toll free numbers, and follow up sales calls to confirm consumers’ decision
Divestment •How the consumer disposes of the
product.
Disposes through: •Disposal •Recycling •Remarketing
Disposal & Recycling: play to consumers’ environmental concerns Remarketing: eBay
Note. Information adapted into table from Consumer Behavior by R. D. Blackwell, P. W. Miniard, and J. F. Engel, 2006, 10th ed., Mason, OH: Thomson South-Western.
Use of the CDP Model in Apparel
15
(1978) conducted exploratory research, using a former version of the CDP, to identify key variables female consumers used when making apparel purchase decisions. They specifically looked at the pre-purchase and purchase stages. The study led to further questions that authors felt should be looked at quantitatively. Hart and Dewsnap (2000) used the model as a framework to better understand a females’ decision process when considering the high involvement decision process of a bra purchase. The study looked at all stages of the model and found that situational factors spark a need which leads to a critical and extensive search due to the high involvement of the decision. Consumers in this study evaluated a set of bras for comfort and fit and evaluated product attributes specific to a bra. Chae et. al. (2006) studied female tennis clothing and found that while it was not an overall high involvement decision-making process, woman who saw themselves as fashionable created a high involvement decision-making process.
16
Burns (2002) found that the international group they studied, evaluated clothing differently suggesting that firms and researchers should be aware that some cultures still have strong influence regarding apparel decisions. Hsu and Burns also suggested that the evaluation criteria for clothing be added to the consumer decision model. A similar type change can be seen in the modified CDP model used in May-Plumlee and Little’s (2006) research. Forney et. al. (2005) worked to identify which of the apparel evaluative criteria were used when making a decision on home furnishing and how the use of these similar criteria could predict purchase behavior of brand extension products. The study found that brand image was the most influential apparel criteria consumers used when considering the purchase of an apparel brand in the home furnishing category.
Influence of the Internet
17
Scheepers (2001) conducted a case study on a small Australian boot company and determined that selling sensory products online is feasible but challenging. Consumers are wary of such products because they cannot judge fit, comfort, or fabric hand over the Internet, which is an important criteria when purchasing products that are worn. By providing consumers sensory attribute information, consumers feel more comfortable shopping online for sensory products. Scheepers states ways for companies to succeed by using each stage (except divestment) of the CDP model. Research by Ambaye (2005) also looked at the purchase of sensory sales via the Internet. An earlier version of the CDP model was the framework for her eCDP (Electronic Consumer Decision Process Model). Ambaye concentrated on the first four stages of the CDP model, need recognition, search, pre-purchase evaluative criteria, and pre-purchase, where she felt Internet shopping created a different consumer decision process than that of traditional retail outlets. Research by Shin (2007) studied external search because the Internet has provided a strong external search tool through chats, blogs, company websites, and consumer reviews. Communication methods are convenient and fast, yet, provide confidentiality unlike face-to-face information gathering. The Internet also provides a convenient way to shop with 24 hour access and a wide selection of products and retailers. However, the Internet also has its limitations, such as perceived risks. Companies have tried to limit these risks by offering consumer reviews. Teo and Yeong (2003) found similar results to Shin.
Future of Consumer Decision-Making Models in Apparel
18
therefore, their wants, needs, and criteria constantly change (Blackwell et. al., 2006). Therefore, consumer behavior, specifically the consumers’ decision process, remains important to companies. For companies to remain profitable, they must continue to research and understand their target customer. Through the use of consumer decision process models, marketers can gain a better understanding of their target consumer. Apparel companies, like Jockey International and VF Corporation, have developed departments such as “consumerology” and “consumer insight” with the sole purpose of collecting and analyzing data on their target consumers. The Internet has become a valuable research tool for companies. For example, VF Corporation conducts surveys online to research a mass number of consumers and gather a large amount of information quickly, which is important and valuable in today’s fast paced market. The company also stages mock online shopping experiences to see what their target consumers will purchase from the product lines of future seasons. This data is then used to determine the SKUs and floor plans for the future seasons (Norgren, 2008). Studying the consumer’s behavior will be important to the future success of apparel firms.
Consumer Behavior and New Product Development
19
Development Integrating Consumer Requirements (PPDICR). The model was developed to assist companies in developing successful apparel products by considering consumer input during the product development process.
20 Table 3. Universal Evaluative Criteria
Extrinsic Intrinsic
Brand
Price Color/pattern Style/design/uniqueness
Fabrication Fashionability
Appearance/attractiveness
Care Construction Durability Fit/sizing Quality Comfort
Note. Adopted from “Proactive product development integrating consumer requirements,” by T. May-Plumlee and T. Little, 2006, in The International Journal of Clothing Science and Technology, 18(1), 53-66.
Fabric Hand Evaluation
As seen in Behery (2005), the definition of fabric hand has been defined various ways by numerous researchers and the definitions tend to change based on the researchers’ interests. Fabric hand is defined in the 2006 edition of the AATCC Technical Manual as “the tactile sensations or impressions which arise when fabrics are touched, squeezed, rubbed or otherwise handled” (p. 384). Often fabric hand, handle, or feel is used interchangeably but El Mogahzy et al. (2005, p. 45) explains there is a difference between ‘fabric hand’ and ‘fabric handle.’
Fabric Hand: “describes the way a fabric feels when it is touched and manipulated by hand. It is an action noun that implies evaluation of fabric reaction to different modes of low-stress deformation imposed by the human hand.”
21
Fabric hand is considered a phenomenon because of its complex notion involving the interrelations of a fabric’s physical properties and the psychology of the human’s response. Elements that relate to the fabric hand are fiber structure and characteristics; yarn type; fabric structure; and finishing processes (Behery, 2005; Lundgren, 1969; Vaughn & Kim, 1975). However, the complexity of the human’s response to tactile and kinesthetic (muscular) sensations of the fabric produces a greater challenge. From the industry expert to the end consumer, the assessment of fabric hand has been done for decades to determine and communicate fabric quality and characteristics (Kawabata et al., 1994; Mahar & Postle, 1989).
22
experts are highly trained to feel the slightest change in hand from fabric to fabric, the consumers are the ultimate decision makers who will determine product success or failure through their acceptance, and in turn purchase, or rejection, of the product comprised of that fabric. Attempting to understand the various differences and ever changing preferences of a consumer produces a challenge to firms (Behery, 2005; Stearn et al., 1988; Vaughn & Kim, 1975).
Table 4. ASTM D-123 List of Terms Relating to the Hand of Fabrics
Physical Property Explanatory Phrase
Terms to be Used in Describing Range of Corresponding
Component of Hand
Flexibility Ease of bending Pliable (high) to stiff (low)
Compressibility Ease of squeezing Soft (high) to hard (low)
Extensibility Ease of stretching Stretchy (high) to nonstretchy (low)
Resilience Ability to recover from deformation Springy (high) to limp (low).
Resilience may be flexural, compressional, extensional, or torsional.
Density Mass per unit volume (based on measurement
of thickness and fabric weight) Compact (high) to open (low)
Surface contour Divergence of the surface from planeness Rough (high) to smooth (low) Surface friction Resistance to slipping offered by the surface Harsh (high) to slippery (low) Thermal character Apparent difference in temperature of the
fabric and the skin of the observer touching it Cool (high) to warm (low)
Note. From Standard Terminology Relating to Textiles (p. 69), by American Society for Testing Materials, 2007, West Conshohocken, PA: Author.
23
al., 1998; Civille & Dus, 1990; Dawes & Owen, 1971a; Dreby, 1942; Kim, Yoo, & Kim, 2005; Paek, 1979; Vaughn & Kim, 1975; Wallenberger, 1982). Fabric hand is also related to comfort, style, and appearance of a fabric or garment. Therefore, it is essential for designers and manufacturers to consider the hand of a fabric for an apparel end-use if they intend to have a marketable product (Ellis & Garnsworthy, 1980; Merkel, 1991; Shenai, 1989; Zeng & Koehl, 2003).
24
Fabric Assurance by Simple Testing (FAST), and the PhabrOmeter. A detailed review of significant contribution to the evaluation of fabric hand can be found in Bishop (1996), Ellis & Garnsworthy (1980), and Vaughn and Kim (1975).
Subjective Fabric Hand Evaluation
Consumer acceptance is important to the success of a product. There are several ways in which to assess consumer acceptance. From the blatant question of whether they like or dislike a product, subjective and objective measurements, or point-of-sales data. The subjective tactile assessment of fabric hand is a common way in which to assess consumer acceptance of a textile product and the consumer’s acceptance or rejection of a product is based on consumer behavior.
25
subjective evaluation is a valuable tool for textile firms. Testing fabrics can determine if consumers will perceive the end product as acceptable. While some may be concerned with differences among evaluators, one must remember that in most circumstances, a firm’s target market is comprised of consumers with different backgrounds, and therefore, different preferences (Ellis & Garnsworthy, 1980).
Measurement of Subjective Fabric Hand Evaluation
While instruments and standardized methods can test the physical and mechanical properties of fabric, no instrument is as sensitive as the human hand, nor can these instruments emulate the psychological aspect of a human (El Mogahzý et al., 2005; Ellis & Garnsworthy, 1980). Subjective assessment through tactile evaluation, even to those who are not experienced in fabric hand evaluation, can provide information regarding the fabric that no instrument or set of instruments can produce (El Mogahzý et al., 2005). These instruments are not capable of understanding human perception, or the way in which the mind transforms, organizes, and structures sensory information. Only humans can understand perception, and therefore, subjective evaluation remains important to the assessment of fabrics and textile products (Hyun et al., 1991).
26
can reveal helpful information, but there is concern regarding the unreliability and reproducibility of the data (El Mogahzy et al., 2005).
Through subjective fabric hand evaluation, an evaluator can either quantify their perception of a fabric property (e.g., softness, stiffness, thickness) or express their preference for the fabric. These two general evaluations are known as sensory analysis, or hedonic analysis, respectively. Sensory analysis is a psychophysical measurement that describes part of the fabric hand using scales such as high-low (e.g., hot-cold). Judges are typically a trained panel and the knowledge of the end-use application is not relevant. The results are not affected by individual background and considered more consistent. Hedonic analysis is a psychological measurement describing fabric hand as a whole. These preferences are measured on a good-bad or like-don’t like scale. Judges are consumers and the end-use application is taken into account. These results are therefore affected by the individual’s background (Bishop, 1996; Brand, 1964; Philippe, Schacher, Adolphe, & Dacremont, 2003; Zeng & Koehl, 2003). With sensory analysis, and the development of a psychophysical method, there are two fundamental perceptions of sensation when a fabric is in contact with the skin, descriptive, and intensive. The descriptive dimension is the perception of a specific sensory attribute (e.g., softness, stiffness, roughness) where as, the intensive dimension is a perceived magnitude of sensation (e.g., very soft, very stiff, etc.) (Cardello, Witherhalter, & Schutz, 2003; Szczesniak et al. 1975).
27
poor, 1 = sufficient, 5 = very good, 6 = excellent). The comparative method, also known as ranking, is to order the fabrics based on subjective criteria (e.g., best to worse), but not to assess the magnitude of the difference. This method is more acceptable and more meaningful statistical analysis can be applied. The most common comparative methods are paired comparisons and simple ranking. Paired comparison is when the evaluator is presented with all possible fabric pairs. Each pair is presented one at a time and in random order. The evaluator is asked to choose the superior fabric based on a specific attribute. The number of times the fabric is chosen as superior is the fabric’s total score. The fabrics are then ranked based on the total score. When simple ranking is used, all fabrics are presented to the evaluator at one time and they are asked to rank the fabrics based on a subjective attribute. This method is preferred when the total number of fabrics is six or less (Ellis & Garnsworthy, 1980; Militký, 2005).
Related Literature on Subjective Fabric Hand Evaluation
28
Binns (1926) is considered the first to publish work regarding subjective fabric hand evaluation. Interested in the psychological aspect of wool trade, Binns conducted a study in which technical persons of the wool industry, non-technical persons of the apparel industry, and consumers were asked to rank wool fabrics. Binns found there to be a “striking uniformity” between the mean rankings of three subject groups. He continued research on experienced and non-experienced judges’ ability to assess fabrics (Binns, 1934). Overall, the correlation among groups was high showing one’s ability to tactually assess fabrics was innate. However, he stated to buy and sell textiles, which requires a more sensitive and keen sense of touch, one would need to be trained. The study also showed a group of judges provided a more reliable and sensitive evaluation than one single judge (Bishop, 1996; Ellis & Garnsworthy, 1980; Mahar & Postle, 1989).
29
are commonly accepted in fabric hand evaluation (Barker & Scheininger, 1982, Laing & Ingham, 1983; Lundgren, 1969; Paek, 1975, 1978, 1979; Sülar & Okur, 2007; Winakor, Kim, & Wolins, 1980).
Brand (1964) introduced the idea of using polar-pair word scales to judge fabric qualities. Polar-pair words should be commonly understood (not technical or textile jargon) and have opposites (e.g., smooth-rough). He used component analysis to identify which polar-pair words would describe a fabric concept, such as surface texture. The polar-pair words can convey primary hand expressions, or terms identifying the most important qualities of fabric hand (Ellis & Garnsworthy, 1980). The polar-pair words also helped identify objective measures that could be used to evaluate the fabric hand.
30
31
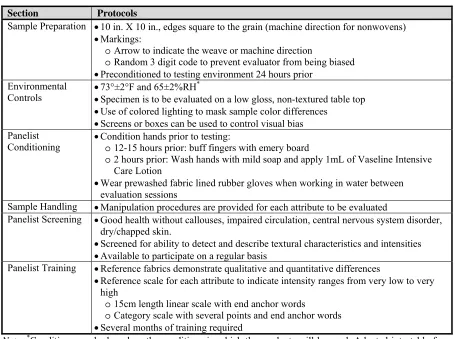
Table 5. Protocols of the Handfeel Spectrum Descriptive Analysis Method
Section Protocols
Sample Preparation •10 in. X 10 in., edges square to the grain (machine direction for nonwovens)
•Markings:
o Arrow to indicate the weave or machine direction
o Random 3 digit code to prevent evaluator from being biased
•Preconditioned to testing environment 24 hours prior Environmental
Controls •73°±2°F and 65±2%RH
*
•Specimen is to be evaluated on a low gloss, non-textured table top
•Use of colored lighting to mask sample color differences
•Screens or boxes can be used to control visual bias Panelist
Conditioning •Condition hands prior to testing: o 12-15 hours prior: buff fingers with emery board
o 2 hours prior: Wash hands with mild soap and apply 1mL of Vaseline Intensive Care Lotion
•Wear prewashed fabric lined rubber gloves when working in water between evaluation sessions
Sample Handling •Manipulation procedures are provided for each attribute to be evaluated
Panelist Screening •Good health without callouses, impaired circulation, central nervous system disorder, dry/chapped skin.
•Screened for ability to detect and describe textural characteristics and intensities
•Available to participate on a regular basis
Panelist Training •Reference fabrics demonstrate qualitative and quantitative differences
•Reference scale for each attribute to indicate intensity ranges from very low to very high
o 15cm length linear scale with end anchor words
o Category scale with several points and end anchor words
•Several months of training required
Note. *Conditions can be based on the conditions in which the products will be used. Adapted into table from “Development of terminology to describe the handfeel properties of paper and fabrics,” by G. V. Civille and C. A. Dus, 1990, Journal of Sensory Studies, 5, p. 23.
32
color) of the fabric can bias the evaluator’s tactile assessment. Terms, which can be used for the evaluation procedure, are provided and categorized by physical attribute.
Table 6. Guidelines recommended by AATCC Evaluation Procedure 5
Section Guidelines
Specimens •200 mm (8 in.) – 900 mm (35.4 in.)
•Avoid using the specimen more than once
•Markings made with pen or pencil o Length directions
o Specimen id
o Surface to be evaluated
•Condition 4 hours at 21°±1°C and 65±2% RH (report other conditions) Evaluator Preparation •Wash hands 0.5 hours prior to evaluation
•Use same soap which does not contain moisturizers
•Use same towel to dry hands
•Avoid activities that would cause hands to perspire
•Avoid temperature changes
•Avoid moisture
Procedure •Facilitator is to provide the following instructions to evaluator: o Elements of hand to be evaluated
o Rating scale to use
o Number of specimens to evaluate o Order of presentation
o Duration of evaluation session
•Blind or non-blind procedure (blind is preferred) o Use of a screen or drape
o Closing the eyes o Using a blindfold
•Specimen is to be evaluated on a smooth, nonmetallic surface
•Specimen should be place with evaluation side up and aligned as indicated by markings
•If thermal attribute is evaluated, it must be done so first
•Descriptions on how to evaluate the fabric are provided
Evaluation •Evaluated by pairs or sets
•Evaluated for the direction or magnitude difference
•Evaluated against a reference, ranked between two extremes, or ranked by comparative assessments
33
Development of Subjective Fabric Hand Evaluation Methodologies
The assessment of fabric is influenced by the products, evaluators, and end-uses (Ellis & Garnsworthy, 1980). When developing a subjective fabric hand evaluation methodology, it is helpful to consider the following six key elements proposed by Bishop (1996, p. 8):
1. Judges particularly their expertise/naïveté
2. Criteria of judgment the choice of descriptors for fabric attributes 3. Assessment conditions seen or unseen; controlled temperature and
relative humidity
4. Assessment technique free or specified fabric-manipulation technique for assessment of given attributes
5. Method of ranking or scaling the assessments
rank order, graded standards, magnitude estimation
6. Analysis of results relative importance of individual descriptors for end-use, correlation between descriptors, redundancy, fabric-specification profiles, vector maps, sensory space.
When developing the psychological scales for a subjective fabric hand study, the following six elements proposed by Hollies (1977, p. 108) should be considered:
1. Must be a commonly recognized attribute or group of attributes to measure 2. Language of terms to describe the attribute must exist
3. Needs to be a scale assignment of two or more steps to represent the attribute level and its anticipated changes
4. For a quantitative measure of the attribute, it is common to choose a rating panel and let them apply the rating scale to attribute measurement
5. Data handling appropriate to the type of rating being made needs to be recognized and used
34
Both of these sets of elements have been taken into consideration in the development of the methodology for this research. The following discusses the six key elements proposed by Bishop in more detail.
Judges. One cannot judge a fabric based on a single judge’s assessment, whether an
35
Fabric attributes: acceptable terminology and definitions. As stated previously, there
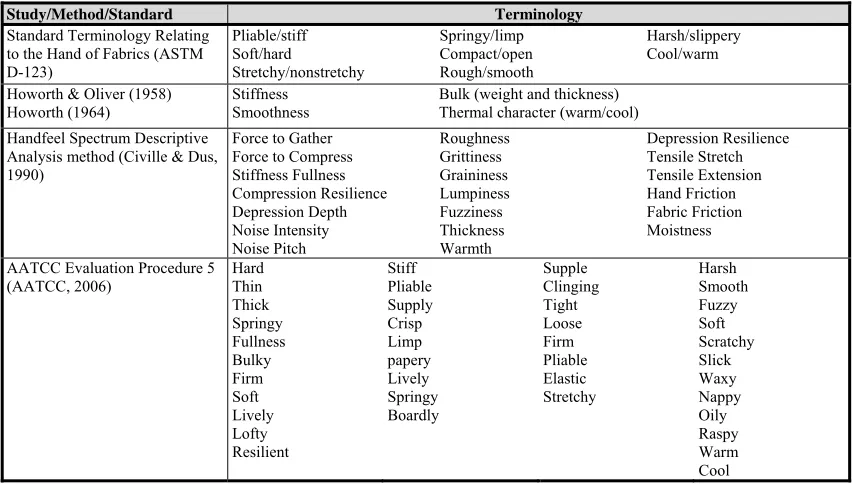
is a vast amount of terminology to describe fabric hand and no standard set of terms has been agreed upon. However, there are several studies which provide terminology that have been proven useful in describing fabric hand (see Table 7). Brand (1964) suggested that bipolar adjectives would better express fabric hand attributes than singular descriptors. ASTM D-123 and the HSDA method both provide a list of bipolar adjectives. Grinevičiūtė & Gutauskas (2004) found that the use of fewer terms increased the subjective assessment of fabric hand. Furthermore, use of all the terms listed by the HSDA method and the AATCC Evaluation Procedure 5 could be overwhelming, especially to an untrained, consumer group. However, these methods provide a bank from which to choose acceptable terms for subjective evaluation of fabric hand.
Table 7. Accepted Terminology in Fabric Hand Evaluation
Study/Method/Standard Terminology
Standard Terminology Relating to the Hand of Fabrics (ASTM D-123) Pliable/stiff Soft/hard Stretchy/nonstretchy Springy/limp Compact/open Rough/smooth Harsh/slippery Cool/warm
Howorth & Oliver (1958)
Howorth (1964) Stiffness Smoothness Bulk (weight and thickness) Thermal character (warm/cool) Handfeel Spectrum Descriptive
Analysis method (Civille & Dus, 1990)
Force to Gather Force to Compress Stiffness Fullness Compression Resilience Depression Depth Noise Intensity Noise Pitch Roughness Grittiness Graininess Lumpiness Fuzziness Thickness Warmth Depression Resilience Tensile Stretch Tensile Extension Hand Friction Fabric Friction Moistness
36
37
Assessment conditions. Subjective evaluation of fabric hand should be made without
the significant bias of fabric appearance (Lundgren, 1969). Visual aesthetics such as color, texture, and pattern can influence an individual’s final decision during subjective assessment (Militký, 2005). For example, a velvet fabric may suggest softness or tweed may present a pleasant appearance but an unpleasant, harsh hand (Brand, 1964; Workman & Caldwell, 2007). Since visual aesthetics have such an influence on the like/dislike of a fabric, there is a need to separate the bias of visual aesthetics by conducting a blind study so the judge can focus on the physical fabric characteristics attributing to fabric hand (Griffin & O’Neal, 1992). Furthermore, human sense of touch can better discriminate and recognize complex patterns over the visual system (El Mogahzy et al., 2005).
Environmental variables, including temperature and relative humidity, are not commonly reference in the literature. Controlled environments are typically not found with untrained or consumer studies (Bogaty et al., 1956; Byrne et al., 1998; Kim & Piromthamsiri, 1984; Laing & Ingham, 1983; Morris & Prato, 1981; Morris, Prato, & White, 1984; Paek, 1975; Winakor et al., 1980). While it is not noted as to why an uncontrolled environment was used, possible reasons could be lack of access to a controlled environment, or that consumers do not shop for or wear everyday apparel in controlled environments. Typically, when subjective results are being compared to objective results, subjective testing is conducted under the condition in which the objective testing will take place (Bishop, 1996).
Assessment technique. A specified manipulation of fabrics is helpful with an
38
assessment technique to ensure all judges are manipulating the fabric in the same manner. The HSDA method has developed a standard method for manipulation of sensory attributes that describe fabric hand (Civille & Dus, 1990).
Method of ranking or scaling the assessment. There are four general categories of
scales – nominal, ordinal, interval, and ratio scales. The ordinal, interval, and ratio scales are typically used for sensory evaluation. Ordinal scales are used for ranking or ordering where there is no magnitude, or judgment of distance, between categories (Stone & Sidel, 1993). As previous discussed, ranking is comprised of paired comparison and simple ranking. However, ranking provides limited information and therefore rating scales are commonly used. The most common rating scale is a category scale; they are easily prepared and highly reliable. The scale typically contains verbal and/or numerical labels at each point along the scale. These scales can range from five to 99-points. However, a 99-point scale is more desirable for expert judges. A seven or nine point scale, with bipolar or single descriptor words, is used most often. The simplicity of the scale makes it easy understood by untrained, consumer subjects (Bishop, 1996; Cardello et al., 2003; Militký, 2005; Stone & Sidel, 1993). Finally, there are a variety of magnitude-estimation techniques which use interval or ratio scales. Unlike an ordinal scale, the distance between points on the scale has meaning and is not arbitrary. These scales required training of judges, or the use of experienced judges. See Bishop (1996) and Stone and Sidel (1993) for more detail of these type scales.
Analysis. Depending on the use of the scale, the statistics used to analyze the data will
39
standard deviation (Behery, 2005; Stone & Sidel, 1993). These statistics are used to answer specific research questions and basic subjective evaluation analysis such as level of agreement between judges (Bishop, 1996).
Objective Fabric Hand Evaluation
The purpose of fabric objective measurement (FOM) is to identify and measure fabric properties associated with the perception of fabric quality for specific end-uses (Bishop, 1996). Objective measurement of fabric hand can provide precise quantitative data. Several researchers have made significant contributions by working to identify and define physical properties that correspond to the subjective assessment and could be measured objectively (Cardello et al., 2003; Dawes & Owen, 1971a, b; Howorth, 1964; Howorth & Oliver, 1958; Kim & Vaughn, 1979; Lundgren, 1969; Matsuo et al., 1971). These measurements have helped to define fabric hand and guide designers and manufactures in the development of new fabrics, but a direct relationship to the prediction of subjective evaluation has not been found. As discussed in the previous section on subjective evaluation, the complexity of the human sensory system and psychology present a challenge. Bishop states that while Japan has developed and accepted FOM, others around the world are still questioning the relationship of the data to subjective assessment. This has undoubtedly caused the overwhelming amount of research on the relationship of objective and subjective evaluation of fabric hand.
40
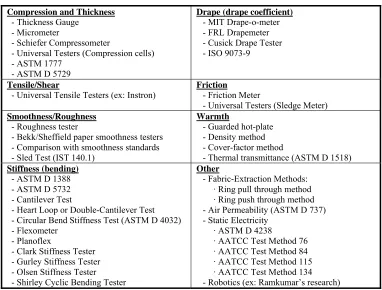
developing physical tests that could assign a numeric value to these sensations. In this work, he focused on stiffness and developed tests to measure this sensation. Mainly, he introduced the use of a cantilever to measure the bending length of fabric. With this measurement and the fabric weight, flexural rigidity, or stiffness, can be determined. Since fabric hand is more complex than just stiffness alone, researchers continued to define and develop tests to quantify fabric hand (De Boos, 2005). Peirce’s work was a foundation for simple measurements of fabric hand that are still used today (Barker, 2002). Examples of these methods, and other methods mentioned in the literature are list in Table 8.
Table 8. Test Methods Used to Objectively Measure Fabric Hand
Compression and Thickness - Thickness Gauge
- Micrometer
- Schiefer Compressometer
- Universal Testers (Compression cells) - ASTM 1777
- ASTM D 5729
Drape (drape coefficient) - MIT Drape-o-meter - FRL Drapemeter - Cusick Drape Tester - ISO 9073-9
Tensile/Shear
- Universal Tensile Testers (ex: Instron) Friction - Friction Meter
- Universal Testers (Sledge Meter) Smoothness/Roughness
- Roughness tester
- Bekk/Sheffield paper smoothness testers - Comparison with smoothness standards - Sled Test (IST 140.1)
Warmth
- Guarded hot-plate - Density method - Cover-factor method
- Thermal transmittance (ASTM D 1518) Stiffness (bending)
- ASTM D 1388 - ASTM D 5732 - Cantilever Test
- Heart Loop or Double-Cantilever Test - Circular Bend Stiffness Test (ASTM D 4032) - Flexometer
- Planoflex
- Clark Stiffness Tester - Gurley Stiffness Tester - Olsen Stiffness Tester - Shirley Cyclic Bending Tester
Other
- Fabric-Extraction Methods: · Ring pull through method · Ring push through method - Air Permeability (ASTM D 737) - Static Electricity
· ASTM D 4238
· AATCC Test Method 76 · AATCC Test Method 84 · AATCC Test Method 115 · AATCC Test Method 134 - Robotics (ex: Ramkumar’s research)
Note. Methods are listed by physical properties. Compiled from “Artificial Finger,” 2000; Bishop, 1996;
41 Fabric Hand Evaluation Systems
As previously mentioned, several researchers have worked to develop a system for fabric hand evaluation. These systems test fabric surface and mechanical properties under low stress conditions that better relate to how a fabric is handled by humans as opposed to the way the fabric is handled during manufacturing (Bishop, 1996; De Boos, 2005). Two well known fabric evaluation systems were developed in the 1970s and 1980s, the Kawabata Evaluation System for Fabrics (KES-F) and the Fabric Assurance by Simple Testing (FAST). A lesser known fabric evaluation system, the PhabrOmeter, has also been developed.
42
Table 9. Instruments and Measurements of the Kawabata Evaluation System for Fabrics
Instrument Measurement
KES-F1 Tensile and Shear Tester Load-extension characteristics Stress-strain characteristics
KES-F2 Bending Tester Couple-curvature characteristics
KES-F3 Compression Tester Pressure-thickness characteristics
KES-F4 Surface Tester Frictional force Vertical movement of a probe
Note. Information adapted into table from De Boos, 2005 and Kawabata, 1980.
43 Table 10. Instruments and Measurements of SiroFAST
Instrument Measurement
FAST-1 Compression Meter Fabric thickness under two loads
FAST-2 Bending Meter Bending length (stiffness) in both the machine and cross direction
FAST-3 Extension Meter Extensibility of the fabric in the machine, cross, and bias directions
FAST-4 Dimensional Stability Test Wet relaxation shrinkage and the hygral expansion of the fabric from wet to dry
Note. Information adapted into table from De Boos, 2005 and Tester & De Boos, 1990.
Unlike the KES-F system, FAST was developed for manufactures of garments; therefore, properties measured were properties important to garment construction, or tailoring. The results are presented in a way that shows the fabrics’ pros and cons in terms of garment development instead of fabric hand. This means that the interpretation of data was found to be more complex in terms of determining fabric hand. (De Boos, 2005).
There are noted differences between KES-F and FAST. For instance, FAST does not measure hysteresis or recovery properties which relate to softness, nor does it measure surface properties which relate to smoothness and roughness. FAST, however, does measure dimensional stability and while this does not affect hand, it is important for predicting the performance of the fabric during manufacturing and wear. FAST does not measure a total overall hand, but does measure and report a great amount of information regarding fabric hand. The system was designed for a more overall view of fabric hand and is useful in detecting the problems a fabric will cause during garment manufacturing (De Boos, 2005).
44
PhabrOmeter, a fabric evaluation system. The fingerprinting method is a circular chart with nine radii evenly distributed. Each radius represents a fabric characteristic (geographical roughness, smoothness, stiffness, thickness, compression, sheering, and three tensile measurements). In total, the chart identifies, or fingerprints, the softness of the fabric. The PhabrOmeter measures the fabric by a fabric extraction technique in which the sample is pushed through a ring. The fabric is deformed in a complex yet low stress state which includes tensile, shearing, bending, and frictional actions that are similar to the state when a human handles a fabric. A computer collects the measurements and reports a load-displacement curve for the fabric being tested. Typically, researchers only looked at the peak and the slope of the curve. However, Pan et al. looked to derive more points of the curve and relate those points to fabric attributes. They have been able to identify stiffness, smoothness, and softness within this curve (Pan, 2007; Pan et al., 1998).
45
CHAPTER III: METHODOLOGY
The purpose of this research was to develop a subjective fabric hand evaluation method in order to study a sample of American consumers in the central North Carolina region so the following research questions could be answered:
Research Question 1: How do nonwoven fabrics compare to woven fabrics?
1a. How do nonwoven fabrics rate in comparison to woven fabrics for comfort and fabric attributes (cool/warm, smooth/rough, thin/thick, flexible/stiff, tight/stretchy)?
1b. How do nonwoven fabrics rank in comparison to woven fabrics for general apparel and accessory products (long sleeve button-down shirt, short sleeve button-down shirt, pleated shorts, bag)?
Research Question 2: How do nonwoven fabrics compare to one another?
2a. How do nonwoven fabrics rate among one another for comfort and fabric attributes (cool/warm, smooth/rough, thin/thick, flexible/stiff, tight/stretchy)?
2b. How do nonwoven fabrics rank among one another for general apparel and accessory products (long sleeve button-down shirt, short sleeve button-down shirt, pleated shorts, bag)?
Research Question 3: Does gender and age affect consumer acceptance of nonwoven fabrics?
46
Subject Recruitment
Subjects were recruited by visiting local companies to test employees and customers, by visiting public schools (middle school, high school, and university levels) to test teachers, faculty, and students, and by attending group gatherings at private residences. The genders and ages of subjects were checked throughout data collection to ensure an even distribution of gender and age.