DEVELOPMENT OF;.\NINTELLIGENT PREDICTION TOOL FOR RICE YIELD BASED ON MACHINE LEARNING TECHNIQUES
IMohd. Noor Md. Sap, lA. Majid Awan
Faculty of Computer Science& Information Systems,University Technology Malaysia Skudai 81310, Johor,Malaysia
'mohdnoortgfsksm.utm.my, [email protected]
Abstract: Intelligent sys tems based on machine learning techniques. such as classification. clustering. are gaining Wide spread popularity in real world applications.This paper presents work on developing a softwaresystemfor predictingriceyield from climateand plantation data. In this work. the main focus is on classification and clustering techniques for data analysis based on statistical and machine learning approaches. Support vector machine algorithm is developedfor classification of rice plantation data. Whereas kernel-based clustering algorithm is developed for finding clusters in climate data.The values of these parametersat variouspoints of timeconstitutetime series.As the next step,correlationand regression analysis is appliedfor analyzing the impact of various parameters on the rice yield. and also for predicting the yield.
Keywords:Pattern analysis,clustering, kernel methods, spatial data,rice yield
1. Introduction
Rice is the primary food source for more than half of world population. United Nations declared 2004 as the International Year of Rice and recognized the needs for tools to monitor changes expected in the coming decades, due to: i) demand for rice in Asia projected to increase by 70%over the next 30 years; ii) at the same time, decline of harvest area (recent projections made by the International Food Policy Research Institute).
Malaysia is among the 12 mega bio-diversity countries in the world and offers tremendous business opportunities in the bio-industry which is a more sustainable new industry [1]. Agriculture is the third important engine of economic growth of Malaysia alongside manufacturing and services [2]. Broadly speaking, agriculture is still the most important sector in the context of Malaysia's socio-economic development. This sector absorbs a large part of the labor force. But, the contributionof agriculture in GDP is little, which can be substantially improved through better management practices. Rice is the most important food crop in Malaysia, but it has to import around 60%of the rice consumed here. The potential of rice production is reduced when its plantation is exposed to stressful weather conditions. So
monitoring rainfall and other related parameters (e.g. temperature, pressure, soil moisture,
sun-shine duration, humidity, etc.) is useful in predicting rice yield levels. The study of
various factors impacting the yield is helpful in looking for measures for improving rice yield
values. Moreover, pre-harvest estimates of rice production are indispensable for national food
security including policy determinations of import/export plans and prices. Yield prediction
models based on meteorological variables and agronomic parameters have been used till
recently. However, in spite of a significant influence of solar radiation on rice yield, none of
these models used solar radiation as one of the predictors. Keeping this in view,this study is
aimed at investigating the impacts of hydrological and meteorological conditions on rice
plantation using computational machine learning and statistical techniques. One goal in this
investigation is to achieve an improved understanding of the effect of various parameters
(including hydrological and meteorological parameters) on rice plantation to enhance its
productivity.
Machinelearning is the science of discovering and recognizing patterns in data,of actingand
decision making in uncertainty.Itrelies strongly on probability theory and statistics, which it
combines with algorithmic techniques often in elegant and surprising ways. In this study, the
main focus is on machine learning classification and clustering techniques such as kernel
machines, support vector machine along with elegant optimization techniques. Initially, a
small area is selected as a study region. Later, the study can be extended to the whole
Malaysia.
This paper is organized as follows. In the next section,a brief overview of the problem area
and methodology is given. In section 3,it is pointed out how kernel-basedmethods can be
useful for clustering non-linearly separable and high-dimensional spatial (climate) data. In
section 4, the proposed algorithm-a weighted kernel k-means algorithm with spatial
constraints-is presented which can be useful for handling noise,outliers and auto-correlation
in the spatial data.How support vector machines can be used for classifying rice plantation
areas is described in section 5.In section 6, some related work on using clustering approach
for studying the effect of climate on vegetation is given. Some experimental results of the
proposed clustering algorithm on rainfall data are given in section 7. Finally the paper
concludesinsection8.
2. Application Area and Methods
Keeping the importance in view, this study is aimed at investigating the impacts of
meteorological conditions and other related parameters on rice plantation using computational
machine learning techniques. Resulting improved understanding of the factors affecting rice
yield would not only help in accurately predicting yield levels but would also help
substantially in looking for mitigating solutions.
Intelligent systems based on machine learnirig techniques are gaining wide spread popularity
in real world applications. Classification and clustering are useful machine learning
techniques which can capture meaningful patterns in our target meteorological and plantation
data. Nevertheless, complexity of such data precludes the use of general purpose pattern
discovery and data analysis techniques [3].
This work focuses on classification and clustering techniques for data analysis based on
statistical and machine learning approaches. Classification algorithm is to be developed for
classification of rice plantation data. Whereas clustering algorithm is to be developed and
applied for fmding clusters in climate data. The values of these parameters at various points of
time constitute time series. As the last step, correlation and regression analysis can be applied
for analyzing the impact of various parameters on the rice yield, and also for predicting the
yield.
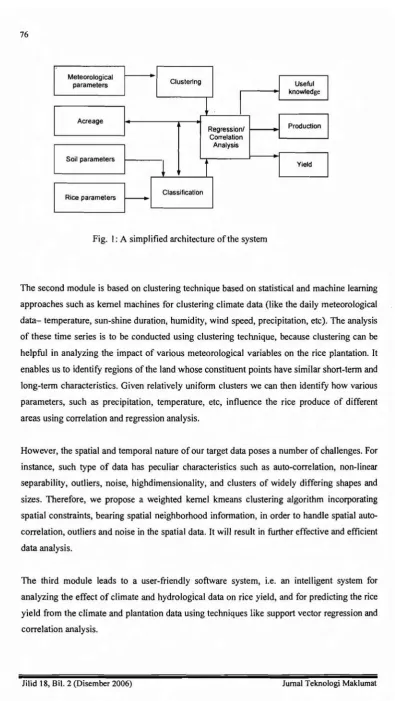
Inother words, this work can constitute three modules as shown in Figure I.
The first module consists of classification technique based on machine learning approach such
as support vector machine. The data about rice plantation is to be obtained both from field
surveys, at first instance. The purpose of this module is to classify rice plantation into
characteristic groups (e.g. based on rice varieties, soil type, weeds, pests, irrigation practices,
age groups, fertilizers, sowing dates, etc.).
Meteorological
parameters Clustering
I
UsefulI
I
Iknowledge
t
Acreage
I
Production
I
Regression!I Correlation
I
I
Analysis
Soil parameters
I
I
~
i
YieldI
Rice parameters
~
ClassificationFig. I: A simplified architecture of the system
The second module is based on clustering technique based on statistical and machine learning
approaches such as kernel machines for clustering climate data (like the daily meteorological
data- temperature, sun-shine duration, humidity, wind speed, precipitation, etc). The analysis
of these time series is to be conducted using clustering technique, because clustering can be
helpful in analyzing the impact of various meteorological variables on the rice plantation.It
enables us to identify regions of the land whose constituent points have similar short-term and
long-term characteristics. Given relatively uniform clusters we can then identify how various
parameters, such as precipitation, temperature, etc, influence the rice produce of different
areas using correlation and regression analysis.
However, the spatial and temporal nature of our target data poses a number of challenges. For
instance, such type of data has peculiar characteristics such as auto-correlation, non-linear
separability, outliers, noise, highdimensionality, and clusters of widely differing shapes and
sizes. Therefore, we propose a weighted kernel kmeans clustering algorithm incorporating
spatial constraints, bearing spatial neighborhood information, in order to handle spatial
auto-correlation, outliers and noise in the spatial data. It will result in further effective and efficient
data analysis.
The third module leads to a user-friendly software system, i.e. an intelligent system for
analyzing the effect of climate and hydrological data on rice yield, and for predicting the rice
yield from the climate and plantation data using techniques like support vector regression and
correlation analysis.
A number of kernel-based learning methods have been proposed in recent years [4--11].
However, much research effort is being put up for improving these techniques and in applying
these techniques to various applicati.on domains. Generally speaking, a kernel function
implicitly defines a non-linear transformation that maps the data from their original space to a
high dimensional space where the data are expected to be more separable. Consequently, the
kernel methods may achieve better performance by working in the new space. While powerful
kernel methods have been proposed for supervised classification and regression problems, the
development of effective kernel method for clustering, aside from a few tentative solutions [4,
7, 12], needs further investigation.
Finding good quality clusters in spatial data (e.g., temperature, precipitation, pressure, etc.) is
more challenging because of its peculiar characteristics such as auto-correlation (i.e.,
measured values that are close in time and space tend to be highly correlated, or similar),
non-linear separability, outliers, noise, high-dimensionality, and when the data have clusters of
widely differing shapes and sizes [13-15]. The popular clustering algorithms, like k-means,
have some limitations for this type of data [15, 16]. Therefore, we propose a weighted kernel
k-means clustering algorithm incorporating spatial constraints, bearing spatial neighborhood
information, in order to handle spatial auto-correlation, outliers and noise in the spatial data,
as described in section 4.
2.1 Problems with classical data analysis techniques for spatial data
Classical statistical data analysis algorithms often make assumptions (e.g., independent,
identical distributions) that violate the first law of Geography, which says that everything is
related to everything else but nearby things are more related than distant things. Ignoring
spatial autocorrelation may lead to residual errors that vary systematically over space
exhibiting high spatial autocorrelation [14]. The models derived may not only tum out to be
biased and inconsistent, but may also be a poor fit to the dataset [15].
One way of modeling spatial dependencies is to add a spatial autocorrelation term in the
regression equation. This term contains a neighborhood relationship contiguity matrix. Such
spatial statistical methods, however, are computationally expensive due to their reliance on
contiguity matrices that can be larger than the spatial datasets being analyzed [14] (for detail,
pls, refer to [14]).
3. Kernel-Based Methods
The kernel methods are among the most researched subjects within machine-learning community in recent years and have been widely applied to pattern recognition and function approximation.Typical examples are support vector machines [17-19], kernel Fisher linear discriminant analysis [20], kernel principal component analysis [12], kernel perceptron algorithm [21], just to name a few. The fundamental idea of the kernel methods is to first transformthe original low-dimensional inner-product input space into a higher dimensional feature space through some nonlinear mapping. The complex nonlinear problems in the original low-dimensional space can more likely be linearly treated and solved in the transformed space according to the well-known Cover's theorem. However, usually such mapping into high-dimensional feature space will undoubtedly lead to an exponential increase of computational time, i.e., so-called curse of dimensionality. Fortunately, adopting kernel functions to substitute an inner product in the original space, which exactly corresponds to mapping the space into higher-dimensional feature space, is a favorable option.Therefore,the inner product form leads us to applying the kernel methods to cluster complex data
l"
19, 22].Support vector machines and kernel-based methods: Support vector machines (SVM), having its roots in machine learning theory, utilizes optimization tools that seek to identify a linear optimal separating hyperplane to discriminate any two classes of interest [20, 23]. When the classes are linearly separable,the linear SVM performs adequately.
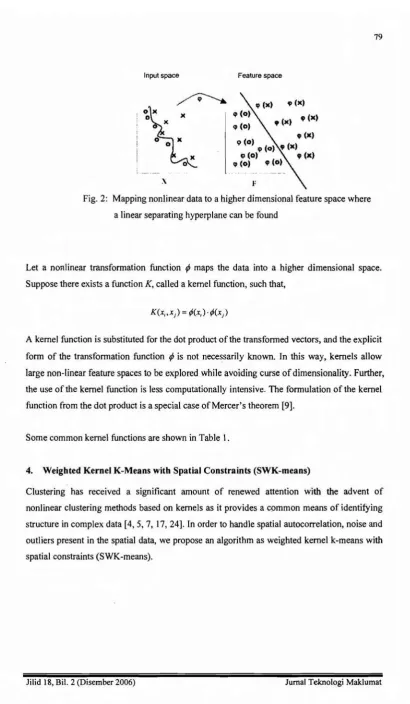
There are instances where a linear hyperplane cannot separate classes without misclassification, an instance relevant to our problem domain. However, those classes can be separated by a nonlinear separating hyperplane. In this case, data may be mapped to a higher dimensional space with a nonlinear transformation function. In the higher dimensional space, data are spread out, and a linear separating hyperplane may be found. This concept is based on the Cover's theorem on the separability of patterns. According to the Cover's theorem,an input space made up of nonlinearly separable patterns may be transformed into a feature space where the patterns are linearly separable with high probability, provided the transformation is nonlinear and the dimensionality of the feature space is high enough. Figure 2 illustrates that two classes in the input space may not be separated by a linear separating hyperplane, a common property of spatial data, e.g.rainfall patterns in a green mountain area might not be linearly separable from those in the surrounding plain area.However, when the two classes are mapped by a nonlinear transformation function, a linear separating hyperplane can be found in the higher dimensional feature space.
Input space Feature space
qI(x) 11(x)
• (x) ,(x)
ljl(0)
, (x)
9(0) 9 (0) 11 (x)
t;J(0) ,(x)
cp(0) • (0)
F
Fig. 2: Mapping nonlinear data to a higher dimensional feature space where
a linear separating hyperplane can be found
Let a nonlinear transformation function
¢
maps the data into a higher dimensional space.Suppose there exists a functionK,called a kernel function, such that,
A kernel function is substituted for the dot product of the transformed vectors, and the explicit
form of the transformation function
¢
is not necessarily known. In this way, kernels allowlarge non-linear feature spaces to be explored while avoiding curse of dimensionality. Further,
the use of the kernel function is less computationally intensive. The formulation of the kernel
function from the dot product is a special case of Mercer's theorem [9].
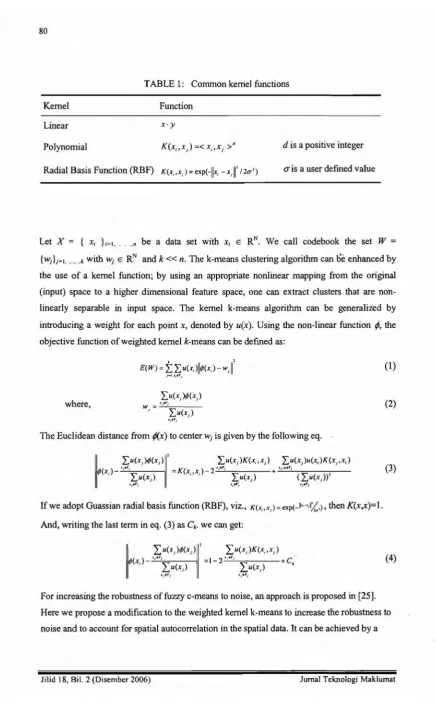
Some common kernel functions are shown in Table I.
4. Weighted Kernel K-Means with Spatial Constraints (SWK-means)
Clustering has received a significant amount of renewed attention with the advent of
nonlinear clustering methods based on kernels as it provides a common means of identifying
structure in complex data [4,5, 7, 17, 24]. In order to handle spatial autocorrelation, noise and
outliers present in the spatial data, we propose an algorithm as weighted kernel k-means with
spatial constraints (SWK-means).
TABLE 1: Common kernel functions
Kernel
Linear
Function
x·y
Polynomial dis a positive integer
Radial Basis Function (RBF) K(x"xj)
=
exp(-llx, -xJ f2u')CTis a user defmed value
Let X = { x, }i=l, . . .n be a data set with Xi ERN. We call codebook the set W =
{WjL=I. .. .. .kwithWj E RN and k « n. The k-rneans clustering algorithm can
be
enhanced bythe use of a kernel function; by using an appropriate nonlinear mapping from the original
(input) space to a higher dimensional feature space, one can extract clusters that are
non-linearly separable in input space. The kernel k-means algorithm can be generalized by
introducing a weight for each pointX, denoted by u(x). Using the non-linear function rjJ, the
objective function of weighted kernel k-means can be defined as:
where,
E(W)=
t
Lu(x,)II¢(x,)-W,11';-IA;lf"J
LU(X)¢(x)
w =-c.-"·-c.-'i=-_ _
, LU(X)
.I,Illl)
(1)
(2)
The Euclidean distance from rjJ(x)to centerWjis given by the following eq.
If we adopt Guassian radial basis function (RBF), viz., K(x"x,)=exp(_I>">jl;':'),then K(x,x)=1.
And, writing the last term in eq. (3) asCi.we can get:
(3)
(4)
For increasing the robustness offuzzy c-means to noise, an approach is proposed in [25].
Here we propose a modification to the weighted kernel k-means to increase the robustness to
noise and to account for spatial autocorrelation in the spatial data. Itcan be achieved by a
modification to eq.(1) by introducing a penalty term containing spatial neighborhood
information,as:
(5)
whereN,stands for the set of neighborsthat exist in a window aroundXI andNRis the
cardinality ofNi.The parameter r controls the effect of the penalty term. The distance in the
last term of eq. (5),can be calculated as
(6)
The expression for effective minimum distance from each point to every cluster representative
can be obtained from eq.(5) using eq.(4) and (6):
(7)
AsK(x;,xj)measures similarity betweenXiandXj,and whenXiis an outlier,thenK(x;,xj)will be very small. So, the second term in the above expression will get very low value. The total
expression will get higher value and hence results in robustness by not assigning the point to
the cluster. For detail about the algorithm,pIs.see [24].
5. Classification of rice plantation data using SYM
Land cover is one of the crucial elements for scientific research and real-life earth science
applications [26-32]. For many years, global,national,and regional managers and planners
have recognized the importance of land cover for a variety of development activities as it has
also been used as a fundamental variable in several fields such as agriculture, environment,
forestry, geology, and hydrology.Due to the large scale proliferation of remote sensing data,
they have become attractive sources of land cover information. Several classification
algorithms have been developed and successfulIy implemented to produce land cover
classification from multispectral data. However, these algorithms fail to deliver high accuracies for classifying hyperspectral images [31,33-35].
Classification algorithms may be grouped into parametric and non-parametric techniques.
For parametric classifiers, such as the maximum likelihood classifier (MLC), the data are
assumed to folIow a statistical distribution to estimate accurate parameters, which in tum
depend on the selection of appropriate training sample size. In case of hyperspectral data
acquired in several dimensions, these classifiers suffer from the problem of the curse of
dimensionality, also referred to as the Hughes phenomenon [34, 36]. As a result,
nonparametric classifiers such as neural networks and decision trees have often been
implemented to classify hyperspectral data. In fact, neural network classifiers, particularly the
one based on the back propagation algorithm, have been viewed as a substitute for the most
widely used MLC. Though neural networks have an advantage as they can work with
complex data sets, they are slow during the training phase. Moreover, they work as a black
box in which the internal architecture is hidden. Support Vector Machine can overcome the
limitations of the other non-parametric classifiers.It can be used for classifying land cover
information of rice plantation from remote sensing data. Moreover, rice plantation can also be
classified into various categories based on related parameter values, e.g., soil, age, irrigation,
usage of fertilizers, pests, weeds, etc.
SVM has originated from statistical learning theory pioneered by Boser et al. [37] in the
middle of the 1990's. Statistical learning theory establishes bounds on the error rate of a
learning machine on unseen data, called the generalization error rate. These bounds are a
function of the sum of the training error rate and the terms that measure classifier complexity.
To minimize the bounds on the generalization error rate, both the sum of the training error
rate and the classifier complexity must be minimized. Vapnik [17] shows that the bounds on
the generalization error rate can be minimized by explicitly maximizing the margin of
separation. Consequently, a better classification performance on unseen data can be expected,
and thus high generalization can be achieved. Moreover, since the margin of separation is not
dependent on the dimensionality of the data, accurate classification from high dimensional
data is possible.
SVM aims to maximize the margin between two classes of interest and place a linear
separating hyperplane between them. Moreover, SVM can adapt itself to become a nonlinear
classifier by simply mapping data into a higher dimensional feature space that spreads the
data out. This is equivalent to a nonlinear classifier in the original input space. Because SVM
can adequately classify data in a higher dimensional feature space with a limited number of
training data sets, it overcomes the Hughes Phenomenon.
6. Related Work
In this section we discuss some of the related work for illustrating issues involved in
clustering our application domain data.
In [38], a mixture model approach is used to identify the cluster structure in atmospheric
pressure data. (Mixture models assume that the data are generated probabilistically from a
mixture of Gaussian distributions and use the data to estimate the parameters of these
distributions). This approach is related to k-means [39], but has two advantages. First, it
assigns a "membership" probability to each data point and each cluster. These probabilities
provide a measure of the uncertainty in cluster membership. Second, it is sometimes possible
to estimate the most appropriate choice for k [38].(Itis also possible to estimate the best k for
k-means by plotting the overall error or similarity for different values ofk and looking for the
knee in the plot).
Another possible approach to clustering, particularly in spatially oriented domains, is to use
"region growing." Starting with individual points as clusters, each cluster is grouped with the
most similar, physically adjacent cluster, until there is only one cluster. (Sometimes various
criteria are applied to prevent clusters from being merged if the resulting cluster is too "poor").
This approach can be viewed as a form of hierarchical clustering which has the constraint that
clusters can only be merged if the resulting cluster is contiguous, i.e., not split into
disconnected sets of points [40].
However, it is sometimes desirable to have clusters that are "piecewise contiguous," i.e.,
consist of points which are similar, but not all in one contiguous region. An example of such
an approach is presented in [41] and was applied to the problem of land use classification
based on spectral image data. The technique, Recursive Hierarchical Image Segmentation,
consists of alternating steps in which similar, adjacent regions are merged (a region growing
step) and similar, non-adjacent regions are merged (a spectral clustering step). For land use
classification, this allows the grouping of points, which may represent the same type of land
cover, but which are in disconnected regions.
A related work [42] introduces ACTS (Automatic Classification of Time Series), a clustering
method for remote sensing time series. (The data considered are NDVI, the Normalized
Difference Vegetation Index, or greenness index [43
D.
The goal of this work is to useclustering as an initial step for deriving continental-scale to global-scale vegetation maps.
After the removal of components with a period of one year or less, clustering is also used to
group points that had similar patterns of inter-annual variation in NDVI. However, there was
no investigation of the relationships between different regions of the land and the climate
factors.
Another related work is reported in [15]. The goal of this work is to use climate variables,
such as long term sea level pressure (SLP) and sea surface temperature (SST), to discover
interesting patterns relating changes in NPP (Net Primary Production-plant growth) to land
surface climatology and global climate. (NPP is the net assimilation of atmospheric carbon
dioxide into organic matter by plants). Inthis work, ocean climate indices (OCIs) and rainfall
indices are found from the relevant time series using shared nearest neighbor clustering
technique. This way clustering is used to find interesting connections between land and ocean
regions for the discovery of interesting ecosystem patterns.
While there has been considerable research into hierarchical clustering and spatial clustering
[13], many issues still remain. Some of the new issues of zone formation are zonal formation
over time, the multi-scale nature of the data, and constrained zone formation.
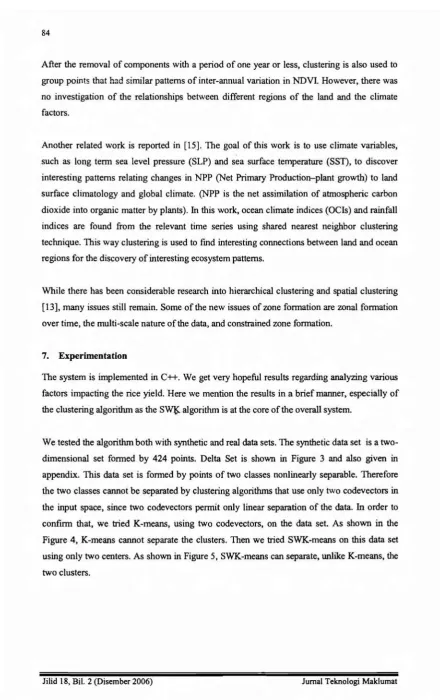
7. Experimentation
The system is implemented in C++. We get very hopeful results regarding analyzing various
factors impacting the rice yield. Here we mention the results in a brief manner, especially of
the clustering algorithm as the SWt<. algorithm is at the core of the overall system.
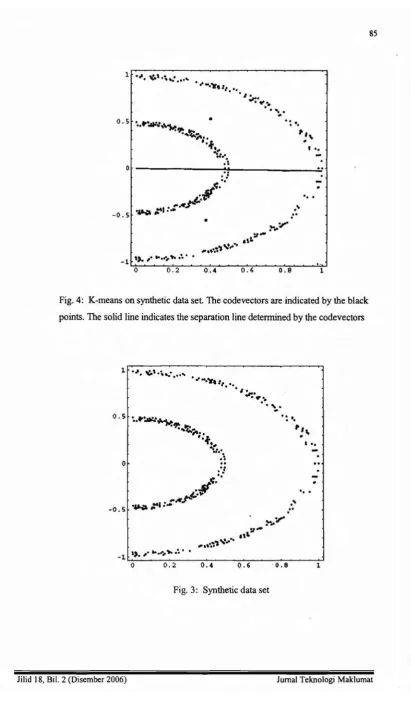
We tested the algorithm both with synthetic and real data sets. The synthetic data set is a
two-dimensional set formed by 424 points. Delta Set is shown in Figure 3 and also given in
appendix. This data set is formed by points of two classes nonlinearly separable. Therefore
the two classes cannot be separated by clustering algorithms that use only two codevectors in
the input space, since two codevectors permit only linear separation of the data. Inorder to
confirm that, we tried K-means, using two codevectors, on the data set. As shown in the
Figure 4, K-means cannot separate the clusters. Then we tried SWK-means on this data set
using only two centers. As shown in Figure 5, SWK-means can separate, unlike K-means, the
two clusters.
'
..
....
..
.
•
•
...
~., I ••••,~
.
.
"
...
.
'.-.:
-.
o
0.5
-0.5
-1 ,).,..., ... :.flo•
o
0.2 0.4 0.6 0.8 1Fig. 4: K-means on synthetic data set. The codevectors are indicated by the black
points. The solid line indicates the separation line determined by the codevectors
1 .~. ~'.\...'tlo
0.5
o
-0.5
-1 ').,..., ...
• ...~t,
.
'..,.
--':.-",.•
.
.
'..-. : t'..-.
....
...
I ••
-'
..
o
0.2 0.4 0.6 0.8 1Fig. 3: Synthetic data set
1
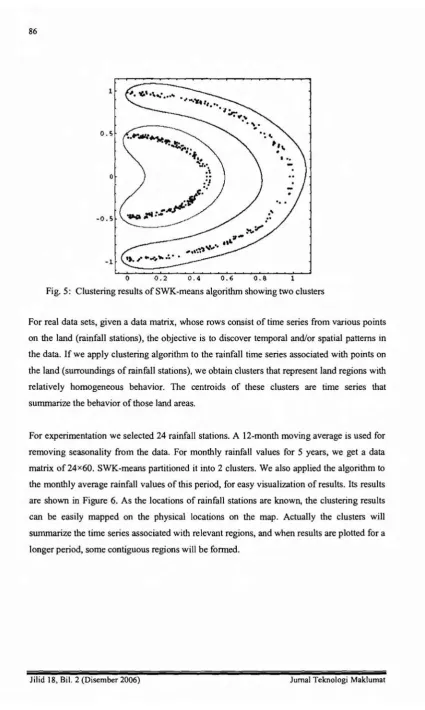
o
0.2 0.4 0.6 0.8 1Fig. 5: Clustering results ofSWK-means algorithm showing two clusters
For real data sets, given a data matrix, whose rows consist of time series from various points
on the land (rainfall stations), the objective is to discover temporal and/or spatial patterns in
the data.Ifwe apply clustering algorithm to the rainfall time series associated with points on
the land (surroundings of rainfall stations), we obtain clusters that represent land regions with
relatively homogeneous behavior. The centroids of these clusters are time series that summarize the behavior of those land areas.
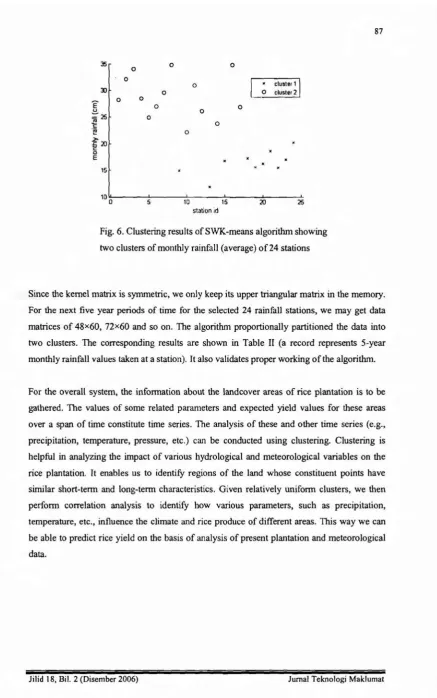
For experimentation we selected 24 rainfall stations. A 12-monthmoving average is used for
removing seasonality from the data. For monthly rainfall values for 5 years, we get a data
matrix of 24x60.SWK-means partitioned it into 2 clusters. We also applied the algorithm to
the monthly average rainfall values of this period, for easy visualization of results.Its results are shown in Figure 6. As the locations of rainfall stations are known, the clustering results
can be easily mapped on the physical locations on the map. Actually the clusters will
summarize the time series associated with relevant regions,and when results are plotted for a
longer period, some contiguous regions will be formed.
35 0
0
0
0
D 0
0 0
E
u 0~25 0
~
~ 0
{<U
0
E
15
o
o
o
o
25
<U
10 15
stationid 5
1 0 u . . O 1 . ' i ' '
-Fig. 6. Clustering results of SWK-means algorithm showing two clusters of monthly rainfall (average) of 24 stations
Since the kernel matrix is symmetric, we only keep its upper triangular matrixinthe memory.
For the next five year periods of time for the selected 24 rainfall stations, we may get data matrices of 48 x60, 72x60 and so on. The algorithm proportionally partitioned the data into two clusters. The corresponding results are shown in Table II (a record represents 5-year monthly rainfall values taken at a station).Italso validates proper working of the algorithm. For the overall system, the information about the landcover areas of rice plantation is to be gathered. The values of some related parameters and expected yield values for these areas over a span of time constitute time series.The analysis of these and other time series (e.g.,
precipitation, temperature, pressure, etc.) can be conducted using clustering. Clustering is helpful in analyzing the impact of various hydrological and meteorological variables on the rice plantation. It enables us to identity regions of the land whose constituent points have similar short-term and long-term characteristics. Givenrelatively uniform clusters, we then perform correlation analysis to identify how various parameters, such as precipitation, temperature, etc., influence the climate and rice produce of different areas. This way we can be able to predict rice yield on the basis of analysis of present plantation and meteorological data.
TABLE 2': Results of SWK-Means on Rainfall Data at 24
Stations for 5, 10, 15,20,25,30,35 years
No. of Records No. of records No. of records in cluster 1 in cluster 2
24 10 14
48 20 28
72 30 42
96 40 56
120 50 70
144 60 84
168 70 98
8. Conclusion
It is highlighted how computational machine learning techniques, like clustering and
classification, can be effectively used in analyzing the impacts of various hydrological and
meteorological factors on vegetation. However, there are a few challenges especially related
to clustering spatial data as pointed out. Among these, the important issues/problems that
need to be addressed are: i) non-linear separability of data in input space, ii) outliers and noise,
iii) auto-correlation in the spatial data, iv) high dimensionality of data.
The kernel methods are helpful for clustering complex and high dimensional, and non-linearly
separable data. Consequently for developing a system for rice yield prediction, an algorithm,
weighted kernel k-means incorporating spatial constraints, is proposed. The proposed
algorithm has the mechanism to handle spatial autocorrelation, noise and outliers in the
spatial data.It is hoped that the algorithm would prove to be robust and effective for spatial
(climate) data analysis. Therefore, it is hoped that the proposed software system, based on
machine learning techniques, will prove to be very effective in predicting rice yield based on
sets of rice plantation parameters and meteorological data.
References
[1] Datuk Mohd Effendi, Agriculture Minister. Good bio-industry business prospects in
Malaysia. The Star (newspaper), 26 March 2002.
[2] L.L. Poh and Ismail Mat. The Financial Crisis and Agricultural Productivity in Asia and
the Pacific. Country Papers MALAYSIA Edited by Dr. Tongroj Onchan, Published by
the Asian Productivity Organization, Japan. 2004.
[3] Harvey J. Miller. Geographic data mining and knowledge discovery.InJ.P. Wilson and
A S. Fotheringham (eds.) Handbook of Geographic Information Science, Blackwell
Publishers, 2006.
[4] F. Camastra, A Verri, "A novel kernel method for clustering," IEEE Trans. Pattern
Analysis and Machine Intelligence, vol. 27, pp. 801-805, May 2005.
[5] LS. Dhillon, Y. Guan, andB.Kulis, "Kernel kmeans, spectral clustering and normalized
cuts," in Proc. 10th ACM SIGKDD Int. Con! on Knowledge Discovery and Data Mining,
pp. 551-556,2004.
[6] C. Ding and X. He, "K-means clustering via principal component analysis," in Proc. 21"
Int. Con! Machine Learning,July 2004, pp. 225-232.
[7] M. Girolami, "Mercer kernel based clustering in feature space," IEEE Trans. Neural
Networks,vol. 13(3),pp.780-784, May 2002.
[8] AM. Awan and M.N. Md. Sap,"Anintelligent system based on kernel methods for crop
yield prediction," inAdvances in Knowledge Discovery and Data Mining, W.K. Ng, M.
Kitsuregawa, J. Li (Eds.). Lecture Notes in Computer Science (LNCS), vol. 3918, pp.
841-846, Springer, 2006.
[9] B.Scholkopf and A Smola, Learning with Kernels: Support Vector Machines,
Regularization, Optimization, and Beyond.MIT Press, 2002.
[10] F. Camastra, "Kernel methods for unsupervised leaming," PhD thesis, University of
Genova, Italy, 2004.
[11] L. Xu, J. Neufeld,B.Larson, and D. Schuurmans, "Maximum margin clustering," in
Proc. Advances in Neural Information Processing Systems(NIPS2004), 2004.
[12] B. Scholkopf, A Smola, and K.R.Muller, "Nonlinear component analysisasa kernel
eigenvalue problem," Neural Computation, vol. 10, no; 5, pp. 1299-1319,1998.
[13] 1. Han, M. Kamber and K. H. Tung, "Spatial clustering methods in data mining: a
survey," inGeographic Data Mining and Knowledge Discovery, Harvey J. Miller and
Jiawei Han (eds.). Taylor and Francis, 2001.
[14] S. Shekhar, P. Zhang, Y. Huang, and R. Vatsavai, "Trends in spatial data mining," as a
chapter inData Mining: Next Generation Challenges and Future Directions, H.
Kargupta, A. Joshi, K. Sivakumar, andY.Yesha (eds.). MIT Press, 2003.
[15] P. Zhang, M. Steinbach, V. Kumar, S. Shekhar, P-N Tan, S. Klooster, and C. Potter,
"Discovery of patterns of earth science data using data mining," as a Chapter inNext
Generation ofData Mining Applications, J. Zurada and M. Kantardzic (eds.). IEEE Press,
2003.
[16] M. Steinbach, P-N. Tan, V. Kumar, S. Klooster and C. Potter, "Data mining for the
discovery of ocean climate indices," inProc. 5th Workshop on ScientificD~taMining at
2nd SIAM Int. Con! on Data Mining, 2002.
[17] A. Ben-Hur, D. Hom, H. Siegelman, and V. Vapnik, "Support vector clustering,"J.
Machine Learning Research, vol. 2(Dec.), pp. 125-137,2001.
[18] N. Cristianini and J.S.Taylor,An Introduction to Support Vector Machines. Cambridge
Academic Press, 2000.
[19] V.N. Vapnik,Statistical Learning Theory. John Wiley & Sons, 1998 .
[20] V. Roth and V. Steinhage, "Nonlinear discriminant analysis using kernel functions," in
Advances in Neural Information Processing Systems 12, S. A Solla, T.K.Leen, and
K.-R. Muller (Eds.), pp. 568-574. MIT Press, 2000.
[21] J. H. Chen and C. S. Chen, "Fuzzy kernel perceptron,"IEEE Trans. Neural Networks,
vol. 13, pp. 1364-1373, Nov. 2002.
[22] D.S. Satish and C.C. Sekhar, "Kernel based clustering for multiclass data," inProc. Int.
Con! on Neural Information Processing, Kolkata, India, Nov. 2004.
[23] V.N. Vapnik,The Nature ofStatistical Learning Theory. Springer-Verlag, New York,
1995.
[24] A.M. Awan, M.N Md. Sap and M.O. Mansur, "Weighted kernel k-means for clustering
spatial data," WSEAS Trans. on Systems, vol. 5, issue 6, pp. 1301-1308, June 2006.
[25] M.N. Ahmed, S.M. Yamany, N. Mohamed, A.A. Farag and T. Moriarty, "A modified
fuzzy c-means algorithm for bias field estimation and segmentation of MRI data,"IEEE
\
Trans. Medical Imaging, vol. 21, pp.193-199, 2002.
[26] P. Watanachaturaporn, M.K. Arora and P.K. Varshney, "Lagrangian Support Vector
Machines (LSVM) for land cover classification from remote sensing data," inProc. the
11
m
Int. Conf. on Geoinformatics. June 25-27, 2003, Toronto, Canada.[27] A. Mathur, G.M. Foody, "Land cover classification by support vector machine: towards
efficient training," in Proc. IEEE International Geoscience and Remote Sensing
Symposium (IGARSS '04), 2004.
[28] C. Huang, L.S. Davis and J.R.G. Townshend, "An assessment of support vector
machines for land cover classification," International Journal of Remote Sensing, 23,
725-749.2002.
[29] G. Zhu and D.G. Blumberg, "Classification using ASTER data and SVM algorithms:
The case study of Beer Sheva, Israel,"Remote Sensing of Environment, 80, 233-240.
2002.
[30] J.A. Gualtieri and R.F. Cromp, "Support vector machines for hyperspectral remote
sensing classification," in Proc. the 27th AIPR Workshop: Advances in Computer
Assisted Recognition, Washington DC, October 27, 1998, pp. 221-232.
[31] J.B. Campbell, Introduction to remote sensing (2nd ed.), New York: Guilford Press,
1996.
[32] P.J. Sellers, B.W. Meeson, et al., "Remote sensing of the land surface for studies of
global change: Models - algorithms - experiments," Remote Sensing of Environment,
51(3-26). 1995.
[33] J.R. Jensen,Introductory digital itnagt: processing: a remote sensing perspective (2nd
ed.). Upper Saddle River, N.J.: Prentice Hall, 1996.
[34] D. Landgrebe, "Hyperspectral image data analysis," IEEE Signal Process. Mag., 19,
17-28.2002.
[35] J.A. Richards & X. Jia,Remote sensing digital image analysis: an introduction (3rd ed.).
Berlin; New York: Springer, 1999.
[36] G.F. Hughes, "On the mean accuracy of statistical pattern recognition," IEEE Trans.
Inform. Theory, 14(55-63), 1968.
[37] B.E. Boser, I.M. Guyon & V.N. Vapnik, "A training algorithm for optimal margin
classifiers," in Proc. of the 5th Annual ACM Workshop on Computational Learning
Theory, 27-29 July 1992, Pittsburgh, PA, USA.
[38] P. Smyth, K. Ide, and M. Ghil, "Multiple regimes in northern hemisphere height fields
via mixture model clustering,"J.Atmospheric Science, 56, 3704-3723. 1999.
[39] T. Mitchell,Machine Learning. McGraw Hill, 1997.
[40] F. Murtagh, "Contiguity-constrained hierarchical clustering," inPartitioning Data Sets,
I.J.Cox, P. Hansen andB.Julesz, (eds.), DIMACS workshop, AMS (American
Mathematical Society), 1995, pp. 143-152.
[41] 1. C. Tilton, "Image segmentation by region growing and spectral clustering with a
natural convergence criterion," inProc. Int. Geoscience and Remote Sensing Symp.,
Seattle, WA, 1998, pp. 1766-1768.
[42] N. Vivoy, "Automatic classification of time series (ACTS): a new clustering method for
remote sensing time series,"Int. J. Remote Sensing, vol. 21, pp. 1537-1560,2000.
[43] http://earthobservatory.nasa.govlLibrary/
Synthetic Data Set
0.952312 -0.305127 0.4297970.89267 0.0226266 -0.981239
0.9356760.352151 0.618781 -0.773434 0.9136930.357793
0.813347 -0.580918 0.8601940.490572 0.196779 -0.961061
0.1168120.992399 0.0639345 -0.987933 0.44578 0.873585
0.782664 -0.620837 0.716808 0.68249 0.581028 -0.789802
0.4715040.880446 0.837115 -0.527588 0.6329060.748546
0.778361 -0.625425 . 0.9155950.374568 0.722945 -0.661627
0.9455160.32016 0.310132 -0.939116 0.559991 0.80394
0.976521 -0.205939 0.686071 0.711992 0.407114 -0.890886
0.5270410.847191 0.235733 -0.95998 0.7572830.620848
0.758815 -0.647461 0.644211 0.74942 0.141369 -0.968739
0.7942430.603064 0.508715 -0.846967 0.1198080.971389
0.166668 -0.98297 0.592090.790619 0.844838 -0.493671
0.6581640.748552 0.439148 -0.88448 0.7529260.62456
0.626604 -0.774842 0.488783 0.857761 0.60214 -0.770657
0.5424620835613 0.493157 -0.854965 0.388641 0.897192
0.801793 -0.590885 0.9641380.210033 0.153629 -0.965352
0.706563 0.701632 0.424658 -0.89042 0.6758150.705898
0.775214 -0.624551 0.281570.945202 0.391336 -0.895201
0.9386390.330877 0.45641 -0.874006 0.3579180.90881
0.747244 -0.657001 0.870383 0.46275 0.673204 -0.707353
0.03019450.994292 0.174383 -0.969949 0.2589980.941267
0.604181 -0.789934 0.8594610.481711 0.683498 -0.696711
0.27210 1 0.956292 0.584398 -0.792909 0.9121540.346502
0.793896 -0.598135 0.4423060.879828 0.650027 -0.727369
0.0938535 0.989308 0.543674 -0.820767 0.325877 0.919194
0.788608 -0.604267 0.003605980.984243 0.487223 -0.844535
0.1557160.980968 0.520258 -0.835217 0.468166 0.854961
0.0151336 -0.992885 0.7131450.677635 0.0718876 -0.971845
0.6178370.777065 0.694583 -0.696295 0.6707610.706571
0.014131-0.992399 0.07681030.980245 0.742204 -0.630721
0.2079760.970209 0.211479 -0.959982 0.8848740.406433
0.0364683 -0.991329 0.Q30512 0.982276 0.640694 -0.732949
0.0933427 0.987348 0.459575 -0.868388 0.890679 0.392309
0.251366 -0.959108 0.4186820.888549 0.600939 -0.765246
0.409553 0.902687 0.687639 -0.701054 0.764891 0.600986
0.861767 -0.489325 0.4237370.885596 0.772878 -0.590268