ROHAIZAT BAHARUN*
ABU BAKAR ABDUL HAMID
AHMAD SHARIFUDDIN SHAMSUDIN
NOR ZAFIR MD SALLEH
NORZAIDAHWATI ZAIDIN
ZURAIDAH SULAIMAN
THE MARKET SEGMENTATION
IN MALAYSIA BY USING
PSYCHOGRAPHIC DIMENSIONS
2
INTRODUCTION
The rapidly changing market place environment has resulted in a majority of consumers at both national and international levels
feeling confused and facing difficulties in making decisions. Among
the contributing factors towards the phenomena are over-selection of products and services, sophisticated and complex products, innovative marketing communication, dumping of counterfeiting
products and similarities in branding. In the same development, many
scholars and researchers have long acknowledged the importance of knowing why customers choose a particular product and service
and the factors that influence them to make the selection. In
response to this competitive environment, scholars in the marketing
field have introduced the concept of differentiation and market segmentation. The purpose of market segmentation is to identify
the taxonomy of consumption patterns by dividing a market into
several homogeneous sub-markets. By using this concept, marketers
specifically to the demands of these homogeneous sub-markets which are defined by predetermined segmentation variables (Chin, 2002, p.249) while companies can increase profitability by utilizing market segmentation. Furthermore, segmentation can also enhance marketing effectiveness and develop or maintain an organization’s ability to benefit from identifiable marketing opportunities (Weinstein, 1987 in Quinn, Hines and Bennison, 2007).
The concept of market segmentationwhich was first introduced by Wendell Smith in 1956 (Minhas and Jacobs, 1996), is a process of dividing markets into smaller segments based on certain criteria
such as needs and wants, characteristics and customer behaviour.
Several overviews on conceptual and methodological foundations
of market segmentation are available in the field of marketing. Since
then market segmentation has become widely regarded as one of
the core principles in marketing (Kotler and Amstrong, 2007) and is closely linked to the marketing concept (Segal and Giacobbe, 1994). Furthermore, Kotler’s segmentation, targeting and
positioning model is one of the most widely understood overviews
of the stages involved in the process. While there are many ways
to segment customers, scholars and researchers use a variety of criteria for market segmentation depending on the product or service
offered or target customers. For example, Kotler and Amstrong (2007) proposed that customer markets should be divided according
to geographic, demographic, and psychographic and behaviour
variables.
The more traditional segmentations, however, are based on demographic variables alone such as age, income, gender, education
levels and geography. Demographic dimensions have received broader acceptance and lend themselves easily to quantification and easy classification (Kucukemiroglu, 1999, Walsh and Mitchell, 2005 and Bojanic, 2007). However according to Oates, Shufeldt and Vaught (1996), demographics alone do not give a complete picture of the customers and is not deemed sufficient. Bone (1991)
while Kucukemiroglu (1999) argued that it has been questioned.
Furthermore, traditional demographic variables cannot identify the complete characteristics of the sub-markets because consumers in the same demographic group may have very different psychographic
make-ups (Kotler and Armstrong, 2007).
Psychographic is an approach used to define and measure the lifestyles of consumers. Psychographic segmentation can be based on social class, or personality variables (Kotler and Amstrong, 2007). However, segmentation based on psychographics remain
little used, understood, or appreciated, although such segmentation
is often useful for forecasting and influencing future behaviour (SRI Consulting, 1997).
This study, in line with prior research, adapts a psychographic
segmentation approach to the financial service industry in particular the unit trust products. A grant was obtained from one of the renowned
/ well-known unit trust companies in Malaysia to come out with a
segmentation model of Malaysian customers. The paper begins by providing a theoretical background of the relevant literature. This
is followed by the methodology and results from the quantitative
study. The paper concludes with a discussion of the implication of the findings and identifies limitations and areas for future research.
CUSTOMER LIFESTYLE AND PSYCHOGRAPHICS
Much prior research has successfully employed consumer lifestyle
to predict and profile natural segments of users for a number of products and services all over the world. Modern theory defines
lifestyle as a summary of construct patterns in which people live
demographic characteristics (Kucukemiroglu, 1999: 473).
Many psychographic researchers have stressed the
psychological dimension of customers’ behaviour (Kesic and Piri-Rajh, 2003) and reflect different modes of living and patterns of consumption that tend to accompany them (Todd, Lawson and Faris, 1997). Well-known attempts in literature to measure the quantitative dimensions of lifestyle were initially referred to as psychographics.
Psychographics research focuses on individual activities known as
behaviour, interest and opinions (AIO).
This is the most widely used approach to lifestyle measurement in
numerous prior research done . Hence, lifestyle patterns provide a
broader, more three dimensional view of consumers that marketers and businessmen should take into serious consideration.
In addition, the success of a marketing model inherently
lies in the researchers’ ability to identify variables that can really distinguish people’s performance in the marketplace. Bojanic (2007)
listed a few criteria that are normally used to evaluate the effectiveness of the market segmentation strategies such as substantiability,
measurability, accessibility and actionability. Once the segmentation strategy satisfies these four criteria, the next step is to choose the
segmentation variables that would work best at segmenting the
market. As mentioned above, demographic variables are not deemed sufficient because demographics lack richness and often need to be supplemented with additional data (Wells, 1975 in Kucukemiroglu, 1999). However, some researchers have suggested the need to add demographics as a fourth dimension of people’s lifestyle (Boste, 1984 in Kesic and Piri-Rajh, 2003). According to Oates et al. (1996),
by incorporating psychographic information with demographics, the marketer will be able to better understand the wants and needs of
the consumers. They conclude that psychographic variables have emerged as a very robust technique of identifying distinct categories
of buyer behaviour. According to Kotler and Amstrong (2007), in
psychographic segmentation, customers are divided into different
an approach used to define and measure the lifestyles of consumers (Tam and Tai, 1998) and lifestyle has been defined simply as “how
one lives”; lifestyle can be described as the behaviour of individuals, a small group of interacting people, and large groups of people such
as market segments and acting as potential customers (Tam and Tai (1998). Thus, value and lifestyles are psychographic variables
that provide companies with a clearer orientation to identify the
ecological consumer segment (Fraj and Martinez, 2006).
According to Solomon, Marshall and Stuart (2008), products are the building blocks of lifestyles. Customers define their lifestyles
by the consumption choices they make in a variety of product
categories. Chin (2002) suggested that lifestyle can be defined quantitatively and used as a group identity for market segmentation. Gonzalez and Bello (2002) concluded that the construct “lifestyle” is defined by including variables like activities, which refer to the way in which individuals spend their time and money; interests i.e.
things in their immediate surroundings they consider more or less
important; and opinions i.e. the view they have of themselves and of the world around them. According to Todd, Lawson and Faris (1997),
lifestyles offer a more comprehensive view of behaviour and the motives that underlie many of the purchases made by the customers,
which are regarded as advantageous for market segmentation. Kesic and Piri-Rajh (2003) suggested that the concept of lifestyle has been
developed to measure behaviour as a function of inherent individual characteristics that have been shaped through the social interaction
of psychological and sociological factors and past experiences.
Insummary, Gonzalez and Bello (2002) concluded that two
methodologies can beapplied in business research depending on the
degree to which the information is more general or more specific:
(a) Segmentation of the population in accordance with general
lifestyle. This permits the definition of broad categories
of consumers in response to the lifestyle criterion chosen,
(b) Market segmentation according to features of lifestyle specific to the product or service concerned. The segmentation study is based on questions linked to a given type of consumption.
ASSOCIATED PATTERN TECHNIQUE IN PSYCHOGRAPHIC MEASUREMENTS
According to Quinn et al. (2007), the 1980s saw concerted academic and practitioner efforts to develop a truly generalizable psychographic segmentation model. The psychographic statements can be either standardized or ad hoc in scale. The first model and the
popular application of lifestyle measurements were introduced by
SRI International. This model provided a systematic classification of US citizens into nine different segments. According to Tam and Tai (1998), the choice of scale depends on the objective of the study. For standardized scale, personal value or characteristic classifications in list of values (LOV), Value and lifestyles (VALS2) and Rokeach Value Survey (RVS) are often used to develop effective segmentation strategy and has been tested in different cultural surroundings (Fraj and Martinez, 2006). However, numerous research use either one or a combination of both type of scales. Observation by Oates et al. (1996) found that between three to six categories have been
developed depending on the questionnaire, sample, and statistical
method employed. The main problem in the measurement is the difficulty of measuring them. The researchers found different ways of measuring psychographic in the literature. Many researchers
suggested that it would be possible to develop a universal set of
values recognisable in different cultures. Furthermore, empirical
research attempting to measure this phenomenon is limited, and a
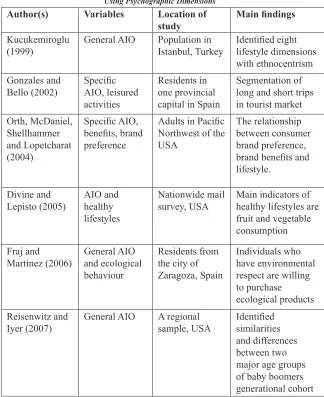
number of authors have found inconsistent results. Table 1 illustrates
those of greatest interest found in the literature which forms thebasis
Author(s) Variables Location of
study Main findings Kucukemiroglu
(1999) General AIO Population in Istanbul, Turkey Identified eight lifestyle dimensions with ethnocentrism
Gonzales and
Bello (2002) Specific AIO, leisured activities
Residents in one provincial capital in Spain
Segmentation of long and short trips in tourist market Orth, McDaniel, Shellhammer and Lopetcharat (2004) Specific AIO, benefits, brand preference
Adults in Pacific
Northwest of the USA
The relationship between consumer brand preference,
brand benefits and lifestyle.
Divine and
Lepisto (2005) AIO and healthy lifestyles
Nationwide mail
survey, USA Main indicators of healthy lifestyles are fruit and vegetable consumption Fraj and
Martinez (2006) General AIO and ecological behaviour
Residents from the city of
Zaragoza, Spain
Individuals who have environmental respect are willing to purchase ecological products
Reisenwitz and
Iyer (2007) General AIO A regional sample, USA Identified similarities and differences between two major age groups of baby boomers generational cohort
Although, the concept of market segmentation was
first introduced by Wendell Smith in 1956, research on market segmentation has intensively evolved since the 1980s. Since then,
many attempts have been made to develop a system to measure
lifestyle concept worldwide. In Malaysia, it started in the late 1990s when AC Nielsen began their first market lifestyle study. Such
interesting and diverse research in market segmentation of lifestyle
and specific interest in the Malaysian finance-related lifestyle (because of different cultural groups living in a relatively small geographic area), have influenced our decision to investigate this lifestyle segment of the Malaysian population. Since most published
studies are rooted in Western society, it was considered inappropriate to directly adopt these theories and practices to Malaysian society
which is heterogeneous and culturally distinct. Our decision was
based on the knowledge of a multi-cultural Malaysian society and
the popularity of the unit trust market among Malaysians. This
study uses lifestyle analysis, along with other research techniques, to identify consumer market segments which share similar patterns
of social beliefs and behaviour of Malaysian consumers. Once these market segments were identified, appropriate marketing strategies
and policies were developed by the interested parties to target
potential customers.
METHODOLOGY
Psychographic research involves two phases: the first phase includes determining the appropriate psychographic statements:
the second phase focuses on developing a typology of consumers
(Tam and Tai, 1998). The current study analyzed survey data collected from a nationwide sample of Malaysian consumers.
A cross-sectional design methodology was used over a period of
instrument was designed to cover three thematic areas of lifestyle
which were selected on the basis of research gaps as identified in the literature. A questionnaire for the study was developed in English and later translated into the Malay language by a bilingual associate.
Back translation was also done to check for any inconsistency or
translation errors. To ensure content validity, we used the most popular and valid instrument of VALS with some modifications to suite the multi-cultural society in Malaysia, which consists of a 55-item lifestyle questionnaire. All questions were rated on a four-point modified Likert scale from “1” (strongly disagree) to “4” (strongly agree). No financial or non-financial incentives were offered to the
respondents, but it was stressed that their co-operation would be
appreciated. The preliminary step in instrument design involved a series of focus groups comprising financial providers who assessed the appropriateness of the lifestyle found in Malaysia. In addition,
several questions related to socio-demographics and the economic
statuses of the population were included.
The study reported in this article was part of a study of the lifestyle of Malaysians who invested in the unit trust markets
provided by both government linked companies and private financial institutions. This study was conducted over a period of two months at various locations throughout Malaysia. The respondents were chosen using quota sampling method. The survey was administered
by university students who attended the research methodology class
and yielded a total of 1353 usable responses. This was considered
satisfactory for statistical analysis and was also representative of
the population strata. In addition to information obtained through
the questionnaires, numerous opinions, personal experiences, views and recommendations with regards to the future development of the unit trust market and government policies were also received from
the respondents. Although this is not a pioneer study in Malaysia, it
relied on methodologies that are highly and consistently accepted
DESCRIPTION OF THE SEGMENTS ARISING FROM THE STUDY
The total Malaysian population sample (n = 1453) was divided into two groups, the investors and non-investors of unit trust. Each group was rather evenly divided by gender. The investors group comprised 51.7 percent male and 47.8 percent female whereas the non-investor group consisted of 52.2 percent male and 47.1 percent female. Both groups had a high percentage of married respondents, 69.0 percent and 60.0 percent for investors and non-investors respectively. The majority of both investors and non-investors were Malays (62.9 percent and 52.8 percent, respectively). The majority of investors and non-investors with children was 67.2 percent and 57.8 percent respectively. A large number of respondents in both groups had an annual income below RM40,000 (67.7 percent and 82.9 percent respectively). The majority of respondents in the investors group
had a university level education while the majority of respondents in
the non-investors group had a school level education. Thus, it is not
surprising that many respondents in the investors group will invest
for the future (93.7 percent) compared to respondents in the non-investors group (31.4 percent).
Investors (%)(n
= 859) Non-invest= 491) ors (%)( n
Gender (male, female) 51.7, 47.8 52.2, 47.1
Marital status (Married) 69.0 60.0
Race (Malay) 62.9 52.8
Children (no, yes) 32.8, 67.2 42.2, 57.8
Age (<45, >46) 67.9, 32.1 68.3, 31.7
Annual income (<40k,
>40k) 67.7, 32.3 82.9, 17.1
Education (school,
university) 45.3, 54.7 56.9, 43.1
Future investment (yes,
Table 2 Descriptive summary of investors and non-investors
Exploratory factor analysis was conducted to identify
common underlying dimensions. Factor analysis refers to a class
of statistical techniques whose purpose usually consists of data
reduction and summarization. Principal components analysis was applied to the data set to extract from the series of 35 lifestyle
variables, a set of factors capable of capturing the main features of
the responses. Prior to the extraction of factors the Bartlett test of sphericity and the KMO measure of sampling adequacy confirmed that there was sufficient correlation among the variables to warrant the application of factor analysis (KMO = 0.870, explained variance = 0.575). In order to simplify the factor pattern a VARIMAX rotation was conducted. Eigen-values greater than 1.0 were used as a cut-off criteria to identify nine factors as shown in Table 3.
From Table 3, principal components analysis revealed nine factors with eigen-values of 1.0 or more, accounting for 57.5 percent of cumulative variance. In general, a factor analysis accounting for 60-70 percent or more of the total variance is considered a good fit to the data (Boyd et al., 1989 in Minhas and Jacobs, 1996).
Common factor Factor
loading eigenvalue Percent variance Cronbach’s alpha
I like to dress in the
latest fashions 0.840 I follow the latest
trends and fashions 0.790 I dress more
fashionably than most people
0.785
I want to be considered fashionable
0.777
I must admit that I like
I like the challenge of doing something
1 have never done
before
0.738
I am always looking
for thrills 0.685
I like doing things that are new and different 0.683 I like to try new things 0.572
I like to learn about things even if they may never be of any use to me
0.417 2.962 8.46 0.758
I like being in charge
of a group 0.716
I like to lead others 0.705
I have more ability
than most people 0.650 I consider myself an
intellectual 0.576 2.145 6.12 0.761
I would rather make
something than buy it 0.745 I like making things
with my hands 0.734 I love to make things I
can use everyday 0.643 1.914 5.47 0.656 I am often interested
in knowledge 0.676 I like a lot of variety
in my life 0.561
I like outrageous
people and things 0.556 I would like to
understand more about how the universe works
0.432
I like to learn art,
culture and history 0.423 1.479 4.23 0.622 The government
should encourage students to do prayers in public school
0.763
A women’s life is fulfilled only if she
can provide a happy home for her family
0.512
There is too much sex and violence screens on TV today
0.528 1.361 3.89 0.577
I like a lot of
excitement in my life 0.765 I often crave
excitement 0.753
I would like to spend time for a year or more in a foreign country
0.509 1.171 3.35 0.685
Table 3 : Pattern matrix for the items measuring dimensions of lifestyle
I am very interested in how mechanical things, such as engine works
0.806
I like to look through hardware or automobile stores
0.807
I like to make things of wood, metal, or other such material
0.561 1.114 3.18 0.665
I am really interested in only a few things 0.802 I must admit that
my interests are somewhat narrow and limited
I like my life to be pretty much the same from week to week
0.404 1.05 2.99 0.240
Factor 1 has heavy loadings for five variables that had to do with the importance of fashion. Aspects of the latest fashion trends, fashionable styles and like to show off all load heavily in this factor. We have called this the “modern believers”. We believe that these components may represent the “core” dimensions of the Malaysian population. Factor 2 centres on five variables all mainly related to adventurous spirit of lifestyle. One striking characteristic is that
these people like to attempt new and exciting challenges to feel
self-fulfilment. We have called this the “aventayle”.
Factor 3 exhibits heavy loadings for five variables pertaining to the leadership aspect. Customers scoring high on this factor
would tend to hold favourable views in respect to issues with other
people. We have called them the “contemporary leaders”. Factor 4 is characterized by three variables relating to creativity and risk taking.
It would therefore appear that those individuals scoring highly in this factor, place a great deal of emphasis on the tangible aspects of
practicality or functionality. The factor has been labelled “sufficient makers”. Factor 5 is characterized by five variables relating to knowledge. We call them the “knowledge thinkers”. Factor 6
included four percent of respondents who indicated concern about
social environment and hold certain traditional and religious values. They have been termed the “confident conservatives”. Only three variables were correlated with factor 7. Since all the variables were
related to excitement, it seemed appropriate to label respondents
who score high on this factor as “excitement seekers”. Factor 8
emphasised the importance of three variables related to technical
high importance on the sophisticated and practicality. They have therefore been labelled as “disciplined innovators”. Factor 9 shows the uncertain and insecure behaviour of individualistic customers. We call them “solo sustainers”.
Table 4 Differences between investors and non-investors Factors Investors
Mean InvestorsSD investors Non-Mean
Non-investors
SD
t-value Sig.
Modern
believers 2.43 0.58 2.42 0.62 0.456 0.648
Aventayle 2.86 0.50 2.88 0.50 -0.647 0.518
Contemporary
leaders 2.75 0.55 2.67 0.56 2.797 0.005**
Sufficient
Makers 2.83 0.58 2.89 0.56 -1.581 0.114
Knowledge
Thinkers 2.98 0.45 2.97 0.48 0.424 0.672
Confident
Conservatives 3.37 0.47 3.25 0.49 4.573 0.000 **
Excitement
Seekers 2.55 0.63 2.58 0.63 -1.025 0.306
Disciplined
Innovators 2.42 0.65 2.47 0.68 -1.521 0.128
Solo
sustainers 2.34 0.55 2.41 0.57 -2.204 0.028*
Note: * p <0.05, ** p <0.01
Interestingly, for the plethora of factors that were compared between the investor and non-investor groups, six factors yielded
non-significant differences and three factors yielded significant
differences, two belong to the investors and one to the non-investors
(see Table 4). To understand the underlying relationship between the
product moment correlation coefficients were computed. The results are shown in Table 5. Analysis of the results reveals that solo sustainers was the only factor that was not statistically significant with health lifestyle score. In other words, the solo sustainers will not consider health factor as the main concern in their life.
Table 5: Correlation between psychographic segmentation and healthy lifestyle
Segmentations Healthy lifestyle score
Modern believers 0.197*
Aventayle 0.361*
Contemporary leaders 0.399*
Sufficient Makers 0.229*
Knowledge Thinkers 0.393*
Confident Conservatives 0.304*
Excitement Seekers 0.229*
Disciplined Innovators 0.160*
Solo sustainers -0.44
Note: * p < 0.01
Variable Investors
Mean SD Non-investors Mean
SD t-value Sig
Financial
insufficiency 2.21 0.769 2.39 0.870 -3.656 0.000*
Keep track 2.77 0.713 2.65 0.772 2.723 0.007* Consulted
third party 2.62 0.762 2.54 0.854 1.753 0.080 Special effort 2.65 0.744 2.57 0.794 1.821 0.069
Attended
Table 6: Differences between investors and non-investors
Switched
products 2.86 0.717 2.66 0.832 4.578 0.000*
Investment
transactions 2.62 0.721 2.48 0.815 3.210 0.001*
Prefer GLCs 3.00 0.712 2.59 0.836 9.211 0.000*
Subscribe
publications 2.28 0.743 2.25 0.790 0.612 0.541 Read
investment column
2.70 0.795 2.62 0.815 1.677 0.094
Note: * p<0.01
The results show that there is a significant difference
between investors and non-investors and their investment behaviour
(refer Table 6). There wasa significant difference between the two groups in financial insufficiency, keeping track of investment issues,
switching products for better long term returns, making a number of investment transactions in a year, and mostly preferring to invest in
government linked companies.
CONCLUSIONS
The present study should be considered exploratory and the findings
showed that several lifestyle dimensions exist among the Malaysian
population which have an influence on their buying behaviour. The strong dependency relationship between customers’ behaviour and lifestyle, as defined in this study using AIO approach, isalso evident
and solo sustainers provide a general idea of lifestyle dimensions
of each segment. It is clear from the results of this study that there are opportunities for the Malaysian financial sector to employ lifestyle segmentation as the basis for a priori segmentation. A few
dimensions found in Western nations such as fashion and leadership
also exist as major lifestyle dimensions in the Malaysian lifestyle. By studying customer segmentation, findings of this study provided
the cue for developing new products, product features, prices, channels, messages, and other marketing-mix elements and lifestyle segmentation which were by no means universal and unique to only
the Malaysian environment and society. However, the current study had certain limitations which should be noted. The generalizability of
the results is limited since the sample of the study is not representative
of the Malaysian population. Methodological problems also occurred
as the survey was too long because of the variety of questions and
the type of measurement used. The Malaysian population seemed to stop and think hard when rating every item and this led to delays. The length and difficulty in understanding the questions, led to the spoiling of many questionnaires, especially those filled by senior citizens or rural folks and thus, the data can be considered as biased. After the pilot test, the scale was modified into four-points and this modification reduced some of the methodological problems during data collection.
Furthermore, significant correlations were found between
lifestyle dimensions of the Malaysian population and their health
concerns. All lifestyle dimensions positively correlated with the healthy lifestyle scores except for the solo sustainers. In other
words, the Malaysian population who are uncertain and the insecure behaviour of individuals who are not health conscious and are
not aware of their eating habits. This information has significant
implications for the marketers who currently operate in the Malaysian market, or are planning to enter into the development and promotion
of new products for Malaysian customers.
on the results obtained in this study. Thus, future research will need
to extend this vision by considering or including more psychographic variables other than values and lifestyles or replicated using a more
representative sample.
REFERENCES
Bone, P. F, 1991. “Identifying mature segments”, The Journal of Service Marketing, Vol. 5(Winter), pp.47-60.
Bojanic, D.C., 2007, “Customer profile of the “carryout” segment
for restaurants”, International Journal of Contemporary Hospitality Management, Vol.19 No.1, pp. 21-31
Chin, F. L, 2002. “Segmenting customer brand preference: demographic or psychographic”, Journal of Product & Brand Management, Vol.11 No.4, pp. 249-268.
Engel, J.F.; Blackwell, R.D. and Miniard, P.W. 1996, “Customer
Behaviour”, 7th ed., The Dryden Press, Hinsdale, IL.
Divine, R. L. and Lepisto, L., 2005. “Analysis of the healthy lifestyle consumer”, Journal of Consumer Marketing, Vol. 22 No. 5, pp. 275-283.
Fraj, E. and Martinez, E., 2006. “Environmental values and
lifestyles as determining factors of ecological consumer
behaviour: an empirical analysis, Journal of Consumer Marketing, Vol. 23 No.3, pp. 133-144.
Gonzalez, A.N. and Bello, L.,2002. “The construct “lifestyle” in market segmentation:The behaviour of tourist consumers”, European Journal of Marketing, Vol. 36 No.1/2, pp.51-85. Kesic, T. and Piri-Rajh, S., 2003. “Market segmentation on the
basis of food-related lifestyles of Croatian families”, British Food Journal, Vol.105 No.3, pp.162-174.
Kotler, P. and Armstrong, G., 2007. Principles of Marketing, 11th
Kucukemiroglu, O.,1999. “Market segmentation by using consumer lifestyle dimensions and ethnocentrism: An empirical study”, European Journal of Marketing, Vol. 33 No. 5/6, pp.470-487. Minhas, R.S. and Jacobs, E. M.,1996. “Benefit segmentation by
factor analysis: an improved method of targeting customers for financial services”, International Journal of Bank Marketing, Vol. 14 No.3, pp.3-13.
Oates, B; Shufeldt, L. and Vaught, B.,1996. “A psychographic study of the elderly and retail store attributes”, Journal of Consumer Marketing, Vol. 13 No.6, pp.14-27.
Orth, U. R.; McDaniel, M.; Shellhammer, T. and Lopetcharat, K, 2004. “Promoting brand benefits: the role of consumer psychographics and lifestyle”, Journal of Consumer Marketing, Vol.21, No.3, pp.97-108.
Quinn, L; Hines, T. and Bennison, D., 2007. “Making sense of market segmentation: a fashion retailing case”, European Journal of Marketing, Vol. 41 No.5/6, pp.439-465.
Reisenwitz, T. and Iyer, R.,2007. “A comparison of younger and older baby boomers: investigating the viability of cohort segmentation”, Journal of Consumer Marketing, Vol. 24 No.4, pp. 202-213.
Segal, M.N. and Giacobbe, R. W., 1994. “Market Segmentation and
competitive analysis for supermarket retailing”, International
Journal of Retail & Distribution Management, Vol.22 No.1, pp. 38-48.
Solomon, M.R.; Marshall, G.W. and Stuart, E. W., 2008. Marketing: real people, real choices, 5th ed., Prentice Hall International,
Englewood Cliffs, NJ.
SRI Consulting 1997. Investor Styles: A Psychographic Segmentation, Consumer Financial Decisions, pp. 1-3.
Todd, S.; Lawson, R. and Faris, F.,1997. “A Lifestyle Analysis of New Zealand Consumers”, Asia Pacific Journal of Marketing and Logistics, pp.30-47.