SIMULATION OF PORNOGRAPHY WEB SITES (PWS)
CLASSIFICATION USING PRINCIPAL COMPONENT ANALYSIS
WITH NEURAL NETWORK
ZHI-SAM LEE
1, MOHD AIZAINI BIN MAAROF
2, ALI SELAMAT
3, SITI MARIYAM
SHAMSUDDIN
4Faculty of Computer Science and Information Systems, Universiti Teknologi Malaysia,
81300 Skudai, Johor, Malaysia.
Email: [email protected],[email protected], [email protected], [email protected]
ABSTRACT
The explosive growth of objectionable web content such as pornography, terrorist and violence had been a serious threat for internet users especially children. Recently content analysis based filtering is being introduced to overcome this problem. In term of the promising result to satisfy the result of web content analysis, features extraction techniques play an important role to extract appropriate features from large volume of web information such as text, image, audio, video etc. In this paper we propose a model of pornography web site classification which mainly based on textual content-based analysis such as indicative keywords detection. This paper will show that implementation of principal component analysis in back-propagate neural network is capable to classify high similarity illicit web content sufficiently. In this study, we introduce three techniques to implement our Pornography Web Site Classification Model (PWSCM) such as PWSCM with principal component analysis (PWSCM-PCA), PWSCM with only CPBF (PWSCM-CPBF) and PWSCM with integration of CPBF and PCA (PWSCM-CPBF-PCA). We compare the performance of these three techniques by conducting several simulation experiments. From the experiment results, we have found that the proposed model with three different techniques capable to perform efficient identification for illicit web content. Hence this paper will discuss the simulation results of the model with three techniques.
Keywords – artificial neural network, pornography web sites classification, principal component analysis, textual content analysis.
1.0 INTRODUCTION
In the recent years, we have witnessed an impressive growth of on-line information and resources. There are estimated 1 billion pages accessible on the web with 1.5 million pages being added daily [John M. Pierre, 2000].
The ease of making information available on the Web allows some publishers make offensive, harmful or even illegal contents present in Web sites across the world. Along with the explosive growth of internet, proliferation of objectionable web content such as pornography, terrorist and violence have been a serious threat for Internet users especially children. As more information become available, it becomes increasingly difficult to distinguish between useful and harmful web content. This fact makes the use of filtering and monitoring systems a necessity in educational environments and in the work place to protect children and prevent Internet abuse. In order to protect users from possible ‘harmful’ content, an efficient tool for classifying and filtering the objectionable web content is highly desired.
analysis for detecting US domestic extremist groups on the web [Y. Zhou et al., 2005], Hwanjo et al. introduce web pages classification without negative example[H. Yu et al., 2004], Hisham Al-Mubaid and Syed A. Umair propose a text categorization technique using distributional clustering and learning logic [H.Al-Mubaid and S.A.Umair, 2006].
Ordinary pornography web sites (PWS) are constructed by mixing textual hyperlinked content with visual content. In other words, PWS could be a quite representative instance of general web site categorization and classification problem. As a result, the intelligent content-based analysis for PWS classification is highly relying on machine learning process especially with supervised learning. For instance, Lee et al.[P.Y.Lee. et al., 2002] use Kohonen’s Self-Organizing Maps (KSOM) and Fuzzy Adaptive Resonance Theory (Fuzzy ART) for their online pornography document classification. Mohamed et al. [M.Hammami et al., 2006] show a machine learning-based system for PWS classification by combining textual and structural content-based analysis, and Selamat et al.[A. Selamat and S. Omatu, 2004] proposed Web Page Classification Model (WPCM) to classify Japanese web sport news. Selamat et. al.[A. Selamat and C.C. Ng, 2008] use Fuzzy ART for Arabic script documents language identification and N. Churchanroenkrug et al. [N. Churchanroenkrug et al., 2005] filter the illicit web pages with Multiple Classification Ripple-Down Rules (MCRDR) technique which similar to rules based approach.
The fundamental challenges in machine learning are the extraction of features to best represent original content and the design of discriminating feature vectors which relies on our priori knowledge for classification problem. The lesser features being extracted, the shorter computation processing time is exhausted. However, these become higher possibility of data being lost at the same time. The same issue is faced during PWS content analysis especially deals with World Wide Web (WWW). In other words, features extraction techniques play an essential role to extract appropriate features from large volume of web information during PWS content analysis.
We design an intelligent pornographic web site classification model which mainly based on textual content-based analysis such as indicative keywords detection. In order to extract features that best represent the original content from large volume of information, we employ principal component analysis (PCA) as feature extraction and reduction technique. In this model, we implement a supervised learning technique, namely artificial neural network (ANN) for PWS classification purpose. Throughout this paper, we will prove that this
model is efficient to distinguish between illicit and healthy web pages. This paper is constructed as follow: section 2 discusses our Pornography Web Site Classification model (PWSCM), section 3 presents about the experiment environment, section 4 would be mainly focus on result discussion and finally section 5 is the conclusion of this paper.
2.0 PORNOGRAPHY WEB SITE
CLASSIFICATION MODEL
The main purpose of Pornography Web Site Classification model (PWSCM) is to classify the pornography and non pornography web page. This model is mainly based on textual content based analysis which extracts textual and symbolic characters from web page as features. This model is constructed by several modules such as web page retrieval process, pre-processing (which consists of stemming, stop-word filtering and term weighting scheme), class profile based feature (CPBF), feature extraction and reduction, and finally web page classification. In this study, we observe the performance of PWSCM with three techniques which are PWSCM with principal component analysis (PWSCM-PCA), PWSCM with only CPBF (PWSCM-CPBF) and PWSCM with integration of CPBF and PCA (PWSCM-CPBF-PCA) as shown in figure 1.
Basically web pages retrieval is a preliminary for all techniques of PWSCM. The web pages are crawl from WWW during web retrieval modules. The web pages go through pre-processing before analysis the web pages. During the pre-processing module, those web pages will go through the stemming and stop-word filtering process to reduce those noise features. The relationship within features and web pages will be built and calculated during term weighting process. In order to find out a better way to analysis the characteristics for web pages, we compare three different techniques which are PCA only, CPBF only and integration of PCA and CBPF. The detail description for each technique will be further carry out in follow sections.
CPBF. The CPBF section will discuss more detail for the procedure of CPBF. Lastly, the output of CPBF or feature vector C will feed to ANN for web pages classification. On the other hand, PWSCM-PCA-CPBF would be the integration of PCA and CPBF. Basically the process is similar with PCA and PWSCM-CPBF, the different is just the web pages will go through two process which CPBF and PCA. The output for CPBF will be treated as reference for PCA to perform feature extraction and reduction. The main purpose for PCA in this model is to extract and reduce the original data vectors in CPBF into small numbers of relevant features. Finally the output vector of PCA will be treated as the input for ANN classification as shown in Figure 1.
2.1 Pre-processing of Web Pages
Web page retrieval is a process to retrieve collections of web documents to database from online internet with the help of web crawler. Those retrieved web pages will be stored in local database for further process. Stop-list is a dictionary that contains the most common and frequent words such as ‘I’, ‘You’, ‘and’ and etc. Stopping on stop-word is a process that filters those common stop-words that exist in web document by using stop-list. Stemming plays an important role to reduce the occurrence frequency of a term which is similar meaning in the same document. It is a process of extract each word from a web document by reducing it to a possible root word. For example, ‘beauty’
and ‘beautiful’ have the similar meanings. As a result, the stemming algorithm will stem it to its root word ‘beauty’ After stopping and stemming process, those documents will go through term weighting scheme where the relationship within term features and documents will be constructed and calculated. The data will be represented as the term frequency (TF) matrix corresponding to each document using vector space model (VSM) approach.[G.Salton et al., 1975] where Docj x TFjk during this process.
2.2 Class Profile Based Feature
Class profile-based feature (CPBF) is a process that identifies those most regular words in each class or category [A. Selamat and S. Omatu, 2004]. We will manually select certain number of specific terms from each category of web pages as features. After these key features being selected, we will calculates the weights of the words by implementing term frequency inverse document frequency (TFIDF) technique. The calculation of the terms weight xjk of each word wk will be done using a technique which introduced by Salton and McGill [G.G.Chowdhury, 1999] as the following equation
xjk = TFjk x idfk (1) For PWSCM-CPBF, the outcome of CPBF will be treat as input of ANN without go through the process of PCA.
2.3 Feature Extraction and Reduction with PCA
In this model, principal component analysis (PCA) will be performed in pre-processing section as input for neural network. The dimension reduction process that implements PCA will reduce the original data vectors into small numbers of relevant features.
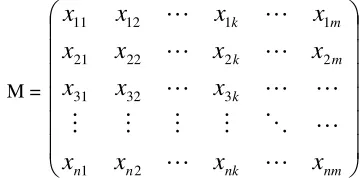
Lets M is a matrix document-terms weight as below: For PWSCM-PCA, we assign the term frequency matrix after pre-processing as M. However for PWSCM-CPBF-PCA, the output of CPBF would be assign as M.
M =
nm nk
n n
k
m k
m k
x
x
x
x
x
x
x
x
x
x
x
x
x
x
x
L
L
L
O
M
M
M
M
L
L
L
L
L
L
L
2 1
3 32
31
2 2
22 21
1 1
12 11
The definition of x, j, k, m and n has been explained in table 1. The mean of m variables in data matrix M will be calculated by
Web Page Retrieval
Preprocessing
CPBF
Principal Component
Analysis
Neural Network Web Pages
Text Documents
Feature Vector C
Feature Vector P Web Page
Retrieval
Preprocessing
CPBF
Neural Network Web Pages
Text Documents
Feature Vector C Web Page
Retrieval
Preprocessing
Principal Component
Analysis
Neural Network Web Pages
Text Documents
Feature Vector P
PWSCM-PCA
PWSCM-CPBF
PWSCM-CPBF-PCA
FIGURE 1: Pornography Web Site Classification Model (PWSCM) with three different techniques which are
TABLE 1: Explanation of index for calculation based on term frequency inverse document frequency
Index Explanation
j Variable, j= 1,2,…,n
k Variable, k=1,2,…,m
xjk Terms weight
Docj Each web page document that exists in local database
TFjk Number of how many times the distinct word wn occurs
in document Docj
dfk Total number of documents in the database that contains
the word wk
idfk Equal to log (n/dfk) where n is the total number of
documents in database
∑ =
=
n
j jk
k x
n x
1 1
(2)
After that the covariance matrix, C={cjk} is calculated. The variance c2k is given by
(
)
21
2
1
∑
=
−
=
n
j
k jk
x
x
n
c
k (3)The covariance is given by
(
x
x
)
(
x
x
)
j
k
n
c
ik kn
i
j ji
jk
=
∑
−
−
≠
=
,
1
1
(4) where j=1,2,3,…,n and k =1,2,..,m. An eigenvalue λ and eigenvector e can be found by Ce = λe where C is covariance matrix. If C is an m x m matrix of full rank, m eigenvalues and all corresponding eigenvectors can be found by using
(
C−λiI)
ei =0 (5)We will sort the eigenvalues and eigenvectors so that λ1≥ λ2≥ …≥ λm. A square matrix E be constructed from the eigenvector columns where E=[ e1 e2 … em]. Let matrix B denote as
B=
m λ λ
λ
0 0 0
0 0
0 0
2 1
L O M M
L L
(6)
We will perform eigenvalue decomposition to get the principal component of matrix C by using
ETCE = B (7)
After that, we will select the first p≤m eigenvectors where p is the desired value such as 10, 20, etc. The set of principal components is represented as Z1=e1Tc, Z2=e2Tc, …, Zp=epTc. An n x p matrix R is represented as
R=
np n
n
p p
r r
r
r r
r
r r
r
L L O M M
L L
2 1
2 22
21
1 12
11
(8)
where rij is a reduced feature vectors from the n x m original data size to n x p size.
As mentioned previously, for PWSCM-PCA, the outcome of PCA will directly feed to ANN for classification purpose.
2.4 Integration of CPBF with PCA
Integration of CPBF with PCA is a technique that use for PWSCM-CPBF-PCA. In this process, we will use CPBF to identify those most regular terms and weight them using the TFIDF. Each category of term features will be saved in different class profiles. These profiles will then be treated as reference for PCA to perform feature extraction and reduction. The procedure for integration of CPBF and PCA here is similar with CPBF and PCA modules, the only thing that make the different is just sequence where will perform CPBF before the PCA. Finally the outcome of PCA will feed to ANN as input features.
2.5 Artificial Neural Network as Classifier
For PWSCM-CPBF, the outcome of CPBF will be the input for ANN. However for PWSCM-PCA and PWSCM-CBPF-PCA, the output of feature vectors for PCA will be treated as the input for classifier. In this
N
A
M
A
L
A
LM
W
MN
W
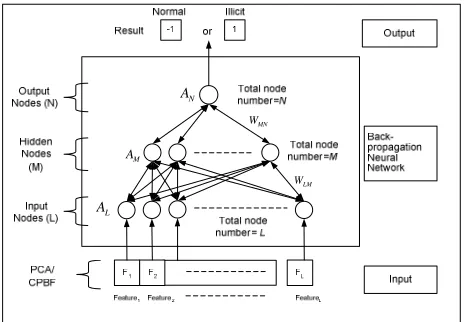
model the artificial feed forward-back propagation neural network (ANN) is adopted as the classifiers. For classifying a test document (dj), their term weights after PCA (matrix R) are load into the input units. The activation of these units will propagate forward through the network, and finally the value of the output unit(s) determines the categorization decision(s). The back propagation neural network is used due to if a misclassification occurs the error is “back propagated” so as to change the parameters of the network and minimize or eliminate the error.
The concept for implementation of back propagation neural network is illustrated in figure 2. Basically we design the neural network with three main layers which are input (L), hidden (M) and output (N) layer. The total number nodes that exist in input layer will be same as total number of input features which is either from CPBF or PCA. Besides, the total number of nodes that in hidden layer is the half of total number nodes in input layer. It can also be represented as M=L/2. Since that we only focus on binary classification where determine only either the web pages content illicit or healthy information, so only one node is need in output layer.
3.0 EXPERIMENTS ENVIROMENT
3.1 Data Sets
We collect 1092 web pages which are reviewed to make standard classification. The web pages are divided to two kind of dataset which are small class dataset (data set 1) and normal class dataset (data set 2) as shown in table 2. To simplify the experiment, this study will classify the web pages to only two categories which are pornography and non-pornography. The pornography web pages are referring to those adult web pages which display the sexual activity. On the other hand, the non-pornography web pages in this experiment are referring to those web pages which display helpful and informative contents dataset that being used for non-pornography category is consists of medical sex, sex education and business news web pages.
Table 2 summarizes the data. As to the content of pornography, medical sex and sex education web pages always having high similarity within each other, hence this experiment use the mix of medical sex and sex education web pages as non-pornography category. The purpose to do so is to test the ability of PWSCM whether it is able to perform extensive classification or not. The model is evaluated from two aspects. The first aspect is observe the performance of PWSCM during the situation that only to differential pornography and sex education web content under small class dataset (data set 1). The another aspect is observe the performance of PWSCM
TABLE 2: Web pages dataset
Category Data set 1 Data set 2
Pornography 40 305
Non pornography
(medical sex + sex education)
30 417
Non pornography (Business news )
0 300
Total 70 1022
under the situation of similar to the real world where the data consist of pornography, sex education and neutral web pages such as business news web pages. In this study, we would test the PWSCM-PCA and PWSCM CPBF only with data set 2 whereas PWSCM-CPBF-PCA will test with data set 2 and 1. The pattern for both data sets corresponding to the term features will be discuss at further section.
3.2 Data Sets Pattern
We have done a simple analysis to the dataset in order to identify the pattern of both pornography and non-pornography web pages. The analysis result is obtained
0 50 100 150 200 250 300 350 400
0 5 10 15 20 25 30
Term Feature Index
T
e
rm
F
re
q
u
e
n
c
y
Total Porn Total Non-Porn
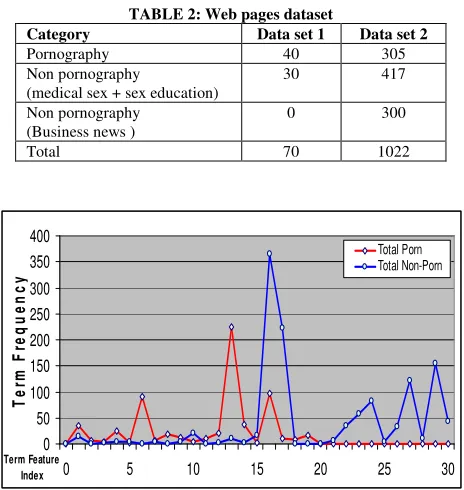
FIGURE 3: The Term Frequency Pattern for Pornography and Non-Pornography Web Pages Corresponding to Data Set 1.
0 500 1000 1500 2000 2500 3000 3500 4000 4500 5000
0 10 20 30 40 50 60 70 80 90 100
Term Features Index
T
e
rm
F
re
q
u
e
n
c
y
Porn Sex Education Bussiness
corresponding to data set 1 and 2 which summarized in table 2. In both data sets, we noticed that pornography web pages clearly having a different pattern compare to non-pornography web pages which are illustrated in figure 3 and 4. In order to give a clear picture to the readers, we recorded the top five terms occurrences for each pattern corresponding to data set 1 and 2. in table 3 and 4. Based upon table 3 and 4, we found that they showing a similar characteristic in both tables. The term features for pornography web pages is more toward to sexual activity terms such as ‘porn’, ‘fuck’, ‘cock’, ‘teen’, etc. On the other hand, the non-pornography pattern is more related to medical terms such as ‘medical’, ‘health’, ‘school, etc. Besides, if we observe the business news pattern (to represent the neutral web pages pattern) in figure 4, we found that the term occurrence corresponding to 100 selected term features is extremely low. This do provide a very significant information neutral web pages (the web pages that not belonging to either pornography or sex education category) are not active corresponding to these features. Hence it form another pattern where would make the classification process become easier.
The term pattern analysis is very helpful since it could be used as a guideline to identify good features for further analysis process. In this study, we only present the result of techniques PWSCM-CPBF and PWSCM-PCA based on data set 2. However we will present the analysis result of PWSCM-CPBF-PCA based on both data set 1 and 2. This is due to PWSCM-CPBF and PWSCM-PCA do not give much significant different within both data sets but PWSCM-CPBF-PCA do show some significant different within data set 1 and 2.
3.3 Principal Component Analysis
For PWSCM-PCA, we select 100 features from term-frequency matrix after the pre-processing. The selection of the features is simply based top 100 words that achieve the highest term frequency after the term pattern analysis. The 100 features will form a term-document matrix and go through PCA for feature reduction process. For PWSCM-CPBF-PCA, we select 100 features from term frequency matrix for data set 2 and 30 features from term frequency matrix for data set 1. Different with PWSCM-PCA, these features will go through CPBF process before send to PCA which had explained in integration of CPBF with PCA section. After CPBF, both 30 and 100 features will also form a term-document frequency matrix respectively.
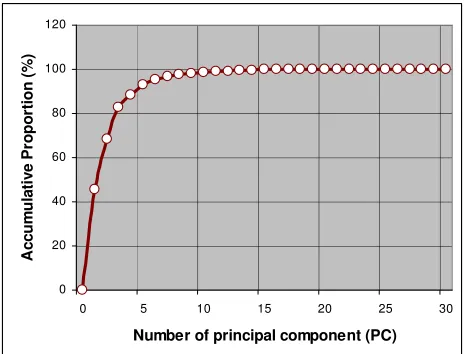
Before the process of PCA, the document-term frequency matrix needs to perform eigenvalue decomposition in order to get the principal component matrix. Figure 5 and 6 illustrates the eigenvalues propotion during eigenvalue
decomposition for 30 and 100 eigenvalue index respectively. We sort the eigenvalues and eigenvectors so that λ1≥ λ2≥ …≥ λm and represent each column of the eigenvectors as eigenvalue index. The higher values of eigenvalue for each eigenvector (eigenvalue index), the greater proportion of data it extract is. In other word, the higher value of eigenvalue represents the more significance of eigenvector. We select the first p≤m eigenvectors where p is the desired value such as 5,10, 15,20,etc until m is the maximum number of eigenvector. In this study, the maximum number of eigenvectors that corresponding to data set 1 is 30, so the value of m is 30. It is similar to data set 2, the maximum number of eigenvectors is 100, so the value of m is 100. The set of principal components is represented as Z1, Z2, …, Zp, which discussed in section feature extraction and reduction with PCA. The value of p will determine the size of reduced feature vectors which is matrix R. In
0 20 40 60 80 100 120
0 5 10 15 20 25 30
Number of principal component (PC)
A
c
c
u
m
u
la
ti
v
e
P
ro
p
o
rt
io
n
(
%
)
FIGURE 5: Accumulate Proportion Versus Number of Principal Component(s) Corresponding to Data Set 1.
0 20 40 60 80 100 120
0 10 20 30 40 50 60 70 80 90 100
Number of principal component (PC)
A
c
c
u
m
u
la
ti
v
e
P
ro
p
o
rt
io
n
(
%
)
TABLE 3: The top five term occurrences for pornography and non-pornography pattern corresponding to data set 1.
Pornography Non-Pornography
Occurrence s
Term Occurrences Term
1 224 porn 364 sex
2 97 sex 222 sexual
3 91 fuck 154 medical
4 38 pornography 122 health
5 35 adult 83 education
TABLE 4: The top five term occurrences for pornography and non-pornography pattern corresponding to data set 2.
Pornography Non-Pornography
Occurrence s
Term Occurrences Term
1 17204 teen 5316 sex
2 10399 gallery 3577 education
3 6750 movie 2661 sexual
4 2645 sex 2565 school
5 4706 picture 1975 health
other word, value p also represents the number of principal component (PC). Figure 5 and 6 also indicate the accumulate proportion of data versus the number of principal component being selected. The more PCs are selected, the higher proportion of data being extracted.
3.4 Back Propagation Neural Network
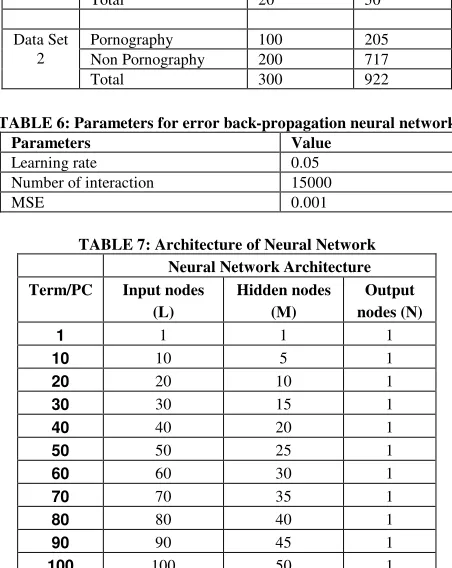
In order to do the classification, we implement a back-propagation neural network (BP-ANN) as our classifier. We use a set of documents as shown in table 5 and specification of the network which had been summarized in table 6. The ANN network parameters are obtained based on trial-and-error approach. Firstly we initialize both learning rate and Mean-Square-Error (MSE) to 0.01. According to Teuvo Kohonen (Teuvo Kohonen,1995, 1997, 2001), the network would only achieve better statistical accuracy if the number of iterations is 500 larger than the number of output neuron. Our ANN network having one neuron as its output, thus we pre-define the maximum number of iteration in ANN training algorithm as 500 iterations. The network parameters are iterated in a preset number (500) for the first time and the network results are checked against with expected result. This procedure is repeated with adjusted parameters until it is capable to achieve satisfactory results as expected.
Based on observation, we found that the network will obtain optimum result if given parameters’ values as shown in table 6. In addition, the experiment is conducted according to the architecture design of neural network as presented in table 7. As mentioned in section 2.5, the total number nodes for input layer will be same as total number of input features which is either from CPBF or PCA. However, the total number of nodes that in hidden layer is the half of total number nodes in input layer.
TABLE 5: Training and testing Set for PWSCM with Neural Network.
Category of Web Pages
Training Documents
Testing Documents Data Set
1
Pornography 10 30
Non Pornography 10 20
Total 20 50
Data Set 2
Pornography 100 205
Non Pornography 200 717
Total 300 922
TABLE 6: Parameters for error back-propagation neural network
Parameters Value
Learning rate 0.05
Number of interaction 15000
MSE 0.001
TABLE 7: Architecture of Neural Network Neural Network Architecture
Term/PC Input nodes
(L)
Hidden nodes (M)
Output nodes (N)
1 1 1 1
10 10 5 1
20 20 10 1
30 30 15 1
40 40 20 1
50 50 25 1
60 60 30 1
70 70 35 1
80 80 40 1
90 90 45 1
100 100 50 1
The training set for neural network is illustrated in table 5. We will examine the performance of PWSCM base on two data sets. For the data set 1, we choose 20 documents as the training set which consists of 10 pornography and 10 non-pornography web pages. Then we select 50 documents as the testing set which consists of 30 pornography and 20 non-pornography web pages. Meanwhile, we choose 300 documents as the training set and 922 documents as testing set for data set 2. During training, the connection weights of the neural network are initialized with some random values. The connection weights within input, hidden and output layers are adjusted according to the error back-propagation learning rule. This process is continued until either the predefine threshold for learning interactions is archived or the predefined level of mean squares error (MSE) is reached.
3.5 Experiment Hardware Environment
under the same hardware environment so that the observation and analysis process are fair.
4.0 RESULT AND DISCUSSIONS
In this study, we examine the performance of PWSCM by compare it within three techniques which are
PWSCM-PCA, PWSCM-CPBF and
PWSCM-CPBF_PCA. The PWSCM-PCA and PWSCM-CPBF are tested with data set 2, however PWSCM-CPBF-PCA is tested with both data set 1 and 2. The experiments are conducted under the environment that being explained during experiment environment section. In this section, we will just discuss the experiment result.
Firstly we compare those three PWSCM techniques with data set 2. We evaluate the performance of each technique by benchmark their classification accuracy rate corresponding to the number of input features that being fed into neural network. For instance, we select 1, 10, 20 until 100 term features as milestone to run the simulation for PWSCM-CBPF technique. We run 10 independent simulations for each milestone and take the average of them as the final result for that particular milestone. This process is repeated until we complete to benchmark every milestone. The similar procedure is repeated for PWSCM-PCA and PWSCM-CPBF-PCA. The only different with PWSCM-CPBF is PWSCM-PCA and PWSCM-CPBF-PCA are using principal component (PC) as their milestones but not term features. For PWSCM-PCA and PWSCM-CPBF-PCA, we use features (Z1, Z2, …, Zp) that selected by PCA as input for neural network to do classification. In other word, the parameter that mainly affects the classification result of the simulation in this experiment is the number of principal component. The simulation result for PWSCM-PCA, PWSCM-CPBF and PWSCM-CPBF-PCA are illustrated in figure 7 and table 9.
Based upon figure 7, we found that for all three techniques of PWSCM, the milestone as 1 PC and term features achieve the lowest accuracy rate however the performance increase dramatically during second milestone (10PCs or terms) and reach a stable stage after fourth milestone where it is 40PCs or terms. This is due to when the first milestone, it contains a very minimum information, so neural network not able to learn well by only one feature is provided. However the performance increases dramatically when more complete information are provided to the neural network during second milestone. For PWSCM-PCA and PWSCM-CPBF-PCA, the second milestone with 10PCs is nearly equivalent to 95% of the original information which illustrated in figure 5. Meanwhile, for PWSCM-CPBF, even with 10 term features, it is capable to provide neural network a better performance. Due to neural network is able to learn more complete by providing more information, so it improve the classification performance.
TABLE 8: Hardware specification that used for experiment setup
No Hardware Specification
1 Processor Intel Centrino Dual Core
1.66Ghz
2 Memory (SDRAM 667Mhz) DDRII 2GB
3 Operating System MS Windows XP2
TABLE 9: Comparison result for three techniques of PWSCM using data set 2
Accuracy rate (%) Term
/PCs
PWSCM-CPBF
PWSCM-CPBF-PCA
PWSCM-PCA
1 61.498 40.03 44.63
10 86.814 86.26 80.183
20 92.23 90.122 85.3
30 93.676 96.676 92.983
40 96.09 97.47 94.05
50 96.676 97.784 93.845
60 94.875 97.091 94.645
70 95.23 96.814 94.507
80 94.875 96.676 94.645
90 95.875 97.091 94.983
100 96.953 96.537 94.845
Performance Comparison for Different Feature Extraction Techniques in PWSCM
40 50 60 70 80 90 100
1 10 20 30 40 50 60 70 80 90 100
Term(s)/ Principal Component(s)
A
c
c
u
ra
c
y
R
a
te
CPBF
CPBF-PCA
PCA
FIGURE 7: Performance Comparison for Different Feature Extraction Techniques in PWSCM under Data Set 2
70 75 80 85 90 95 100
1 5 10 15 20 25 30
PC(s)
A
c
c
u
ra
c
y
(
%
)
CPBF-PCA
After the fourth milestone (40PCs or terms), the simulation result for all the three PWSCM techniques generally reach a stable stage where PWSCM-PCA is around 93-94%, PWSCM-CPBF-PCA is around 96-97% and PWSCM-CPBF is around 95-96%. From the PCA analysis which shown in figure 6, 40PCs is almost equivalent to 100% of original information. As a result, neural network could learn better by providing complete information and further enhance the classification performance. Due to the information that feed to neural network reach an optimum condition, hence the classification result would maintain the similar classification performance after 40PCs or terms. In general, PWSCM-CPBF-PCA performs better classification result than the PWSCM-CPBF and PWSCM-PCA.
On the other hand, we also evaluate the stability of the classification performance of all three techniques for PWSCM by observing their simulation performance on each milestone. In order to simplify the result presentation in this paper, we only present several most significant milestones which are 1, 20 and 40PC.or term features. The simulation results are shown in figure 11, 12 and 13 corresponding to PCA, PWSCM-CPBF and PWSCM-PWSCM-CPBF-PCA respectively. We found that PWSCM-CPBF achieve the most stable classification performance where averagely only 1-2% of performance difference within each simulation for the same milestone. For instance, CPBF-40 had approximately 1% difference within their classification performance where the best performance is 95.74% and the lowest is 96.87%. Average differential performance for CPBF-PCA is 2% however for PWSCM-PCA is around 3-4%. The lower of the differential value, the more stable it is. Hence, PWSCM-PCA is most unstable among the three techniques.
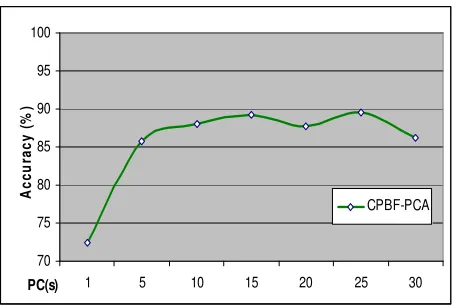
In addition, we also evaluate the performance for PWSCM-CPBF-PCA from the aspect of small class data set by using data set 1. We fixed the number of Principal Component (PC) to several milestones which are 1,5,10,15,20,25 and 30. In order to observe the pattern of accuracy rate, we run 10 independent simulations for each milestone which the results are shown in figure 14. We found that the accuracy pattern of PC whose number is 1, 5 and 10 are less consistent in comparison with the number of PC which higher than 10. This is due to incomplete data being extracted by the PC less than 10. Table 10 and figure 8 indicate the average accuracy rate for each milestone with ANN classification using data set 1 for PWSCM-CPBF-PCA technique.
We found that if the number of PCs was increased, the accuracy rate will also increase respectively. In this experiment, we noticed that the accuracy rate for classification reached the lowest point (which was around 72.4%) when one PC was selected. Based upon figure 5, we know that if one PC is selected, it extract only a small portion of data which is less than 40% of its original information. Hence, most of the information is lost before it is fed to neural network and this causes the classification result less than 80%.
According to the experiment, it is noted that the best number of PCs being selected is 15 or 25 which attain around 89% accuracy rates. However the higher number of PCs is not promising the better accuracy rate. The highest number of PC which is 30 PC was selected for ten test run. The classification accuracy rate for 30 PC was approximately 86.2%. The percentage rate was still lower than 10, 15, 20 and 25 PCs in the result. This shows some of the data is noise. The noise data are mostly extracted by 26th to 30th PC when 30 PCs were selected. They fed to the neural network together with those useful data made the accuracy rate become lower.
Time taken for ANN training algorithm for dataset 2
30 35 40 45 50 55 60 65 70 75
1 10 20 30 40 50 60 70 80 90 100 Term(s)/PC(s)
D
u
ra
ti
o
n
(
s
e
c
o
n
d
s
)
CPBF CPBF-PCA PCA
Time taken for ANN training algorithm for dataset 1
0 10 20 30 40 50 60
1 5 10 15 20 25 30
PC(s)
D
u
ra
ti
o
n
(
s
e
c
o
n
d
s
)
CPBF-PCA
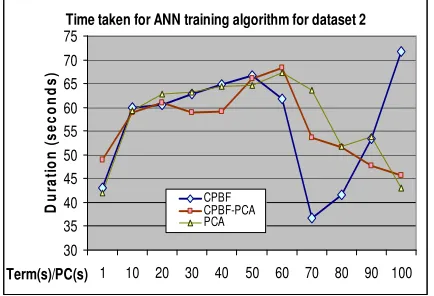
FIGURE 9: Comparison of time duration that taken by neural network training for dataset 2 with CPBF,
CBPF-PCA and CBPF-PCA techniques.
TABLE 10: Accuracy Vs Number of PC in Data Set 1
PC 1 5 10 15 20 25 30
Accuracy (%)
72.4 85.8 88 89.2 87.8 89.6 86.2
In this small class data set (data set 1) experiment, we found that PWSCM-CPBF-PCA performs efficiently which capable attain higher than 85% accuracy rate if more than 4 PCs being selected. However the restriction for it during small class data set is PWSCM-CPBF_PCA perform very unstable which illustrate figure 14. The average differential of it is around 10%.
In order to measure the time performance for those three proposed techniques, we had conducted an experiment to evaluate the time taken by neural network for training dataset 1 and 2 by using the proposed techniques which presented in figure 9 and 10. Based upon figure 9, we found that there having two difference trends of time performance pattern which are pure CPBF pattern and PCA pattern such as CBPF-PCA and PCA. For CPBF pattern, the more terms extract as input nodes, the longer training duration that neural network take for archive convergence. However it is different with PCA pattern
where the more principal component (PC) extract as input nodes, the shorter training duration that neural network takes for archive convergence. The similar pattern also has been identified for small class dataset which is dataset 1 as shown in figure 10. This may mainly due to the information is more complete when more PCs are selected. Hence neural network could archive convergence faster by providing the more complete training information. Meanwhile, based upon figure 9, we also found that PCA pattern averagely is taking shorter duration for neural network training process especially when the PC number is 40 and 100 for both CBPF-PCA and PCA techniques. Thus, implementation of PCA as feature extraction technique is better than the technique that without implement PCA. From the experiment of both data set 1 and 2, we found that PWSCM-CPBF-PCA is capable to classify high similar web content such as pornography and sex education web pages. The classification performance of it is significantly improved when the size of data set increase (from 70 to 1022 web pages). This experiment also indicated that PCA would perform better if the data
30 40 50 60 70 80 90 100
1 2 3 4 5 6 7 8 9 10
Independent Run Time
A
c
c
u
ra
c
y
R
a
te
(%
)
PCA-1 PCA-20 PCA-40
30 40 50 60 70 80 90 100
1 2 3 4 5 6 7 8 9 10
Independent Run Time
A
c
c
u
ra
c
y
R
a
te
(
%
)
CPBF-1 CPBF-20 CPBF-40
30 40 50 60 70 80 90 100
1 2 3 4 5 6 7 8 9 10
Independent Run Time
A
c
c
u
ra
c
y
R
a
te
(
%
)
CPBF-PCA-1 CPBF-PCA-20 CPBF-PCA-40
60 65 70 75 80 85 90 95 100
1 2 3 4 5 6 7 8 9 10
Independent Run Time
A
c
c
u
ra
c
y
(
%
)
1 PC 5 PC 10 PC 15 PC 20 PC 25 PC 30 PC
FIGURE 11: Accuracy Rate Corresponding to 1. PCA-20 and PCA-40 for Ten Independent Simulation Run Time
by Using ANN in Data Set 2
FIGURE 12: Accuracy Rate Corresponding to CPBF-1. CBPF-20 and CBPF-40 for Ten Independent Simulation Run
Time by Using ANN in Data Set 2
FIGURE 14: Accuracy Rate Corresponding to PCA-1, PCA-5 until PCA-30 for Ten Independent Simulation Run Time by
Using ANN in Data Set 1 FIGURE 13: Accuracy Rate Corresponding to CPBF-PCA-1.
is huge enough This may due to PCA could compressed the data more efficiently if the data size is big. This could be proved where the classification performance of PWSCM-CPBF-PCA is more stable in data set 2 compare with data set 1 even though we selected the same number of PCs. For instance, the performance differentiation for 20PCs in data set 1 is around 9% however in data set 2 is approximately 1%. In addition, the neural network also obviously achieves a better performance when the data size is increase. This evidence does show that PWSCM-CPBF-PCA is more flexible where it is not only appropriate for big size data set but also adaptable for small size data set.
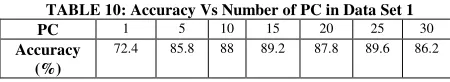
Generally PWSCM-CPBF-PCA achieves the best performance among three techniques of PWSCM. We also compared our PWSCM with ANN [7] and MCRDR [10] model as shown in Table 11. PWSCM performed better than MCRDR and ANN-Fuzzy-ART but just a little bit better than ANN-KSOM. However the dataset for ANN and MCRDR were constructed by general healthy and unhealthy web pages. Due to the general healthy web pages such as sports, politics, news, etc. having lower similarity terms and content, thus it is easier to cluster by classifier. We argue that the unsupervised learning algorithms (KSOM and Fuzzy-ART [P.Y.Lee et al., 2002]) and rules based algorithm [N. Churchanroenkrung et al., 2005] may fail to perform web pages classification efficiently if the data are constructed by high similarity web content (such as pornography and sex education web pages). We overcome this issue by implementing BP-ANN which is based on supervised learning. The BP-ANN is working well with high similarity content but it will require longer processing time if increase the number of input features. We overcome this challenge by using PCA where the major large input information is maintained while tactically reducing the input features. This also enhances the processing time for BP-ANN. We believe that PWSCM is capable to outperform ANN and MCRDR if more general healthy web pages are added as dataset. Unfortunately this argument is hardly to proof since all of the experiments are using different kind dataset and experiment environments.
In order to make a fair analysis, we had conduct another comparison experiment within Kohenen Network (KSOM) [P.Y.Lee et al., 2002] and back propagate neural network (BP-ANN) under PWSCM model by using dataset 2. From the experiment result as shown in Table 12, we found that CPBF-KSOM is not performing as well as BP-CPBF-PCA.where the accuracy rate is around 76%. We identified that the misclassification (where 42% error) of CPBF-KSOM are mostly occur when the input web pages are belong to healthy category (sex education web pages). In other word, most of the healthy (sex education) web pages are label as unhealthy (pornography) category for CPBF-KSOM classification.
TABLE 11: The performance comparison for ANN [P.Y.Lee et al., 2002], MCRDR [N. Churchanroenkrung et al., 2005] and PWSCM
model.
ANN MCRDR PWSCM
Technique KSOM Fuzzy
ART
Rules based
BP-CPBF-PCA (40PCs or above)
Healthy 496 428 146 717
Unhealthy 499 475 137 205
Total 1005 943 283 922
Accuracy 95% 89.1% 82.22% 97%
TABLE 12: Classification performance for KSOM and BP-ANN under PWSCM model.
PWSCM
Technique CPBF-KSOM BP-CPBF-PCA (40PCs
or above)
Healthy 717 717
Unhealthy 205 205
Total 922 922
Accuracy 76% 97%
Hence the argument of “the unsupervised learning algorithms may fail to perform web pages classification efficiently if the data are constructed by high similarity web content” is proofed via this experiment. However we unable to conduct a fair comparison experiment with Fuzzy Art [P.Y.Lee et al., 2002] and MCRDR [N. Churchanroenkrung et al., 2005] approaches since the rules and experiment details are not available from their published documentation. Thus, we conclude that supervise learning algorithm is advantage than unsupervised algorithm in PWSCM condition.
5.0 CONCLUSION AND FUTURE WORK
pornography web pages efficiently even though the data set contains those healthy but similar to pornography content web pages. Among the three technique of PWSCM, the simulation results had shown that PWSCM-CPBF-PCA achieve the best performance. In this study, we also had done a simple comparison within PWSCM and others approach. Theoretically PWSCM perform slightly better, however this argument is hardly to proof since all the approaches are using different kind dataset in different environment. Anyway we hope that this paper would give an insight for researchers about the basic concept of illicit web content filtering.
It is a fact that current web pages are more multimedia rather than just textual content; therefore, the future direction of this work is to move towards to the image and multimedia content-based analysis.
ACKNOWLEDGEMENT
The authors wish to thank the reviewers for their insights and helpful suggestions. Besides, the authors also wish to give a special thanks to Prof. Dr. Setsuo Tsuruta for his comments which greatly improve the quality of this paper. This acknowledgement also goes to Ministry of Science & Technology and Innovation, Malaysia and Universiti Teknologi Malaysia for supporting the research fund and conducive environments in conducting the research under the Vot 79089 and Vot 79210.
REFERENCES
A. Selamat and C.C. Ng, 2008, “Arabic Script Documents Language Identifications Using Fuzzy ART”, Second Asia International Conference on Modelling & Simulation”, Kuala Lumpur, Malaysia, 13-15 May 2008, DOI 10.1109/AMS. 2008.47, Pp.528-533.
A. Selamat and S. Omatu. 2004, “Feature selection and Categorization of Web Page Using Neural Networks”, Int. Journal of Information Sciences, Elsevier Science Inc. Vol. 158, January 2004, Pp69-88.
G. G. Chowdhury. 1999, “Introduction to Modern Information Retrieval”, London: Library Association Publishing, 1999.
G. Salton, A. Wong , C.S. Yang. 1975, "A Vector Space Model for Automatic Indexing", Communications of the ACM, Vol.18,1975, Pp613-620.
H. Al-Mubaid, and S.A. Umair. 2006, “A New Text Categorization Technique Using Distributional Clustering and Learning Logic”, IEEE Transaction on Knowledge Engineering, Vol 18, Iss 9,.Sept 2006, Pp1156-1165.
H. Yu, J. Han, K.C. Chang. 2004, “PBL:Web Page Classification Without Negative Examples”, IEEE Transaction On Knowledge And Data Engineering, Vol.16, Iss 1, January 2004, Pp70- 81.
Internet Filter Review. 2007, available at http://www.internet-filter-review.toptenreviews.com/, (May).
John M. Pierre. 2000, “Practical Issues for Automated Categorization of Web Sites”, (Lisbon, Portugal) available at http://www.ics.forth.gr/isl/SemWeb/proceedings/session3-3/html_version/semanticweb.html
M. Hammami, Y.Chahir, L.Chen. 2006, “WebGuard: Web filtering Engine Combining Textual, Structural and Visual Content Based Analysis”, IEEE Transaction On Knowledge And Data Engineering, Vol.18 Iss 2, 2006, Pp272- 284.
N. Churchanroenkrung, Y.S. Kim, B.H. Kang. 2005, “Dynamic Web Content Filtering based on User’s Knowledge”, In
Proceeding of International Conference on Information Technology: Coding and Computing,Vol.1, 2005, Pp184-188.
NetProtect. 2003, available at http://www.net-protect.org/en/default.htm.
P.Y. Lee, Hui, S.C. Fong, A.C.M. Fong. 2002, “Neural Network for Web Content Filtering”, IEEE Intelligent Systems, Vol.17, Issue 5, Sep/Oct 2002, Pp48 – 57.
Teuvo Kohonen, 1995,1997,2001, “Self-Organizing Maps”, Springer Series in Information Sciences, Vol. 30,Springer, (Berlin, Heidelberg, New York), 3rd edition.
Y. Zhou, E. Reid, J. Qin, H. Chen, G. Lai. 2005, “US Domestic Extremist Groups On The Web: Link And Content Analysis”,
IEEE Intelligent Systems, Vol.20, Iss.5, Sept.-Oct 2005, Pp44- 51.
BIOGRAPHY
Zhi-Sam Lee received his B.Sc
(Hons.) in Computer Science from Universiti Teknologi Malaysia (UTM) in year 2005. He was a part time teaching assistant in Faculty of Computer Science and Information Systems, Universiti Teknologi Malaysia in year 2006. Currently he is pursing a Ph.D degree in computer science at the same university. His research interests include semantic web, information retrieval, security and soft-computing. He can be contacted at [email protected]
Mohd Aizani Maarof is an Associate
Technology (IT) Security. He is currently leading the Secure Systems & Cryptography Research Group (SSCRG) in the faculty. Currently his research involve in the areas of Network Security, Web Content Filtering and Cryptography. He can be contacted at [email protected].
Ali Selamat received a B.Sc. (Hons.) in IT from Teesside University, U.K. and M.Sc. in Distributed Multimedia Interactive Systems from Lancaster University, U.K. in 1997 and 1998, respectively. He obtained his Ph.D. degree from Osaka Prefecture University, Japan in 2003. He is currently a Senior Lecturer and Marketing Coordinator at Faculty of Computer Science and Information System, Universiti Teknologi Malaysia (UTM). His research interests include software engineering, software agents, web engineering, and information retrieval, DNA computing and soft-computing. He can be contacted at [email protected] or [email protected]
Associate Prof. Dr. Siti Mariyam
Shamsuddin obtained her
![TABLE 11: The performance comparison for ANN [P.Y.Lee et al., 2002], MCRDR [N. Churchanroenkrung et al., 2005] and PWSCM](https://thumb-us.123doks.com/thumbv2/123dok_us/1305790.1163219/11.595.315.544.98.183/table-performance-comparison-ann-lee-mcrdr-churchanroenkrung-pwscm.webp)