KETOHYDRAZONE COMPLEXES AS POTENTIAL EMITTING
MATERIAL IN OLED
Haznita Rose Bahari1, Mohd Nordin Garif1 and Mustaffa Shamsuddin1
1Department of Chemistry,
Faculty of Science, Universiti Teknologi Malaysia, 81310 UTM Skudai, Johor Bahru, Malaysia.
Email: [email protected]
Keywords: ketohydrazone, fluorescence, OLED. Abstract
Ketohydrazone is a molecule that is able to act as a bidentate ligand through the O of C=O and N of N=C in the molecule. Three ketohydrazone ligands had been fully synthesized through the condensation reaction between 2-hydroxynaphthaldehydes with various hydrazides: salisylic hydrazide, benzyhydrazide and 2-furoic acid hydrazide in a 1:1 stoichiometry. The ligands had been characterized using infrared, 1HNMR and ultraviolet-visible spectrometer.
Complexation reaction between all ligands and metals, with a stoichiometry of 1:2 for Zn (II) : ligand and 1:3 for Al(III) : ligand were carried out. All six complexes obtained were characterized using FTIR and UV-Vis spectrometer. The fluorescence properties of each ligands and complexes were investigated using luminescence spectrofluorometer excited at 406 nm. It was found that the compounds emitted blue light at λmax = 470 nm. Results showed that all the ligands and
molecules synthesized have the fluorescence properties and complexation with metal enhanced the intensity of the fluorescence. It was observed that complex of Al(NDB)3 showed the best potential as an emitting material for OLED as it has
the highest fluorescence intensity compared to others.
Abstrak
Ketohidrazon merupakan sebatian molekul yang berupaya berfungsi sebagai ligan bidentat melalui O daripada C=O dan N daripada N=C di dalam molekulnya. Tiga ligan ketohidrazon telah berjaya disintesis melalui proses kondensasi antara 2-hidroksinaftaldehida dan beberapa kumpulan hidrazida, salisilik hidrazida,, 2-furoik hidrazida, dan benzihidrazida.mengikut nisbah stoikiometri 1 : 1. Semua ligan yang telah disintesis dicirikan melalui spektroskopi IR, UV-Vis dan 1H-RMN. Tindak
balas pengkompleksan antara ligan yang telah disintesis dengan dua logam yang berasingan, iaitu aluminium dan zink telah dijalankan dengan nisbah ion ligam : ligan 1 : 3 bagi pengkompleksan dengan aluminium dan 1 : 2 bagi pengkompleksan dengan zink. Enam kompleks yang terhasil dicirikan melalui spektroskopi IR dan UV-Vis. Ciri-ciri pendarfluor bagi tindak balas pengkompleksan dan ligan yang terhasil telah dikaji menggunakan spektrometer pendarfluor pada panjang gelombang pemancaran 405nm. Didapati sebatian-sebatian tersebut memancarkan cahaya biru pada λ max = 470 nm. Hasil yang
diperolehi menunjukkan bahawa semua ligan dan kompleks yang disintesis menunjukkan sifat pendarfluor dan pengkompleksan dengan logam dapat meningkatkan keamatan pendarfluornya.. Kompleks Al(NDB)3 menunjukkan potensi
yang terbaik sebagai bahan pemancar dalam diod pemancar cahaya organik (OLED) memandangkan kompleks ini menunjukkan keamatan pendarfluor yang tertinggi.
Introduction
Since organic light-emitting diodes (LEDs) using 8-hydroxyquinoline aluminum as the emitting layer was reported to emit green light in 1987 [1], organic LEDs have received considerable attention due to their potential application in various displays. Emitting material for organic LEDs can be classified into three types according to their molecular structure: organic dyes, chelate metal complexes and polymers. Complexes of chelating ligands are in general more stable thermodynamically than those with an equivalent number of monodentate ligands. These organic molecules were useful due to their solubility. They could be applied to a surface as a film via evaporation of their solvent.
properties. Several research groups reported efficient bluish-green emission in the devices using the oxadiazole compounds [2]. From Suning Wang study, he reported fluorescence properties for two derivatives of 7-azaindole complexes with aluminium. Although the compounds has a blue emission band at ca. 450 nm, it is very weak and the steric factors may be responsible for the problem[3].
There is a big challenge in developing emitting materials which can exhibit highly efficient blue-light emission. Thus, the research was focused on synthesizing the new complexes as blue light emitting material and their potential as the emitting material in OLED.
Experimental
Synthesis of Ligands
2-Hydroxynaphthaldehyde was dissolved in absolute methanol in a 3-necked round bottomed flask. Solution of 4-Hydroxybenzhydrazide in absolute methanol was added into the flask. The reaction mixture was then heated
with stirring under nitrogen at 800C, for 2.5 hours. The light yellow precipitate formed was filtered by suction
and dried in a vacummed dessicator. The product, 2-hydroxynaphthaldehyde benzoilhydrazide was then recrystallized using methanol. The same procedure was repeated for preparation of other ligands by replacing benzhydrazide with salicylichydrazide for Hydroxynaphthaldehyde salicyloilhydrazide (NDS) ligand and 2-furoic acid hydrazide for 2-Hydroxynaphthaldehyde furoilhydrazide (NDF) ligand. All the ligands obtained were characterized using NMR, UV-Vis and IR spectroscopy.
Determination of Ligand-Metal Stoichiometry
By using Job method [4], absorption of different mole fraction of ligand and metal was plotted. Metal solution and ligand solution with different mole fraction were mixed together followed by addition of buffer solution at pH 5.1, which was made up from sodium acetate trihydrate and glacial acetic acid followed by addition of deionized water. After 5 minutes, UV-Vis spectrum was recorded. By using the following formula;
n = Xmax / (1-Xmax)
n = no. of mole ligand bonded with metal
Xmax= mole of ligand at maximum absorption
the value of n was calculated.
It was found that the metal : ligand stoichiometry are 1:2 for zinc complexes and 1:3 for aluminium complexes.
Synthesis of Complexes
tris(2-hydroxynaphthaldehyde 4-hydroxybenzhydrazide Aluminium(III) (Al(NDB)3 ) Complex.
A quantity of NDB ligand (0.0918 g, 3 mmol), was weighed and dissolved in absolute ethanol in a 3-necked round-buttomed flask. The solution was stirred under nitrogen at room temperature. Aluminium nitrate nonahydrate (0.0375 g, 1 mmol ) was added to the solution. The mixture was stirred under nitrogen until a yellow precipitate was formed. The solid was collected by suction filtration and dried in vacuum dessicator. By taking note that aluminium : ligand stoichiometry is 1:3, the same procedure were repeated for synthesis of
tris(2-hydroxynaphthaldehyde salicyloihydrazide Aluminium(III) (Al(NDS)3 ) and
tris(2-hydroxynaphthaldehyde furoilhydrazide Aluminium(III) (Al(NDF)3 ).
T
ris(2-hydroxynaphthaldehyde benzoilhydrazide Aluminium(III) (Al(NDB)3 ) Complex.A quantity of NDB ligand (0.0612 g, 2 mmol), was weighed and dissolved in absolute methanol in a 3-necked round-buttomed flask. The solution was stirred under nitrogen at room temperature. Zinc acetate dihydrate (0.0220 g, 1 mmol ) was added to the solution. The mixture was stirred under nitrogen until a yellow precipitate was formed. The solid was collected by suction filtration and dried in vacuumed dessicator. By taking note that zinc : ligand stoichiometry is 1:2, the same procedure were repeated for synthesis of
di(2-hydroxynaphthaldehyde salicyloihydrazide Zinc(II) (Zn(NDS)2 ) and di(2-hydroxynaphthaldehyde
furoilhydrazide Zinc(II) (Zn(NDF)2 ).
After 5 minutes, fluorescence spectrum was recorded using Perkin Elmer Luminescence Spectrometer model LS55. The ligands were excited at 406 nm.
.
Determination of Fluorescence Intensity of Complexes
Ligand solution (3 mL, 1x10⁻⁴ M) was pipeted into 10 mL volumetric flask. Metal solution (1 mL, 1x10⁻⁴M) was
added to the solution followed by buffer solution with pH 5.1 (2 mL). The mixture was then added with deionized water until the mark. The complexes were ecited at 406 nm.
Results and Discussion
The percentage yield for NDB ligand is 64%, NDF ligand is 69% and NDS ligand is 74%. Each of the ligands is
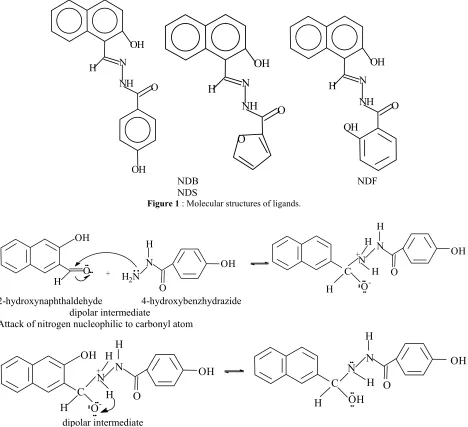
yellow in colour and has melting points higher than 2000C. Figure 1 shows the structure for ligands. Based on
the IR, UV-Vis and 1H-NMR data obtained, as discussed below we expected that all ligands were successfully
synthesized. H O OH NH N OH O OH N NH O H H O OH NH N OH
NDB NDF
NDS
Figure 1 : Molecular structures of ligands.
O H
N H
H2N
..
OOH
+
OH
H O
-C H H + N H N O OH
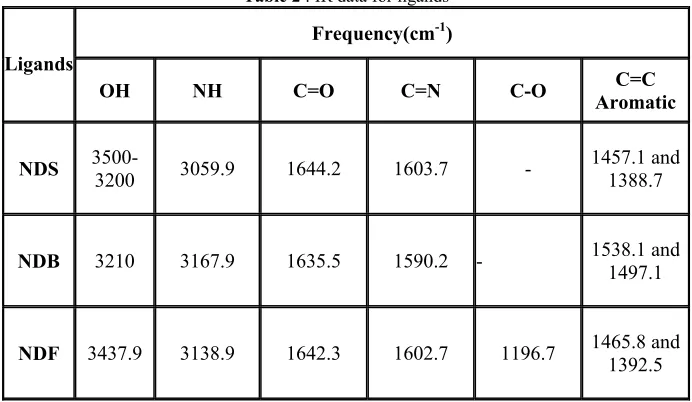
2-hydroxynaphthaldehyde 4-hydroxybenzhydrazide
dipolar intermediate
Attack of nitrogen nucleophilic to carbonyl atom
H+ OH C H N O H N H OH OH H N H O NH C
OH2+
OH
protonated amino alcohol
Protonation of hydroxyl group
-H 2O C N H N O + H
OH2+
C H N O H N H OH H OH OH iminium ion Protonation of the oxygen
H N H
OH2+
H + N C OH O H N H N C OH O OH 2-hydroxynaphthaldehyde4-hydroxybenzhydrazide
Table 1 : Main absorption bands according to types of electronic transition in UV-Vis spectra of ligands.
Electronic Transition (nm)
π →π* n →π*
Ligands
C=O C=N Aromatic ring C=O C=N
NDB 311 325 361 and 375 425 425
NDS 314 327 363 and 385 426 426
NDF 313 326 364 and 377 433 433
Table 1 shows the UV-Vis data for ligands. Substitution on the carbonyl group by an auxochrome with lone pair
of electrons, -NHR, gave a pronounced hypsochromic effect on the n →π* transition. The auxochrome attached
to the carbonyl group on ligands caused a bathochromic shift on the π→π* transition [5]. Overall, absorption
Table 2 : IR data for ligands
Frequency(cm-1) Ligands
OH NH C=O C=N C-O AromaticC=C
NDS 3500-3200 3059.9 1644.2 1603.7 - 1457.1 and 1388.7
NDB 3210 3167.9 1635.5 1590.2 - 1538.1 and 1497.1
NDF 3437.9 3138.9 1642.3 1602.7 1196.7 1465.8 and 1392.5
Table 2 shows the data for IR spectra of ligands. From IR data , the observed band at 3500-3200 cm-1 are
assigned as the bonded O-H. Thesharp and intense band at 3167.9 cm-1 for NDB ligand, 3059.9 cm-1 for NDS
ligand and 3138.9 cm-1 for NDF ligand is consistent with the presence of a N-H group while the band of medium
intensity 1605 – 1590 cm-1 is characteristic of the amine C=N, formed through the condensation between
aldehyde and hydrazide. The absorption band for N-H had shifted to a lower frequency that maybe due to the
formation of the enol form of the ligands. The strong band at 1642.3 cm-1 for NDF ligand, 1635.5 cm-1for NDB
and 1644.2 cm-1 for NDS are assigned to the C=O group of the hydrazide. The presence of the C=N and C=O
absorption bands in the spectrum confirmed the completeness of the condensation reaction.
Table 3 : NMR data for ligands
Chemical Shift Ligand
OH NH N=CH Aromatic C=CH
NDB 12.90 s,
12.00 s 10.25 s 9.49 s 6.9-8.2 m -
NDF 12.63 s 12.25 s 9.50 s 7.3-8.2 m 7.2 d
NDS 12.72 s,
11.99 s 11.69 s 9.51 s 6.9 m-8.3 m -
Table 3 shows the NMR data for ligands dissolved in d6-DMSO. The presence of amide O=C-NH proton
resonance in the 1H NMR spectrum indicated that the ligand exists as the keto form .
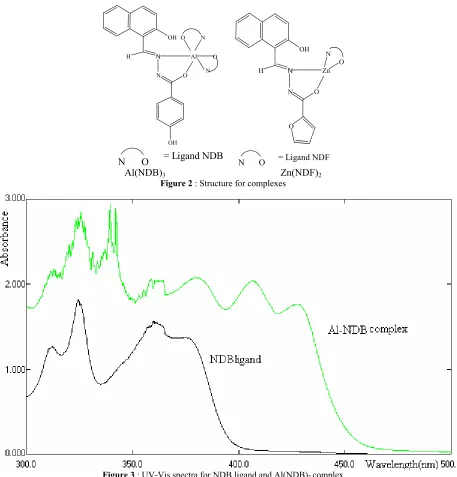
Figure 2 shows the molecular structure of Al(NDB)3 and Zn(NDF)2. the characterization of complexes were
OH
H N
N
OH O
Al O N
O N
OH
H N
N O Zn
O
N O
N O = Ligand NDB N O = Ligand NDF
Al(NDB)3 Zn(NDF)2
Figure 2 : Structure for complexes
Figure 3 : UV-Vis spectra for NDB ligand and Al(NDB)3 complex
Figure 3 shows the UV-Vis spectrum for NDB ligand and Al(NDB)3 complex as representative spectrum for the
complexes. UV-Vis spectrum for complex shows that absorption due to electronic transition in C=O and C=N had shifted to longer wavelength. Batochromic shift for aromatic complex occurred at 410 nm and new absorption band formed at 435 nm that could be assigned as the charge transfer transition between metal and ligand [6].
Table 4 shows IR data for complexes. By comparing the FTIR spectrum between ligands and complexes, we can
observed the presence of OH group bonded to the aromatic ring, in the region of 3300-3450 cm-1. This indicates
Table 4: IR data for complexes
Frequency(cm-1)
Complex
OH C=O C=N NO3
-NDB Complex (3200-3500) 3394 observed Not (1604.7) 1605.6 1384.8 1390.6
NDF Complex (3425.3) 3436.9 observed Not (1617.2) 1619.1 1385.8 1382.9
NDS Complex (3200-3500) 3450.4 observed Not (1604.7) 1604.7 (1388.5) 1386.7
*Bracket indicates value for zinc complexes
It was also observed that the absorption of NH in amide group had disappeared, suggesting the forrnation of enol
group and the formation of C=N-O- before the bonding of oxygen atom with the metal occurred. This also
explain why the C=O band is not observed.
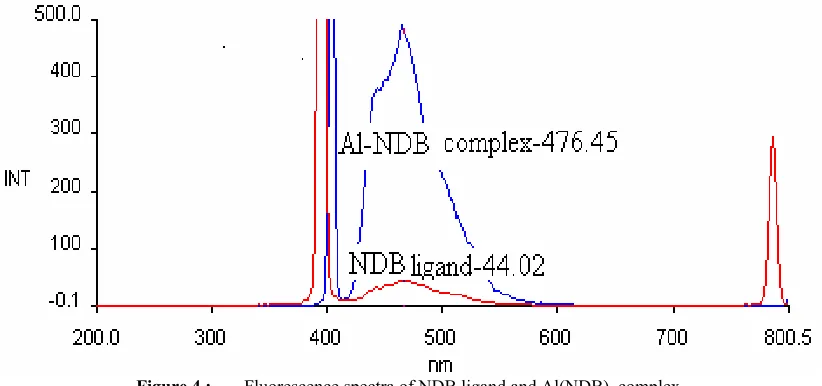
Figure 4 shows the spectra of ligand and complex being excited at the same wavelength. Similar spectrum also observed for other complexes.
Figure 4 ; Fluorescence spectra of NDB ligand and Al(NDB)3 complex
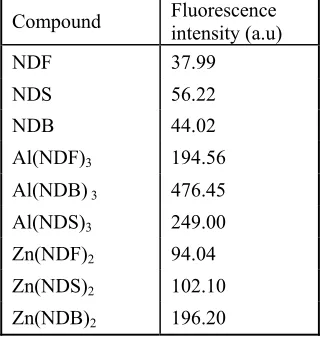
Table 5 shows the intensity of fluorescence excited at λ max 406nm and emit blue light at λmax 470 nm. It shows
that Al(NDB)3 complex has the highest intensity comparedto the others and all the aluminium complexes shows
higher fluorescence intensity compared to zinc complexes which maybe attributed by more number of ligands bonded to aluminium.
Table 5 : Fluorescence intensity of ligands and complexes
Compound Fluorescence intensity (a.u)
NDF 37.99 NDS 56.22 NDB 44.02
Al(NDF)3 194.56
Al(NDB) 3 476.45
Al(NDS)3 249.00
Zn(NDF)2 94.04
Zn(NDS)2 102.10
Zn(NDB)2 196.20
Conclusions
Three ketohydrazone ligands had been successfully synthesized and characterized. Complexation with metal increased the fluorescence intensity of the compounds as it causes the increase in rigidity of molecule especially with chelating ligand. Al(III) complexes shows better fluorescence intensity than Zn(II) complexes as it has a higher coordination number and thus increases the rigidity of molecules. All compounds emitted light in blue region.
As a conclusion, Al(III) complexes show a better potential to be the emitting material for OLED devices as it shows a better fluorescence properties compared to Zn(II) complexes. However, among all the complexes,
Al(NDB)3 had the best potential for this purpose as it shows the highest intensity of fluorescence.
Acknowledgement
Special thanks to all SMCRG group , Chemistry Department and financial support from UTM through vot 75151.
References
1. Gui Y., Yang S. (2001). A New Blue Light-Emitting Material. Synthetic Metals. 117. 211-214
2. Shizuo T., Noda K., Hiromitsu T. (2000) “Organic Light-Emitting Diodes using Novel Metal–Chelate Complexes”.
Synthetic Metals.111. 393–396.
3. Suning W. (.2001 ) “Luminescence and Electroluminescence of Al(III), B(III), Be(II) and Zn(II) Complexes with Nitrogen Donors”. Coordination Chemistry Reviews. 215. 79–98.
4. Constable, E.C. (1996). Metals and Ligand Reactivity: An Introduction to the Organic Chemistry of Metal Complexes. New York: VCH Publishers. 22-44.
5. Donald, L.P, Gary, M.L, and George, S.K. (1996). “Introduction to Spectroscopy”. 2ndEdition. Saunders College.
USA. 53. 162-164.
6. UV Spectrometry Group (1993). UV Spectroscopy Techniques : Instrumentation, data handling. London : Chapman & Hall. 26-30
7. Tao Y. T. (2001). “Organic Light-Emitting Diodes Based on Variously Substituted Pyrazoloquinolines as Emitting Material”. Chem. Mater.13,1207-1212.