MICROPOROUS MATERIALS
Thesis by
John Charles McKeen
In Partial Fulfillment of the Requirements
For the Degree of
Doctor of Philosophy
California Institute of Technology
Pasadena, CA
2009
© 2009
John Charles McKeen
Finally, none of this work would have been possible without my advisor
Mark E. Davis. When I joined the lab, he agreed to let me start a new project,
and for that I am forever grateful. He was encouraging as I learned and struggled
and patient when I was frustrated. Some of the ideas I pitched to him worked,
and many of them failed, sometimes to the tune of more money than I would like
to admit. But Mark was always willing to let me try and provided me with, what
has to be, the best financial support possible, not to mention many interesting
discussions. I am also thankful for his willingness to share stories about past
projects, successes, and failures from his many years of experience. I believe
that the knowledge gained from them will prove invaluable throughout my career.
impedance spectroscopy. Monovalent cation exchanged samples Li- and
Na-VPI-9 lose X-ray crystallinity upon vacuum dehydration at 450 °C, while K-, Rb-,
and Cs-VPI-9 remain crystalline and exhibit conductivities of 1.7 x 10⁻⁴, 3.5 x 10⁻⁴,
and 4.9 x 10⁴ S/cm, respectively, at 450 °C in vacuum. While K-VPI-9 is less
conductive than K-X, Rb- and Cs-VPI-9 are more conductive than corresponding
zeolite X samples. Divalent cation exchanged sample Mg-VPI-9 also loses X-ray
crystallinity, while Ca-, and Sr-VPI-9 remain crystalline and exhibit conductivities
of 2.3 x 10⁻⁶ S/cm and 7.7 x 10⁷ S/cm, respectively, at 450 °C, greatly exceeding
the conductivity of correspondingly divalent exchanged zeolite X materials.
Dense, crystalline zincosilicate samples with the compositions K2ZnSixO2(x+1) (x =
2 - 5), Rb2ZnSi5O12, and Cs2ZnSi5O12 are also prepared and exhibit much lower
7.1.1. Protonic Conductivity ... 205
7.1.2. Ionic Conductivity ... 206
7.2. SUGGESTIONS FOR FUTURE WORKS ... 207
7.2.1. Protonic Conductivity ... 207
7.2.2. Ionic Conductivity ... 209
containing domains ~5 nm in diameter. These large domains are believed to be
spaced ~4 nm apart and interconnected by smaller channels of ~1 nm
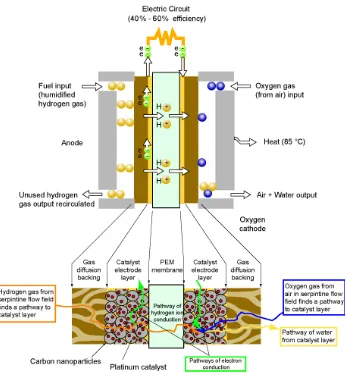
Figure 1.1. Schematic of hydrogen fuel cell.
Figure 1.2.Chemical structure of Nafion showing the fluorocarbon backbone and
being reduced by the electron. To be electrochemically active, each LixCoO2
particle must, therefore, be part of a percolated, electronically conducting
network and a percolated, ionically conducting network, and loss of percolation of
either of these networks causes loss of capacity with repeated charge/discharge.
Because of the high reactivity of lithium with moisture and the flammability
of the organic solvents used in the supporting electrolyte, consumer lithium
batteries have been known to thermally runaway and burn due, primarily, to poor
quality control during manufacturing. While safety features have been engineered
into modern batteries, it is desirable to remove flammable components from
batteries. This is no small task, however, given the complex composite structure
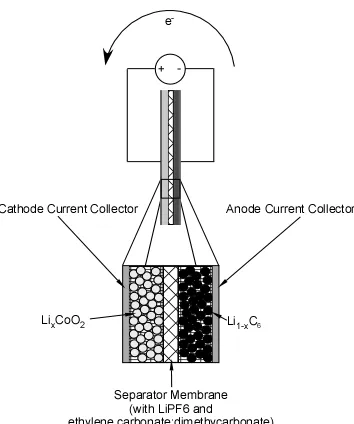
Figure 1.3. Schematic of secondary (rechargeable) lithium battery. The anode is
composed of particles of carbon with lithium intercalated between the graphitic
layers. The cathode is composed of particles of lithium cobalt oxide. A typical
electrolyte is LiPF6 dissolved in a mixture of ethylene carbonate and dimethyl
rings in the crystalline structure, arising from the presence of zinc. CIT-6, the
zincosilicate analog of aluminosilicate zeolite beta, has received the most
attention among the zincosilicates and has been shown to be a convenient
starting material for the production of a family of materials with the *BEA topology
through post-synthetic chemical modification.25,27 Using acetic acid, zinc can
selectively be extracted from the framework and washed from the pores of CIT-6
leaving either hydroxyl nests, if treated below 100 °C, or producing a hydrophobic
*BEA material, if treated above 100 °C, annealing out the hydroxyl nests,
presumably with a small amount of dissolved silica from other parts of the
structure. Further, if treated with acetic acid in the presence of aluminum,
aluminum can be inserted into the former zinc sites producing an aluminosilicate
versus temperature data decreased with increasing exchange, and this was
attributed to less cation-cation repulsion (or cation-proton repulsion).115
1.4.4.11. Tin Containing Zeolites
Four reports exist regarding tin containing mordenite and zeolite Y, but the
prepared systems were two-phase composite materials containing tin-exchanged
zeolites and tin-oxide, and further discussion is, therefore, not presented in this
review of ion conductivity in microporous materials. The reader is referred to the
original references for a complete description.116-119
1.4.4.12. ETS-10
The only known report on divalent ion conductivity in a microporous
material was presented by Wei and Hillhouse for the octahedral titanium
containing ETS-10. Copper(II) was exchanged into the pores of ETS-10 which
exhibited greater conductivity and an activation energy 15 kJ/mol lower than that
for copper(II) exchanged zeolite X. 120 Modulus spectroscopy was also used to
examine sodium ion conductivity in ETS-10, and a high frequency relaxation and
low frequency relaxation were observed. The low frequency peak had an
activation energy of 54.6 kJ/mol, lower than that measured for Na-X by the same
authors (62.9 kJ/mol) and the high frequency peak had an activation energy of
(117) Knudsen, N.; Andersen, E. K.; Andersen, I. G. K.; Norby, P.; Skou, E.
Solid State Ionics1993, 61, 153.
(118) Knudsen, N.; Andersen, E. K.; Andersen, I. G. K.; Skou, E. Solid State
Ionics1989, 35, 51.
(119) Knudsen, N.; Krogh, E.; Andersen, I. G. K.; Skou, E. Solid State Ionics
1988, 28-30, 627.
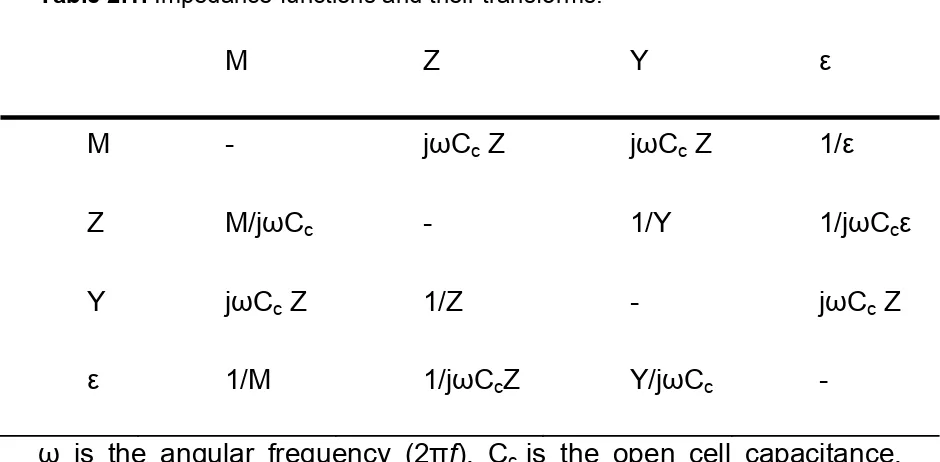
Table 2.1. Impedance functions and their transforms.
M
Z
Y
ε
M -
j
ω
C
cZ
j
ω
C
cZ
1/
ε
Z M/j
ω
C
c-
1/Y
1/j
ω
C
cε
Y j
ω
C
cZ
1/Z
-
j
ω
C
cZ
ε
1/M
1/j
ω
C
cZ Y/j
ω
C
c-
ω
is the angular frequency (2
π
f
), C
cis the open cell capacitance,
defined as
ε
0A/d, where
ε
0is the permittivity of free space, A is the
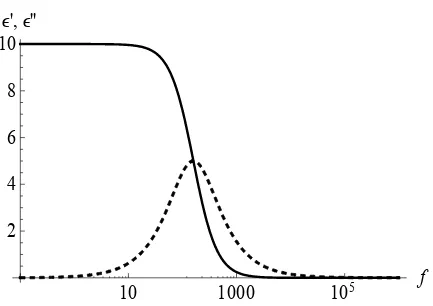
as the Debye equivalent circuit. When the real, ε’, and imaginary, ε”, parts of the
dielectric constant are plotted as functions of frequency, plots similar to that
shown in Figure 2.2 are observed.
A single relaxation is the simplest possible case and, in general, a
distribution of relaxation times exists in solids and the governing equations
become more complicated. Distributed relaxation times lead to a broadening of
the ε” peak, and a depression of the semicircular arc, if plotted in the complex
plane, that is ε” versus ε’.
When the Debye circuit equations are plotted in the complex Z* plane, a
Figure 2.1. Debye equivalent circuit. R C1
Figure 2.2. ε’ (solid) and ε” (dashed) as functions of frequency for Debye
relaxation.
10
1000
10
5
f
2
4
6
8
10
Figure 2.3. Debye circuit plotted in complex Z* plane.
0
50
100
150
200
-
Z'
0
50
100
150
1 ∆ ∆
, (2.11)
and the transport activation energy is given by
∆ ∆ . (2.12)
For a full derivation, see Almond, Duncan, and West.2
The simplest circuit model of ionic conduction in solid state materials is a
resistor in parallel with a capacitor, shown in Figure 2.4. In dielectric constant
representation
, (2.13)
where / and is the direct current conductivity of the sample. The
frequency dependant conductivity of the sample is given by
. (2.14)
The dielectric constant as a function of frequency is shown in Figure 2.5. The
imaginary part of the dielectric constant continually increases as frequency
decreases, while the real part remains constant as a function of frequency. In the
complex Z* plane, however, a semicircle is traced out as a decreasing function of
Figure 2.4. Circuit model used to describe ionic conduction in solid state
materials.
Figure 2.5. ε’ (solid) and ε” (dashed) as functions of frequency for circuit in
Figure 2.4.
10
1000
10
5
f
50
100
150
200
Figure 2.6. Impedance spectra of circuit shown in Figure 2.4.
0
20
40
60
80
100
120
-
Z'
0
20
40
60
80
100
2.2. Apparatus for Measuring Proton Conductivity
Two devices for measuring the proton conductivity of fully hydrated
powder materials were sequentially constructed. Both devices were inspired by
Holmberg’s design with various modifications.3 The first apparatus, shown in
Figure 2.7, was designed for in situ measurement of sample thickness using a
digital micrometer. Powder samples were loaded into an insulating plastic sample
holder that was fitted with a platinum bottom contact. The plastic sample holder
snuggly fit into the center of the brass block. Kapton thin film heaters,
sandwiched between the internal brass block and the four attached cooling
radiators, were used to heat the sample. Each attached cooling radiator had an
inlet and outlet port for a cooling flow, if desired. The top contact was formed by a
platinum plate connected to a hollow plastic rod. Electrical contact to the bottom
contact was achieved through a BNC connector attached to a spring loaded tip
that touched the platinum plate through a small hole in the bottom of the plastic
sample holder. Electrical contact to the top contact was made by soldering a
wire, running through the hollow plastic rod, to the platinum contact. The white
block on the bottom of the apparatus was made from Teflon and electrically and
Figure 2.7. Apparatus constructed for variable temperature measurement of
proton conductivity of fully hydrated powder samples, with in situ sample
thickness measurement. Insulation bottom Teflon block.
Center brass block
Digital micrometer
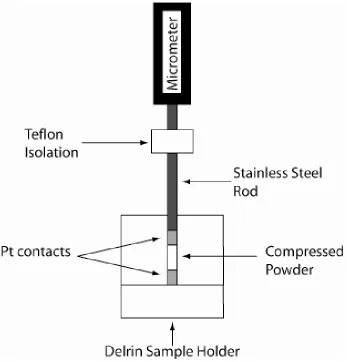
stainless steel rod and the piston of the digital micrometer to ensure electrical
isolation of the sample. A picture is shown in Figure 2.8
Powdered samples were loaded into the sample holder on top of the
bottom platinum cylinder and gently compressed. Distilled, purified water was
then added and allowed to hydrate the sample for 60 minutes. This duration of
time was experimentally found to be sufficiently long for the sample to reach
equilibrium. The top platinum cylinder connected to the stainless steel rod was
then inserted and pressure was applied using a torque screwdriver to lower the
Figure 2.8. Apparatus for measuring proton conductivity of fully hydrated
powders. Electrical contact is achieved by clipping Solartron 1260 cables to
stainless steel rod and copper foil. Insulation bottom
Teflon block. Copper foil for making contact
with Pt bottom contact
Teflon coupler Stainless steel
2.3. Apparatus for Variable Temperature/Humidity
Measurements
Because our initial attempts to build an apparatus to measure proton
conductivity as a function of temperature failed, a second device was constructed
for this purpose. A few literature reports performed impedance spectroscopy to
investigate the effect of hydration on conductivity (see Section 1.4.4.1.2, for
example) in freestanding pelletized samples, and this avenue was, therefore,
pursued. A Cincinnati Sub Zero temperature/humidity chamber was purchased to
control both the temperature and relativity humidity of the sample environment.
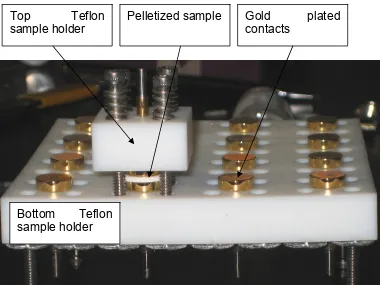
Another custom sample holder was constructed and is shown in Figure 2.9. The
sample holder was designed for the simultaneous loading of sixteen samples and
Figure 2.9. Sample holder for pelletized sample used in temperature/humidity
chamber. A pellet can be seen between two of the gold coated contacts. Bottom Teflon
sample holder
Top Teflon sample holder
Pelletized sample Gold plated
Figure 2.10. Impedance as a function of time at 65 °C and 95% relative humidity
over 3.5 days.
0 1000 2000 3000 4000 5000
150
0 1000 2000 3000 4000 5000
2.4. Apparatus for Measuring Ion Conductivity
For measurement of ionic conductivity in microporous materials, all water
must be removed from the pores as the presence of any water has been
observed to significantly affect the conductivity. A vacuum system with a heater
capably of elevating and controlling the sample temperature over the range
25-500 °C is, therefore, necessary to dehydrate samples and maintain a water-free
environment for the duration of measurement. Furthermore, the sample holder
must be capable of withstanding these temperatures. To meet these
requirements a vacuum chamber and turbomolecular pump were purchased and
a custom probe was constructed. The vacuum chamber is shown in Figure 2.11
and is capable of reaching vacuum levels of ~10-6 Torr. The sample holder is
shown in Figure 2.12. A ceramic fiber heater (Watlow) is mounted inside the
vacuum chamber to heat the sample. The inside bore is 3” and the outside pore
of the sample holder is 2.5”, minimizing the vacuum space between the heater
and sample and maximizing radiative heating. The heater temperature is
adjusted and maintained by a Watlow temperature controller, using temperature
data from a thermocouple mounted in the sample holder. The sample holder
Figure 2.11. Vacuum chamber used for dehydration and characterization of
internal diameter of 1 cm and pressure was applied using the described bushing
Figure 2.12. Sample holder for pelletized samples. Location for sample
Alumina tube with internal Pt wire for top contact
Pt wire for bottom contact
Pt rod used to contact top gold contact
Spring used to apply gentle force to the disc
2.5. Measurement with Interdigitated Electrode Structures
Interdigitated electrode (IDE) structures, shown in Figure 2.13 were
purchased from Novocontrol and used in an effort to help understand the
features observed in modulus spectra of Na-X. Further discussion of this is
presented in the following section. A vacuum system was constructed for
characterization of the IDE chips and is shown in Figure 2.14. The IDE chips
have three terminals, two used for characterization and the third for electrically
grounding the guard ring on the chip. Watlow Firerod heaters in a copper block
mounted inside the vacuum chamber (not shown) heat the IDE structure, which
is held to the copper block by custom machined clips. Temperature is monitored
and controlled by a Watlow temperature controller connected to a k-type
thermocouple inserted into the copper block. Samples are prepared by slurrying
Na-X in ethanol and applying a few drops of the slurry from a pipette onto the
IDE structure. Vacuum was applied and samples were dehydrated at 250 °C
under a low flow of argon. While a higher temperature was desirable, the IDE
2.6. System Qualification and Analysis
In a series of papers on ionic motion in zeolites,4-7 it was suggested the
presentation of data in the modulus representation, Equation (2.15), and in
particular the imaginary part of the modulus, M” as a function of frequency, rather
than traditional impedance (Z*) data, allowed for more straightforward
visualization of ionic conduction and local relaxations. In Equation (2.15) i is the
square root of -1, ω is the frequency in radians per second, C0 is the empty cell
capacitance, M* is the complex modulus, and Z* is the complex impedance.
(2.15)
A further article on ion conductivity in ETS-10 also uses modulus
representation, and presents data on sodium exchanged zeolite X and ETS-10.8
In the investigation of ionic conductivity in VPI-9, it was of interest to first
repeat literature results from the aforementioned papers on Na-X as a system
check, but this was found this to be a non-straightforward process. Figure 2.15
shows M” data from a pressed pellet of Na-X with sputtered gold contacts,
Figure 2.15. Imaginary part of the modulus as a function of frequency for
An intense peak at high frequency is clearly seen, which has been
previously attributed to the local motion of a sodium ion within the large α cages
in zeolite X.7 The peak (or hump, rather) at low frequency, however is not well
resolved from the large, high frequency peak, as in references 4 and 6. This was
troubling at first, but further experimentation revealed the answer. Figure 2.16
shows M” spectra of Na-X powder, held between two platinum discs in vacuum,
at various temperatures, and in this case two well resolved peaks are observed.
The low frequency peak has been attributed to the long range ionic conduction
process,7 but the full interpretation is more complex, and will be discussed
shortly. Finally, Figure 2.17 shows M” data for Na-X powder drop-cast from an
ethanol slurry onto an interdigitated electrode (IE) structure (Novocontrol). The
sample was dehydrated in vacuum to remove water and ethanol, and
contributions to the spectra from the IE substrate have been subtracted. Again,
two well resolved peaks are observed, with nearly equal peak heights. Pressed
pellets of NaX without sputtered contacts were also characterized by directly
sandwiching them between two Pt electrodes, and spectra similar to those show
Figure 2.16. M” spectra of Na-X powder held between two circular Pt plates.
Figure 2.17. M” spectra for Na-X powder drop-cast from ethanol onto
interdigitated electrode structure. Measurement performed in vacuum at 25 °C.
25 °C 400 °C
Circuit models are often used to describe the physical processes occurring
in ionic conductors and the most common element is the parallel combination of
a resistor and a capacitor. The M” spectra for Na-X can be modeled using two of
these elements in series, one element corresponding to the motion of a sodium
ion in an α cage and one to represent the long range process (such as DC
conduction).8
To illustrate how circuit model parameter values (Ri and Ci) influence the
fitting of data, and to help elucidate the nature of the variation in shape and
position of the low frequency peak, Mathematica was used to plot M” as a
function of frequency. This is shown in Figure 2.18, along with the circuit model
used to generate the appropriate equations (by taking the Laplace transform of
the appropriate transfer function). In the M” spectra, each RC parallel element
corresponds to one of the peaks.
In Figure 2.18 a) and b) R2 and C2 are constant and correspond to the
high-frequency peak. In a), however, a smaller value of C1 and larger value of
R1 are used than in b). The peak position in frequency is controlled by the value
R1, larger values of R1 shifting the peak to lower frequencies. The height of the
peak is controlled by the value C1, smaller values of C1 increasing the peak
Figure 2.18. M” spectra calculated and plotted using Mathematica. Inset of a) is
equivalent circuit model used to generate modulus plots.
C1
R1
C2
R2
2.7. References
(1) Impedance Spectroscopy: Theory, Experiment, and Applications; Wiley,
2005.
(2) Almond, D. P.; Duncan, G. K.; West, A. R. Solid State Ionics1983, 8, 159.
(3) Holmberg, B. A.; Yan, Y. J. Electrochem. Soc.2006, 153, A146.
(4) Franke, M. E.; Simon, U. Solid State Ionics1999, 118, 311.
(5) Franke, M. E.; Simon, U. ChemPhysChem2004, 5, 465.
(6) Franke, M. E.; Simon, U.; Moos, R.; Knezevic, A.; Muller, R.; Plog, C.
Physical Chemistry Chemical Physics2003, 5, 5195.
(7) Simon, U.; Flesch, U. J. Porous Mater.1999, 6, 33.
50,000 g, and dried at 100 °C. PE containing samples (PE-BEA-x) were treated
with 96 wt.% H2SO4 at 80 °C for 24 hours to remove the TEA+(OH-). The
extraction was repeated 2-3 times to ensure maximum removal of the structure
directing agent (SDA). Following extraction, samples were dried at 110 °C under
a rough vacuum and subsequently sulfonated by reaction with oleum for 12
hours at room temperature. See Figure 3.1. Oleum treated samples
(S-PE-BEA-x) were quenched by addition to 500 mL of cold water followed by filtration and
washing with at least 2 L of water. Samples were further washed by repeated
sonication/centrifugation while monitoring the effluent pH. Samples were washed
until the effluent pH was the same as the washing water (and until measured
conductivity values did not change with subsequent washing). Non PE containing
samples (BEA-x) were calcined at 550 °C in flowing air. The temperature was
increased to 550 °C over 6 hours and then held at 550 °C for another 6 hours.
Ammonium exchange was accomplished by contacting the samples with 1 M
NH4Cl at 90 °C for 24 hours. The supernatant was poured off and fresh solution
was added 2-3 times to ensure maximum exchange. Samples were then
collected by filtration, washed and dried at 100 °C. Thermal desorption of
O O O
Si
S
O
O
OH
O O O
Si
Oleum, RT, 12 h
Figure 3.1. PETMS was incorporated into the pores of zeolite beta, or grafted
Figure 3.2. Sample holder used for proton conductivity measurements. Powder
samples were loaded on top of the bottom Pt contact and allowed to equilibrate
with water. The top contact was then inserted and the sample was compressed
by applying torque to the micrometer with a torque screwdriver. An aluminum
frame (not shown) held the structure in place, and the micrometer was zeroed
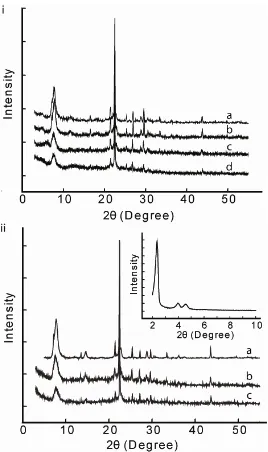
Figure 3.3. X-ray diffraction data from i) as-synthesized samples. a. Pure silica
zeolite beta (PS-BEA), b. PE functionalized pure silica zeolite beta (PE-PS-BEA),
c. PE-CIT-6, and d. PE-BEA-100 (PE functionalized nanocrystalline beta
synthesized from a gel with a SiO2/Al2O3 = 100). Ii) Sulfonated samples. a.
S-PE-PS-BEA, b. S-PE-CIT-6, c. S-PE-BEA-100. Inset shows S-PE-MCM-41
Figure 3.4. Thermogravimetric analysis traces of a. acetic acid extracted
PE-PBEA, b. PE-PPE-PBEA, c. PE-CIT-6 (from 80 °C acetic acid extraction), d.
S-PE-BEA-100, e. S-PE-MCM-41, f. as made PE-PS-BEA. Mass loss between 400
and 700 °C is attributed to combustion of the PE or S-PE groups. Mass loss
under 200 °C is attributed to water and water bound to the sulfonic acid groups.
The two mass losses in curve f are attributed to the combustion of TEAOH and
Figure 3.5. 13C CPMAS NMR spectra of a. PE-MCM-41, b. acetic acid extracted
PE-PS-BEA, c. acetic acid extracted (80 °C) PE-CIT-6, d. oleum treated
(sulfonated) S-PE-MCM-41, e. oleum treated S-PE-PS-BEA, f. S-PE-CIT-6. Upon
sulfonation, the aromatic peak at 140 ppm splits into two peaks at 133 and 145
ppm. The peak at 47 ppm in spectrum a is a spinning side band. Residual TEA+
Figure 3.6. 29Si CPMAS NMR spectra of a. PE-MCM-41, b. acetic acid extracted
PE-PS-BEA, c. sulfuric acid extracted PE-BEA-100, and d. acetic acid extracted
(80 °C) PE-CIT-6. T3 peaks are evident at -70 ppm in zeolite samples, while T3,
T2, and T1 peaks appear in PE grafted MCM-41. Q peaks appear at more
Table 3.2. Conductivity of as-made samples from gels with the indicated
SiO2/Al2O3 ratios. Typical SDA content is 20 wt%.
Sample Identity Conductivity (RT/FH) (S/cm)
exchanged form) and that the conductivity observed in these samples does not
arise from a cooperative effect between the bound organic sulfonic acid groups
and the aluminum acid sites. Furthermore, the presence of framework hydroxyl
groups is necessary for increasing the proton conductivity through the formation
of a better hydrogen bonding water network in the pores leading to faster
(24) Holmberg, B. A.; Hwang, S.-J.; Davis, M. E.; Yan, Y. Microporous
Mesoporous Mater.2005, 80, 347.
(25) Takewaki, T.; Beck, L. W.; Davis, M. E. J. Phys. Chem. B 1999, 103,
2674.
(26) Camblor, M. A.; Corma, A.; Mifsud, A.; Perez-Pariente, J.; Valencia, S.
Stud. Surf. Sci. Catal.1997, 105, 341.
(27) Jones, C. W.; Tsuji, K.; Davis, M. E. Microporous Mesoporous Mater.
1999, 33, 223.
(28) Camblor, M. A.; Corma, A.; Valencia, S. Chem. Commun.1996, 2365.
(29) Takewaki, T.; Beck, L. W.; Davis, M. E. Top. Catal.1999, 9, 35.
(30) Camblor, M. A.; Corma, A.; Valencia, S. Chem. Commun.1996, 2365.
(31) Franke, M. E.; Simon, U. Phys. Status Solidi B2000, 218, 287.
(32) Franke, M. E.; Simon, U. ChemPhysChem2004, 5, 465.
(33) Afanassyev, I. S.; Moroz, N. K. Solid State Ionics2003, 160, 125.
(34) Andersen, E. K.; Andersen, I. G. K.; Skou, E.; Yde-Andersen, S. Solid
loading into a Teflon lined stainless steel autoclave. The final molar gel
composition was 1 SiO2:1 KOH:62 H2O:0.65 CTAB. After statically heating at
115 °C for 48 hours, the crystallization products were collected by filtration,
washed with 500 mL of water and 500 mL of acetone, and dried at 100 °C. CTAB
was removed from the pores of MCM-48 by calcination at 550 °C in flowing air.
Organic silanes were grafted onto the surfaces of MCM-41 and MCM-48
using the following procedure. Approximately 1 g of powder was dispersed into
100 mL toluene for 10 minutes with stirring. 0.30 mmol organic silane/g
MCM-41(8) was added by syringe to the dispersion, and the mixture was allowed to stir
for 1 hour before the temperature of the oil bath was increased to 120 °C,
causing the toluene to reflux. Higher loadings were also prepared during this
investigation by using up to 4 mmol organic silane/g MCM-41(8). The grafting
procedure was allowed to proceed for 24 hours. Grafted samples were collected
by filtration and subsequently washed with 1 L of toluene (2 x 500 mL), 1 L of
ethanol (2 x 500 mL), and 2 L of acetone (4 x 500 mL). The aforementioned post
treatments were used to functionalize or modify the attached organic moieties
Figure 4.1. Illustration of the acid groups incorporated into zeolite beta, MCM-41,
and MCM-48.
Figure 4.6. TGA loadings are corroborated by acid titration (samples contacted
with excess 0.01 N NaOH followed by back titration with 0.01 N HCl). Fourier
transform-infrared spectroscopy (FTIR) further verifies post-grafting chemical
modification to produce phosphonic and carboxylic acids (Figure 4.7).
Figure 4.2. X-ray data of i) pure-silica zeolite beta (BEA) containing a. no organic
silane (but uncalcined), b. sulfonated phenethyl groups (S-PE-BEA), c. oxidized
mercaptopropyl groups (S-MP-BEA), d. cleaved diethylphosphatoethyl groups
(P-BEA), and e. cleaved 2-(carbomethoxy)ethyl groups. ii) a. MCM-41, b.
PE-MCM-41, c. MP-PE-MCM-41, d. P-PE-MCM-41, e. C-MCM-41. iii) a. MCM-48, b.
Figure 4.3.29Si CPMAS NMR spectra of i) acetic acid extracted pure-silica beta
samples as follows: a. PE-BEA, b. MP-BEA, c. P-BEA, d. C-BEA. The T3
resonance centered at -70 ppm is indicative of a C-Si-(OSi)3 bond. ii) grafted
MCM-41 samples as follows: a. PE-MCM-41, b. MP-MCM-41, c. P-MCM-41, d.
C-MCM-41. T1, T2, and T3 resonances are clearly seen near -50 ppm, -60 ppm,
and -70 ppm, respectively, indicative of C-Si(OH(3-x))Six where x is from Tx.
Spectra of functionalized MCM-48 samples gave spectra similar to those shown
Figure 4.4. 13C CPMAS NMR of i) pure-silica beta samples as follows: a.
PE-BEA showing two aromatic resonances and two alkyl resonances arising from
the ethyl chain, b. S-PE-BEA showing the same two ethyl resonances but now
three aromatic resonances arising from sulfonation, c. MP-BEA, d. S-MP-BEA, e.
resonance around 25 ppm arising from ethyl carbons. Spectra were collected on
a Bruker Avance 500 MHz spectrometer with a 4 mm rotor. Residual TEA+ gives
rise to resonances near 5 and 50 ppm seen in all spectra. ii) representative
MCM-41 samples as follows: a. PE-MCM-41, b. S-PE-MCM-41, c. MP-MCM-41,
d. S-MP-MCM-41, e. P-MCM-41 before concentrated HCl reflux, f. P-MCM-41
after concentrated HCl reflux, g. C-MCM-41 before HCl reflux, h. C-MCM-41 after
HCl reflux. Spectra of functionalized MCM-48 samples gave spectra similar to
Figure 4.5. 31P CPMAS NMR of HCl refluxed a. P-MCM-41, b. P-MCM-48, and
P-BEA. The resonance centered around 32 ppm arises from the di-acid
phosphorous while the shoulder at lower chemical shift is from phosphorous with
Figure 4.6. Thermogravimetric analysis data of i) acetic acid extracted,
organically functionalized pure-silica beta samples as follows: a. P-BEA b.
C-BEA, c. unsulfonated PE-BEA illustrating the effective removal of most of the
structure directing agent, d. S-MP-BEA, e. S-PE-BEA. ii) representative
functionalized MCM-41 samples as follows: a. unfunctionalized MCM-41, b.
P-MCM-41, c. C-P-MCM-41, d. S-MP-P-MCM-41, e. S-PE-MCM-41. MCM-48 samples
Figure 4.7. FTIR spectra of a. representative MCM-41, b. P-MCM-41 prior to HCl
treatment showing a band at 2990 cm-1 from the ethoxy groups attached to the
phosphorus and a small band at 1390 cm-1 from the P=O., c. HCl treated
P-MCM-41 where the band at 2990 cm-1 is now missing, indicating cleavage of the
ethoxy groups, d. C-MCM-41 prior to HCl treatment showing a band at 1730 cm-1
from the carbonyl and a band at 1460 cm-1 from the methyl ester, e. HCl treated
C-MCM-41 showing a carbonyl band at 1730 cm-1, but no band at 1460 cm-1
Figure 4.8. Representative impedance spectra of functionalized MCM-41
samples. i) C-MCM-41, ii) P-MCM-41, iii) S-MP-MCM-41, iv) S-PE-MCM-41.
higher frequencies and a low frequency tail generally attributed to charge
accumulation at the contacts. Figures in the right column show magnitude and
phase of the impedance as functions of frequency. A minimum in the phase
curve corresponds to the low-frequency, real-axis intercept of the semicircular
with the exception of the carboxylic acid containing samples that show nearly the
same conductivity as the unfunctionalized materials. This is not surprising as the
pKa of propylcarboxylic acid (4.88) is in the range of suggested pKa values for
Table 4.1. MCM-41 samples with higher loading
Sample Identity σ (S/cm)
TGA
Loading (mmol/g)
Acid
Loading (meq/g)
S-PE-MCM-41 8.3E-03 0.59 0.87
S-MP-MCM-41 4.2E-03 0.62 0.68
P-MCM-41 2.0E-03 0.25 a
C-MCM-41 5.7E-05 1.00 0.99
4 mmol/g added to refluxing toluene. The same trend of increasing conductivity
with increasing organic acid strength is observed. Note a. Ran out of material
4.5. Conclusion
In conclusion, pure-silica zeolite beta, MCM-41 and MCM-48 containing
sulfonic acids, phosphonic acid, or carboxylic acid were prepared and
investigated for use as solid electrolytes. Aryl sulfonic acid containing samples
exhibit the highest measured proton conductivity values, followed by propyl
sulfonic acid containing materials, phosphoric acid containing materials and
carboxylic acid materials that were approximately the same as non-organically
modified silicas. MCM-41 and MCM-48 show higher proton conductivities than
corresponding pure-silica zeolite beta samples, and MCM-48 samples are slightly
more conductive than corresponding MCM-41 samples. An aryl sulfonic acid
functionalized zeolite beta sample with hydroxyl groups, however, appears to be
a slightly better proton conductor than the corresponding MCM-48 sample
functionalized to the same acid loading level, although the improvement is small
and would, alone, no industrially justify the increased cost of synthesis of
nanocrystalline materials in comparison to mesoporous materials. Reduced
methanol crossover, however, may provide further benefit to the nanocrystalline
(25) Iler, R. K. The Chemistry of Silica: solubility, Polymerization. Colloid and
Surface Properties, and Biochemistry; John Wiley & Sons, Inc.: New York, 1979.
(26) Rosenholm, J. M.; Czuryszkiewicz, T.; Kleitz, F.; Rosenholm, J. B.;
Linden, M. On the Nature of the Bronsted Acidic Groups on Native and
Functionalized Mesoporous Siliceous SBA-15 as Studied by Benzylamine
Adsorption from Solution, 2007; Vol. 23; pp 4315.
(27) Ong, S.; Zhao, X.; Eisenthal, K. B. Chem. Phys. Lett.1992, 191, 327.
containing zeolites. Figure 5.1 also illustrates the absence of internal cages in
VPI-9 in comparison to the presence of the smaller β cages and larger α cages in
zeolite X or Y. Because of this unique, long-range ordering and the fact that the
framework zinc imparts two anionic framework charge centers per zinc atom, it is
of interest to study the ionic conductivity (as the zincosilicate framework is
electronically insulating) arising from the charge balancing cations within the
pores of VPI-9. While reports on the ionic conductivity of various cations exist for
a handful of the known aluminosilicates, containing single anionic frameworks
sites from framework aluminum, only one report on potential conductivity arising
from octahedrally coordinated titanium sites in ETS-10, a non zeolite,
Figure 5.1. Schematic representation of anionic sites arising from framework
zinc in VPI-9 versus anionic sites arising from framework aluminum in zeolite X.
Dashed lines represent electrostatic interaction of the charge balancing cation
heated to 750 °C for 12 hours to decompose the carbonates. Samples were then
heated to a temperature above their melting temperature (see Table 5.1), held
there for 12 hours, slowly cooled to 650 °C, and then allowed to cool to room
temperature. Upon removal from the platinum crucible, all samples appeared
glassy. The resulting materials were ground to fine powders, pressed axially into
pellets with a hydraulic press between tungsten carbide dies, and heated to a
crystallization temperature (see Table 5.1) for 60 hours. This process was
repeated until no changes in the powder X-ray diffractograms were observed
Table 5.1. Synthesis, Crystallization, and Sintering Temperatures for Dense
Zincosilicates.
Synthesis (°C) Crystallization (°C) Sintering (°C)
K2ZnSi2O6 1150 850 900
K2ZnSi3O8 1050 850 900
K2ZnSi4O10 1050 850 900
K2ZnSi5O12 1075 850 900
Rb2ZnSi5O12 1350 850 900
the results obtained. Sample compositions have been normalized to silicon.
Lithium is not detectable by EDS, so lithium exchange was monitored and
inferred by the disappearance of potassium and rubidium in VPI-9 and sodium in
zeolite X. Peaks arising from strontium and silicon overlap in the EDS spectra, so
strontium exchange was also monitored by the disappearance of the
aforementioned elements. VPI-9 and zeolite X containing alkali metals as the
charge balancing cation all appear slightly deficient in the alkali cation. This may
be an artifact of the EDS method as alkali exchanged zeolite X and potassium,
rubidium, and cesium containing dense zincosilicates exhibit similar deficiencies.
Magnesium and calcium exchanged samples appear closer to the as-expected
1:1, M:Zn (M = Mg, Ca). With the exception of Sr-VPI-9, in which occasional
grains contained trace potassium (less than 1 atomic %), all exchanges appear
quantitative. Zeolite X, however, is known to not fully exchange with all alkali and
alkaline earth cations, and the exchange levels achieved correspond to the
maximum exchange levels, as suggested by Breck.43 Quantitative exchange was
achieved in K-X, Ca-X, and Sr-X. All materials characterized by EDS also show
Table 5.2. EDS Elemental Analysis Results for Ion Exchanged VPI-9 and Zeolite
X Samples.
M Si Zn O M Si Al O Na
Li-VPI-9 NDa 4 1.0 11.8 Li-X NDa 1 0.8 6.0 0.1
Na-VPI-9 1.6 4 1.0 11.2 Na-X 0.7 1 0.8 5.1 -
K-VPI-9 1.7 4 1.0 14.4 K-X 0.6 1 0.8 4.9 NDc
Rb-VPI-9 1.4 4 1.0 12.5 Rb-X 0.3 1 0.7 5.0 0.2
Cs-VPI-9 1.8 4 1.0 12.1 Cs-X 0.3 1 0.8 5.3 0.2
Mg-VPI-9 0.9 4 1.0 12.4 Mg-X 0.4 1 0.8 6.2 0.1
Ca-VPI-9 1.0 4 0.9 13.6 Ca-X 0.3 1 0.8 5.9 NDc
Sr-VPI-9b Sr-Xb NDc
ND - none detected
a. lithium is not detectable by this EDS instrument
dehydrated zeolite X samples (not shown) all remained crystalline and exhibited
Figure 5.2. a) Powder X-ray diffractograms of ion exchanged VPI-9 showing,
with perhaps the exception of Mg-VPI-9, that VPI-9 structure is maintained after
ion exchange. b) X-ray diffractograms of vacuum dehydrated pellets of
5.4.3. Impedance Spectroscopy
Impedance spectroscopy is performed to investigate the ionic conductivity
of VPI-9 (and zeolite X) exchanged with various alkali and alkaline earth cations.
Using a parallel plate capacitor structure, the impedance is measured and the
conductivity extracted by scaling the direct current DC resistance with the
cross-sectional area of the capacitor structure and thickness of the pellet, typically
300-600 μm. Typical impedance spectra are shown in Figure 5.3 for potassium
exchanged VPI-9 and zeolite X at 350 °C, and data exhibit a high frequency,
depressed semicircle and the often observed low frequency tail indicative of ionic
conductivity (normally attributed to the ionically blocking nature of gold or other
metallic contacts). The DC resistance of each sample is read from the low
frequency intercept of the semicircular arc with the real axis or by curve-fitting a
semicircular arc to the data and extrapolating to the Z’ axis. While curves for both
K-VPI-9 and K-X are shown in the same figure, note the different scales for each
Figure 5.3. Typical impedance spectra showing high-frequency semicircular arc
and low frequency “tail” arising from contact effects. Notice the different scales
5.4.4. Ionic Conductivity and Activation Energy in M+-VPI-9
Impedance spectra recorded from 450 °C to room temperature were used
to calculate the conductivity of each sample as a function of temperature, and the
data, presented in terms of the product of the DC conductivity, σDC, and the
temperature are plotted versus the inverse temperature in Figure 5.4a for
monovalent cation exchanged samples and in Figure 5.4b for divalent cation
exchanged samples. Open markers indicate zeolite X samples while filled
markers correspond to VPI-9 samples. All samples display activated transport
behavior, that is decreasing conductivity with decreasing sample temperature. To
help elucidate trends in conductivity with ionic radius, the conductivity of each
ion-exchanged sample, measured at 400 °C, is plotted versus ionic radius for
both mono- and divalent exchanged samples of VPI-9 and zeolite X in Figure
5.5a. Activation energy for each sample is extracted from the slope of the
Figure 5.4. Ionic conductivity presented as the natural log of the product of
conductivity and temperature versus the inverse temperature for a) monovalent
exchanged zeolite X samples shown with open markers, and monovalent
exchanged VPI-9 samples shown with filled markers, and b) divalent exchanged
zeolite X samples shown with open markers, and monovalent exchanged VPI-9
samples shown with filled markers. Lines connecting markers are for the eyes’
Figure 5.5. a) Ionic conductivity at 400 °C of mono- and divalent exchanged
zeolite X and VPI-9 shown as a function of cation radius. b) activation energy of
mono- and divalent exchanged zeolite X and VPI-9 shown as a function of cation
radius. Arrows in both a) and b) point to amorphous Li-, Na-, and Mg-VPI-9
removed from one another, could lead to a reduced number of mobile cations
and a reduced number of accessible hopping sites (increasing the distance
between available sites, decreasing the conductivity47), thereby decreasing the
conductivity and increasing the hopping activation energy in zeolite X. The
physical 3-dimensional situation is clearly more complicated as cations will reside
in the most stable coordination sites, but sites arising from zinc are, undoubtedly,
electrostatically different than those arising from aluminum.
Interestingly, while it may be expected that the electrostatic interaction
between divalent cationic and anion charges would lead to significantly increased
transport activation energy, this is not is what has been experimentally observed
Figure 5.6. a) Framework zinc creates two anionic sites in close proximity to one
another providing a more uniform site for divalent cations than can be obtained
with zeolites. b) and c) show two hypothetical situations to charge balance a
divalent cation with two individual framework sites. The two situations appear
different from the perspective of the cation, and will have different associated
appear similar to one another, with peaks shifting to smaller 2θ values with
increasing size of the alkali cation, Cs+ > Rb+ > K+.
EDS results from crystallized compounds are shown in Table 5.3, and, as
previously mentioned, crystallized samples are slightly deficient in the alkali
cations and show a surplus of oxygen. Volatilization of the alkali metal is not
ruled out, but is not believed to be significant, as ion exchanged VPI-9 and
zeolite X samples show a similar deficiency by EDS, and powder X-ray diffraction
indicates the appropriate phases (with the exception of K2ZnSi2O6 for which the
Table 5.3. EDS Elemental analysis results for crystallized dense zincosilicates.
Ma Si Zn O
K2ZnSi2O6 1.6 2 1.1 7.4
K2ZnSi3O8 1.9 3 1.1 9.2
K2ZnSi4O10 1.8 4 1.2 12.6
K2ZnSi5O12 1.6 5 1.1 14.8
Rb2ZnSi5O12 1.7 5 1.1 14.8
Cs2ZnSi5O12 1.7 5 1.0 14.6
the conductivity of K2ZnSi5O12 at 400 °C as an estimate for what the conductivity
of hypothetical Rb2ZnSi4O10 and Cs2ZnSi4O10 would be if they were to exist, a
factor of four improvement could be suggested. These hypothetical
conductivities, and indeed the conductivity of dense K2ZnSi4O10 compared to
K-VPI-9, are dramatically lower than the conductivities observed in their
microporous counterparts.
Figure 5.9b shows that the trend in conductivity with ionic radius is the
same for both VPI-9 and M2ZnSi5O12; Rb > K > Cs. Activation energies of
corresponding microporous and dense samples also show the same trend, that is
decreasing from potassium to rubidium and then increasing from rubidium to
cesium. It is interesting to note that the activation energy for M2ZnSi5O12 is nearly