International Journal of Scientific Research in Computer Science, Engineering and Information Technology © 2018 IJSRCSEIT | Volume 3 | Issue 1 | ISSN : 2456-3307
Performance Evaluation of Wind Turbine Generator System
P. Nixon Paul Abraham*1, Y. Ireaneus Anna Rejani2, Dr. T. Revathi3*1Manonmanium Sundaranar University, Tirunelveli, Tamil Nadu, India 2KIIT College of Engineering, Gurgaon, New Delhi, India 3Mepco Schlenk Engineering College, Sivakasi, Tamil Nadu, India
ABSTRACT
In this paper, the performance evaluation of Wind Turbine Generator System has been carried out using a technique which uses unpublished collected field data for 5 months from May 2016 to September 2016 at Porbandar, India. The inputs for this analysis are such as temperature, pressure, wind speed, wind direction and wind turbine power curve. The results demonstrate that this is an efficient methodology for performance evaluation of Wind Turbine Generator System.
Keywords: Wind Turbine Generator System, Performance evaluation, Wind Energy Conversion System, Energy output evaluation.
I.
INTRODUCTION
Energy plays an integral part in the development of human kind. Among the different renewable energy sources, wind energy is making significant contribution to the installed capacity of power generation and it is emerging as an competitive option to fossil fuel based power generation. Wind electric generator is ingeniously devised to convert kinetic energy from the air in motion directly into electricity without using conventional sources like coal, oil or natural gas for power generation. The advantages of harnessing wind energy are wind energy is freely available, the production and use of wind energy does not pollute the atmosphere, wind energy does not contribute to green house effects, a wind farm irrespective of its size has a low gestation period etc. To maximize the use of wind generated electricity, when connected to the electric grid, it is important to estimate and predict the power produced by wind energy converter. The power generated by the wind turbines changes rapidly because of continuous fluctuation of wind speed and wind direction. Wind power can be affected by many factors such as air density, vertical wind profile, time
of a day and seasons of a year and usually fluctuates rapidly, imposing considerable difficulties on the management of combined electric power system[1-3]. It is important for the power industry to evaluate the efficiency of the energy generated though the wind turbine in order to ensure the power generation is maximized [4]. It is vital to assess the wind power potential of the place as much as accuracy as possible [5]. During the past two decades, wind energy technology has evolved to the point where it can compete with conventional forms of power generation at good sites [6]. Costs have declined 12– 18% for each doubling of global capacity. The average cost of wind-generated electricity has fallen. The Global Wind Energy Council [9]states that wind energy developments have occurred in more than 70 countries around the world.
Many techniques have been emerged to estimate the power produced by wind turbines. The estimation of power generation is carried out by comparing generated power to the manufacturers rating for a given wind speed [10]. Many input variables can be used that are related to weather at site, geography and operational aspects[11].Variables such as 10 minutes average wind velocity, its standard deviation, wind direction, air density, seasons of a year, time of a day are used as input parameters for energy estimation[10],[11],[12]. Input variables such as longitude, latitude, altitude and tower height are used to estimate wind energy potential by the authors of [13].
In this paper, the evaluation of energy output is carried out by using a novel technique. The inputs for these analyses are such as temperature, pressure, wind speed, wind direction and wind turbine power curve.
This paper present a method to evaluate the energy output of Wind Turbine Generator installed at 40 kilometers from Porbandar, India. Unpublished collected field data for a period of 5 months from May 2016 to September 2016 is used for the analysis.
II.
PERFORMANCE EVALUATION
The Wind Turbine Generator system evaluation has been conducted on one Wind Turbine Generator in accordance with the IEC 61400-12-1 standard. The test period has been between the months of May to September (inclusive).
A. Procedure
The procedure contains minor deviations (as described in subsequent sections) from the procedure set forth in the international standard IEC 61400-12-1 2005 Power performance measurements of electricity producing wind turbines (referred to herein as IEC 61400-12-1),
B. Wind Turbine Generator (WTG)
The Wind Turbine Generator is Enercon make, Gearless type, 53 meter diameter Glass fiber reinforced epoxy blade, variable pitch (independent electric pitch of 0.96o to 91.93o) of rated power 800
KW at wind speed 13m/s with hub height of 75meter.
C. Wind Mast
The wind mast is located at 2.66 times the rotor diameter of the WTG, which is at a distance of 140.9 m from the WTG location and the wind mast is oriented 244° from the WTG with respect to true north.
A lattice tower has been used and the wind monitoring mast was installed with wind and environment sensors.
It is noted that the orientation of the anemometer booms, guy wires, and meteorological sensor mounting complies with the orientation prescribed in the IEC 61400-12-1 Standard (Annex G and section 6). The location of the wind mast complies with the IEC 61400-12-1 Standard.
D.Test Site
The site is located approximately 40 kilometers from Porbandar, India.
1) Measurement Sector Evaluation
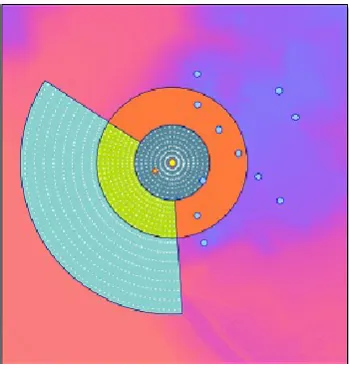
Figure 1. Obstacle layout
In the above Figure 1, orange dot shows the WTG, red dot shows the wind mast and blue dots show the neighbouring WTGs. The pink shaded region shows little terrain complexity and the violet shade region represents the higher terrain complexity. The green shaded sector shows the valid measurement sector.
2) Terrain Slope Variations
We have assessed the site terrain conditions with reference to the WTG and nearby WTGs, and determined that the slope variations are within the acceptable limits.
III.
TEST EQUIPMENT
The details of the test equipment and
instrumentation are discussed in the following subsections
A.Meteorological measurements
The wind mast is mounted with cup anemometer, wind vane, relative humidity, temperature probe, barometer sensors to measure the wind speed, wind direction, relative humidity, temperature and pressure respectively. All the analogue and digital output signals from the wind mast sensors were directly connected to the CR1000 data logger, which is located inside the tower bottom of the WTG.
B. Power measurements
WTG status measurements measure the data of the machine status and grid status. A potential free contact relay was attached with the main power contactor in series with a 2.5V D.C adaptor provides the two status output signals. The machine status measures data when the machine (WTG) is fully available to transmit power from the WTG while the grid status data measures data when the grid is fully available for transmitting power to the power grid.
C. Data logger
The CR1000 data logger from Campbell Scientific Incorporation was deployed for the power curve measurements. This data logger was attached with a
GSM communication module, which can
simultaneously provide measurement, and
communication functions remotely.
The data logger was housed inside weather resistant enclosure with necessary electrical transient protection device and was provided with earthing. The data logger was provided with battery backup for uninterrupted operation. The data logger system is located inside the WTG tower base adjacent to the WTG control panel. The specification of the data logger is compliant with the IEC 61400-12-1 standard.
D. Instrumentation
The installation of sensors, wind mast and measurement equipment was compliant with the IEC-61400-12-1 standard.
E. Methodology
Frequent site visits were carried out during the data collection period to enable the verification of the instrumentation and sensors/transducers installed on the wind mast and WTG.
marked as invalid and only periods in which the WTG was entirely online were considered as valid.
1) Valid measurement sectors
The measured raw wind data from the data logger was analysed and any erroneous data was removed from the dataset. The cleaned dataset was further refined to exclude data from invalid measurement sectors, grid status and machine status.
2) Grid status machine (WTG) is fully available to transmit power from the WTG.
4) Rainfall
The rainfall data was not collected at this site. Hence it was not been able to exclude data due to rainfall which may impact the result of this verification and
this is not strictly in conformance with IEC 61400-12-1.
5) Air density adjustment
The air density is calculated for each 10 minute period from the air temperature and pressure using the formula shown below where P is the barometric pressure, R is the specific gas constant for dry air and T is the temperature.
The range of wind speeds used in this assessment is in accordance to the IEC 61400-12-1: Power performance measurements of electricity producing wind turbines. In this case, the wind speed range extending from 1 m/s below cut-in to a wind speed at 85% of the rated power of the WTG is divided into 0.5m/s contiguous bins centred on multiples of 0.5m/s.
7) WTG electric power output
The electric power output of the WTG data has been taken directly from data logger data through a power measurement device (power transducer). Therefore, the measured power data used in this verification is strictly in compliant with the IEC 61400-12-1.
8) Data acceptance criterion
The conditions for data filtering are as (i) Grid Status:1000mv, (ii) Machine status:1000mv and (iii) valid measurement sector:176.1o and 303.0o .
9) Annual Energy Production
The annual energy production of the turbine is calculated using the software from the measured power curve and for a number of different Weibull distributions of selected mean wind speed. The availability of the WTG is assumed to be 100%. The energy production is calculated from the formula
(3)
where, P(V) is the piecewise linear power curve and f(V) is the Weibull distribution:
(4)
The parameter A is calculated from the ɼ -function of the mean wind speed and the form factor k.
(5)
The Rayleigh distribution is equal to a Weibull distribution with the form factor equal to 2.
IV.
RESULTS
A.Database Properties
The Data logger has collected data in the WTG for the period from 1 May 2016 to 31 September 2016 containing 15422 numbers of 10 minute data sets.
B. Annual Energy Production
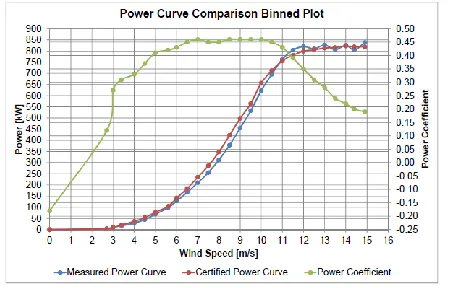
The Certified Power Curve was applied to the wind speed distribution over the test period, and compared against the actual production values taken from the data logger data. The comparisons between the results of the assessment are as shown in the following figure 2.
Figure 2. Measured & Power Curve Coefficient as a function of Wind Speed binned plot
The Gross Expected Energy Generation does not include any losses (e.g. due to grid and WTG availability). Note that availability is not taken into consideration in these calculations since only data while the WTG is operational (i.e. when both WTG and grid are available) has been used in this analysis, hence it is considered to be 100% availability during the filtered data period.
V.
CONCLUSION
It can be seen from the results presented above that the measured power curve and the measured energy production meets 95.8% of the Net Expected Energy Generation.
VI.
REFERENCES
[1]. A.N. Celik,"A statistical analysis of wind power density based on the Weibull and Rayleigh models at the southern region of Turkey," Renewable energy vol. 29, pp. 593–604, 2003. [2]. E. Cam, E. Arcaklioglu, A. Cavusoglu, and B.
Akbiyik,"A classification mechanism for determining average wind speed and power in several regions of Turkey using artificial neural networks,"Renewable energy vol. 30, pp. 227– 239, 2000.
[3]. P.Gipe,“Wind power: renewable energy for home, farm and business" Chelsea Green Publishing Company,Vermont, USA, 2004 [4]. J.Park,“Common sense: wind energy"California
Office of Appropriate Technology, USA, 1983 [5]. http://www.awea.org/faq/basicwr.html
[6]. J.L Swain,"Mainstreaming renewable energy in the 21st
[7]. Global Wind Energy Council: 'Latest news: global wind energy markets continue to boom – 2006 another record year’, 2006 S. Li, D. C.Wunsch, E. A. O’Hair, and M. G. Giesselmann,"Using neural networks to estimate wind turbine power generation," IEEE Trans. Energy Convers., vol. 16, no. 3, pp. 276–282, Sep. 2001.
[8]. Mabel, M. C.,Fernandez E. Estimation of Energy Yield From Wind Farms Using Artifical Neural Networks. IEEE Trans. Energy Convers., vol. 24, no. 2, pp. 459–464, Jun.2009.
[9]. T. G. Barbounis, J. B. Theocharis,M. C. Alexiadis, and P. S. Dokopoulos,“Long-term wind speed and power forecasting using local recurrent neural network models," IEEE Trans. Energy Convers., vol. 21, no. 1, pp. 273–284, Mar. 2006.
turbine power curve estimation," J. Solar Eng., vol. 123, pp. 327–332, Nov. 2001.
[11]. S. Kelouwani and K. Agbossou,"Nonlinear model identification of wind turbine with a neural network," IEEE Trans. Energy Convers., vol. 19,no. 3, pp. 607–612, Sep. 2004.
[12]. E. Cam, E. Arcaklıoglu, A. Cavusoglu, and B. Akbıyık,"A classification mechanism for determining average wind speed and power in several regions of Turkey using artificial neural networks," Renewable Energy, vol. 30, pp. 227– 239, 2005.
[13]. D. A. Bechrakis and P. D. Sparis,"Correlation of wind speed between neighboring measuring stations," IEEE Trans. Energy Convers., vol. 19,no. 2, pp. 400–406, Jun. 2004.