CSEIT1722293 | Received : 10 April 2017 | Accepted : 20 April 2017 | March-April-2017 [(2)2: 895-900]
International Journal of Scientific Research in Computer Science, Engineering and Information Technology © 2017 IJSRCSEIT | Volume 2 | Issue 2 | ISSN : 2456-3307
895
Enhanced Image Object Recognition system using Correlation
Filter based on Optimization
Atul Kumar Dwivedi, Babita Sahu
Department of Electronics and Telecommunication Engineering, BIT Durg, India
ABSTRACT
Object recognition refers to finding a given object in an image or video sequence based on physical properties of the object. Object recognition has been a challenging computer vision problem with various real-world applications from a very long time. In this paper we show Object recognition by correlation filtering consists in calculation of cross correlation function between an test image and noisy query image, this work aims to bring a promising perspective for using correlation filter. In order to reduced noise and perform an optimization algorithm .Based on optimization method, correlation filter has been proposed. The proposed filter has been tested to recognize an object at different noise condition. The proposed filter has been evaluated in terms of peak to side lobe ratio (PSR) and peak to correlation energy (PCE) between the query image and test image for various noise conditions.
Keywords : Finite Impulse Response, Nelder Mead Simplex Search Optimization, Correlation Filter.
I.
INTRODUCTION
Correlation filter design is a technique for detecting known object in random noisy image. Using correlation filter to detect a known object is frequently called matched filtering. Correlation filters are used for object localization, tracking, security, and surveillance, object alignment, object detection and classification. The correlation filter allows computing a image against itself or any number of images, assuming that the computational overhead associated with such a large number of comparisons is feasible on hardware. Applications of correlation filter include alignment of 3D object from 2D image [1], palm-print classification [2], A still to video face verification system [3], classification of tumour subtype [4], pattern recognition [5], radar detection and classification [6], face recognition [7], object localization and classification [8], object recognition [9], object tracking [10–15] etc. CFs possess many useful properties that make them capable for these task. 1) Shift-invariant: that means no need for centering the test image. 2)Can handle multiple appearances of the reference image in the test image. 3)Closed-form of solution based on
well-defined metrics. 4)CFs are performing both the classification and localization simultaneously, Which means CFs do not assume prior segmentation of objects in test scene. These properties make CFs attractive for different applications. Vishnu Naresh Boddeti extend the traditional CF design principles to design templates as a cryptographic key for security purpose to bound class specific information which perform pattern matching ,also have key binding functionality and for bounding the template increase the length of key and improve the failure rate for retrieving the information and design performance. This cryptographic key released only a successful match between query pattern and corresponding template[17]. Pattern recognition by using binary search procedure and design a composite filters based on multi-objective optimization iterative algorithm presented by Ramirez [5].
The CF template is smaller than this test image. In the simplest sense, correlation filtering is the process of computing the cross-correlation between an input image and a template. This process can be proceeded by efficiently using a fast Fourier transform algorithm. A well designed template will produce sharp peaks in the correlation output when the input image contains target Pattern, and the peak locations will correspond to the target coordinates in the input.
In this paper, the impact of noise in correlation output in term of PSR and PCE value has been investigate by considering three different noise models. In first case, correlation value find out in the absence of noise. Second case, correlation value find out in the presence of different types of noise and third case, noise is removed from query image or given image by various filter design method than perform cross correlation and find out correlation value. We compare all these value and demonstrate that the which filter is better for de-noising and gives better result from others filtering method.
The organization of this paper is as follows. In Section 2 explain the details of Design considerations. In Section 3 present the process of optimization algorithm. In section 4 discuss about Result and discussion. Discuss conclusion in Section 5.
II.
DESIGN CONSIDERATIONS
Correlation Filter:
A correlation filter is a special frequency array. (equivalently, a template in the image domain)that is specially designed from a set of training images that are representative of a particular class (a class could be a single image or even a group of individuals). The template is compare to a query image by obtaining the cross correlation as a function of relative shift between the template and the special frequency domain
i.e. (1) (1)
Where is the 2D Fourier transform (FT) of the query image and is the CF (i.e. 2D Fourier template) and C(u,v) is the 2D FT of the correlation output with subscript * denoting the complex conjugate. Since the image and their FTs are discrete-indexed, FT here refers to the discrete Fourier transform (DFT) which is implemented via Fast Fourier
Transform (FFT) algorithm. The CFs are usually designed to give a sharp peak at the center of the correlation output plane c(x, y) for a centered authentic query image and no sharp peak for an impostor. Cross correlation is a standard method of estimating the degree to which two series are correlated. Consider two series x(i) and y(i) where i=0,1,2……N-1. The cross correlation r at delay d is defined as
∑
√∑ √∑ (2)
where and are the means of the corresponding series, the equation(1) computed for all delays d=0,1,2….N-1.
To evaluate the correlation value in terms of peak to side- lobe ratio (PSR) and peak to correlation energy(PCE). There are many performance measures for correlation filters. PSR and PCE will be one of the commonly used methods to measure the correlation output. The peak-to-sidelobe ratio (PSR) can be formed by
(3)
Where peak indices the correlation output and the mean and standard deviation ( ) comes from sidelobe region surrounding the peak region. Here peak is the maximum value of correlation and mean is the mean value of correlation and ( ) is the standard deviation of correlation. Another peak sharpness fitness metric is the peak-to- correlation energy (PCE) which is defined as the correlation peak and energy in correlation plane.
∬ (4)
Where c(0,0) is the correlation peak and the denominator term is the energy in the correlation plane.
III.
OPTIMIZATION ALGORITHM
Nelder mead algorithm:
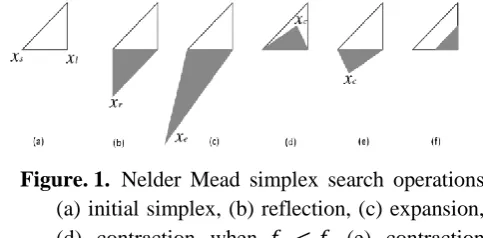
simplex is taken as the origin, then the D other points define vector directions that span the D-dimensional vector space. This algorithm is operated using four basic procedures i.e. reflection, expansion, contraction and shrinkage. Iteratively these operations are performed on the simplex, based on which its position is updated and it moves closer to the optimal solution.
Figure. 1. Nelder Mead simplex search operations (a) initial simplex, (b) reflection, (c) expansion, (d) contraction when (e) contraction when (f) Shrinkage [32]
The steps in the NMSS algorithm are as follows
1. The simplex reflection coefficient expansion coefficient , the contraction coefficient and the shrinkage coefficient are initialized. Simplex is initialized by randomly generated D+1 vertices in the search space and later objective function is evaluated at every vertex of the simplex.
2. Three vertices are selected, that indicate the highest, second highest and the lowest function values. If
, represent highest second highest and lowest function values, The centroid point ̅ is calculated using these three points.
3. A new vertex is generated by reflecting the worst point as
̅ ̅
(5)
Value of objective function is calculated using reflection point. It is compared with . If , go to step-4. If , accept the reflection by replacing with and go to step 7. If
go to step 7. If , the algorithm from step 5 is continued.
4. Expansion, The reflection is expanded if Expansion of simplex provides wider search space in the direction of reflection. Expansion point is calculated as
̅ ̅ (6)
The objective function ( is evaluated over this vertex. if the expansion is accepted by replacing with otherwise with . Go to step 7.
5. Contraction, operation is performed if and
by replacing with . When , direct contraction without the replacement of by is performed. The contraction vertex is calculated as
̅
(7)
if , the contraction is accepted by replacing by and go to step -7. Otherwise go to step-6. 6. Shrinkage, if contraction in step-5 fails, then
shrinkage is attempted. Shrinkage is done by shrinking all points of the entire simplex except as given below
(8)
7. If a termination condition is met, calculations are stopped. Otherwise a new iteration should be started from step-2.
Correlation in the Presence of Noise
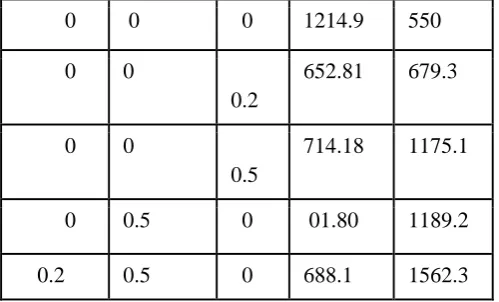
We added Gaussian noise and salt & pepper noise in the query image. This query image find out from the test image in presence of noise and perform cross correlation between query image and test image .This correlation produces peak when the query image present in the test scene. This obtained peak is not sharp because of noise. The effect of noise in the correlation output value in terms of peak to side-lobe ratio and peak to correlation energy shown in the table 1.
Fig 2. Object recognition in the presence of noise.
Table1. The effect of noise in terms of PSR and PCE
Gaussia n noise mean
Gaussia n noise variance
Salt & pepp er
0 0 0 1214.9 550
0 0 0.2
652.81 679.3
0 0 0.5
714.18 1175.1
0 0.5 0 01.80 1189.2
0.2 0.5 0 688.1 1562.3
Noise Is Removed From Query Image By Using Various Filter Design Method
Noise is present in the query image or given image causes PSR decreases and PCE increases. To increase the PSR and reducing the PCE at desired level apply three different types of filter. Based on their result define that which filter is better for removing noise and give a better response of correlation output. After removing noise correlation is performed between query image and test image. Fig3 show that the filtering and noise removal block diagram
Figure 3. object recognition by correlation filter
Wiener Filter
Wiener filter works good when the noise is constant-power (white) additive noise, such as Gaussian noise. Wiener filter estimates the local mean and variance around each pixel the local mean defined by (9) and variance (10)
∑ (9)
∑ ( ) (10)
Where is the N-by-M local neighborhood of each pixel in the image .wiener filter then create a pixel-wise. Wiener filter using these estimates,
(11)
where v2 is the noise variance. If the noise variance is not given, wiener filter uses the average of all the local estimated variances.
Median filter
Median filtering is a specific case of order-statistic filtering, also known as rank filtering. Median filtering is similar to using an averaging filter, in that each output pixel is set to an average of the pixel value in the neighborhood of the corresponding input pixel. However, with median filtering, the value of an output pixel is determined by the median of the neighborhood pixels, rather than the mean. Medfilt2 performs median filtering of the matrix. Any image which have two dimensions matrix. Each output pixel contains the median value in the M-by-N neighborhood around the corresponding pixel in the input image. Medfilt2 pads the image with zeros on the edges, so the median values for the points within [MN]/2 of the edges may appear distorted.
Average filter
An averaging filter is useful for removing grain noise from a photograph. Because each pixel gets set to the average of the pixels in its neighbourhood, local variations caused by grain are reduced. F-special averaging filters the data in x matrix with two-dimensional FIR filter in the matrix h (h is a special filter). It computes the result, using two dimensional correlation, and returns the central part of the correlation that is the same size as x. Two-dimensional correlation is equivalent to two dimensional convolution with the filter matrix rotated 180 degrees.
Table 2. PSR and PCE value after filtering operation.
Filter
GN Salt & pepper noise
PSR PCE mean Variance
Wiener 0 0.2 0 669.3 900.4 Wiener 0 0.5 0 696.82 1166.6 Wiener 0.2 0.5 0 692.37 1570.7 Wiener 0 0 0.2 638.98 670.66
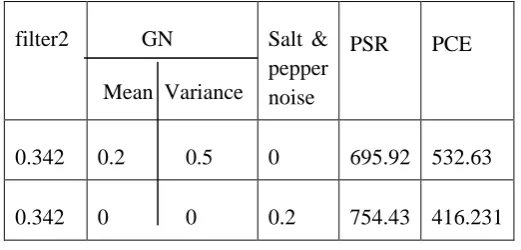
Table 3. PSR & PCE value after optimization operation.
filter2 GN
Mean Variance
Salt & pepper noise
PSR PCE
0.342 0.2 0.5 0 695.92 532.63
0.342 0 0 0.2 754.43 416.231
IV.
RESULTS AND DISCUSSION
In this paper, investigate that the correlation value changes by applying a different level of noise. Two performance criteria is used to measure the correlation output. This paper presents the performance of correlation filter after filtering the noisy image and also include the comparison with the three different filter model, from the experimental results, median filter show the best performance for both the Gaussian noise(GN) with zero mean and 0.5 variance and salt & pepper noise with 0.2. We are taking a cameraman.tif image of size . The given image (template or part of test image) of x dimension and y dimension . All correlation planes are normalized before recognition i.e. the largest value in correlation plane is normalized to 1. Added Gaussian noise with the template and find the correlation value in table1. After applying a median ,average and wiener filter obtain a result in terms of PSR and PCE. Comparing all the three filter result and demonstrate that the median filter gives the PSR=697.06 and PCE=525.98 which is better result for others because after applying median filter PSR increases and PCE decreases which is goes to standard value(PSR=1214.9, PCE=550). When the salt & pepper noise (0.2) is added to the template, this template is corrupted by noise after than apply a median filter that provides a values of PSR=666.5 and PCE=408.09. Again apply a average filter and perform correlation between the test image and noisy templates, which give a value of PSR=608.69 and PCE=6.92. Third model of filter i.e. wiener filter is apply to noisy template and perform correlation between test image and de-noising template
image which gives PSR=638.98 and PCE=670.66. Based on all above three results of three different filter model we conclude that median filter provide a good result but not optimum. To achieve optimum value of PSR and PCE, Nelder Mead Algorithm is used. After applying Nelder mead algorithm, minimum value 0.3422 have been found. This minimum value used as a proposed filter to remove noise and get a value of PSR=695.9, PCE=532.6 for Gaussian noise of 0.2 mean & 0.5 variance and for salt & pepper noise (0.2) PSR and PCE value will be 754.43, 416.23 respectively.
V.
CONCLUSION
In this paper, we observed that the PSR and PCE value in different noise condition. According to the experimental result we conclude that the object recognition by correlation filter has been verified. To improve the noise performance we require the filter to minimize the noise energy. Nelder Mead Algorithm is used to find minimum. These minimum values reduced the noise and improve the performance of object recognition.
VI.
REFERENCES
[1]. V. N. Boddeti, T. Kanade, and B. V. K. V. Kumar, “Correlation filters for object alignment,” Proc. IEEE Comput. Soc. Conf. Comput. Vis. Pattern Recognit., pp. 2291–2298, 2013.
[2]. P. H. Hennings-Yeomans, B. V. K. Vijaya Kumar, and M. Savvides, “Palmprint classification using multiple advanced correlation filters and palm-specific segmentation,” IEEE Trans. Inf. Forensics Secur., vol. 2, no. 3, pp. 613–622, 2007.
[3]. C. Y. Xie, B. Kumar, S. Palanivel, and B. Yegnanarayana, “A still-to-video face verification system using advanced correlation filters,” Biometric Authentication, Proc., vol. 3072, pp. 102–108, 2004.
[4]. S. L. Wang, Y. H. Zhu, W. Jia, and D. S. Huang, “Robust classification method of tumor subtype by using correlation filters,” IEEE/ACM Trans. Comput. Biol. Bioinforma., vol. 9, no. 2, pp. 580–591, 2012.
multi-objective combinatorial optimization,” Opt. Commun., vol. 338, pp. 77–89, 2015.
[6]. M. S. Aperture, R. Detection, and R. K. Singh, “Electrical & Computer,” 2002.
[7]. X. Zhu, S. Liao, Z. Lei, R. Liu, and S. Li, “Feature Correlation Filter for Face Recognition,” Adv. Biometrics, pp. 77–86, 2007. [8]. J. A. Fernandez and B. V. K. Vijaya Kumar,
“Partial-aliasing correlation filters,” IEEE Trans. Signal Process., vol. 63, no. 4, pp. 921–934, 2015.
[9]. A. Gautam, “The Concept of Object Recognition,” vol. 5, no. 3, pp. 352–355, 2015. [10]. M. Danelljan, G. Hager, F. S. Khan, and M.
Felsberg, “Convolutional Features for Correlation Filter Based Visual Tracking,” Proc. IEEE Int. Conf. Comput. Vis., vol. 2016–Febru, pp. 621–629, 2016.
[11]. Z. Chen, Z. Hong, and D. Tao, “An Experimental Survey on Correlation Filter-based Tracking,” arXiv, pp. 1–13, 2014.
[12]. M. Danelljan, A. Robinson, F. S. Khan, and M. Felsberg, “Supplementary Material Convolution Operators for Visual Tracking,” Eccv, no. 5, pp. 1–9, 2016.
[13]. S. Liu, T. Zhang, X. Cao, and C. Xu, “Structural Correlation Filter for Robust Visual Tracking,” Cvpr, pp. 4312–4320, 2016
[14]. L. Zhang, D. Bi, Y. Zha, S. Gao, H. Wang, and T. Ku, “Robust and fast visual tracking via spatial kernel phase correlation filter,” Neurocomputing, vol. 204, pp. 77–86, 2015. [15]. S. Duffner and C. Garcia, “Using discriminative
motion context for on-line visual object tracking Using discriminative motion context for on-line visual object tracking. IEEE Transactions on Circuits and Systems for,” 2016.
[16]. M. Danelljan, G. Hager, F. S. Khan, and M. Felsberg, “Learning spatially regularized correlation filters for visual tracking,” in Proceedings of the IEEE International Conference on Computer Vision, 2016, vol. 11– 18–Dece, pp. 4310–4318.