80 Li-mei Chen
2.3 Acoustic Analysis
The analysis in this current study was mainly based on Goberman and Robb (1999). A cry episode of infants was defined as the duration of the continuous cry utterance, beginning with the first audible cry utterance after the pain stimulus, and an episode was completed as soon as the infants stopped cry. The non-voiced parts of a cry episode were first edited out in the cry utterance, making a “non-partitioned cry episode” (Goberman & Robb, 1999). In this current study, the inspiratory cry was eliminated, and only the phonatory parts were analyzed. Then, a non-partitioned episode was divided into three partitions with the same length of durations (P1, P2, P3). P1, P2, P3 are regarded as the early, middle, and late sections of the cry episode, respectively, corresponding to the attack, cruise, and subdual phases of a cry episode as suggested by Truby and Lind (1965). Unedited cry duration, percent phonation, first spectral peak, mean spectral energy, spectral tilt, and high frequency energy were measured.
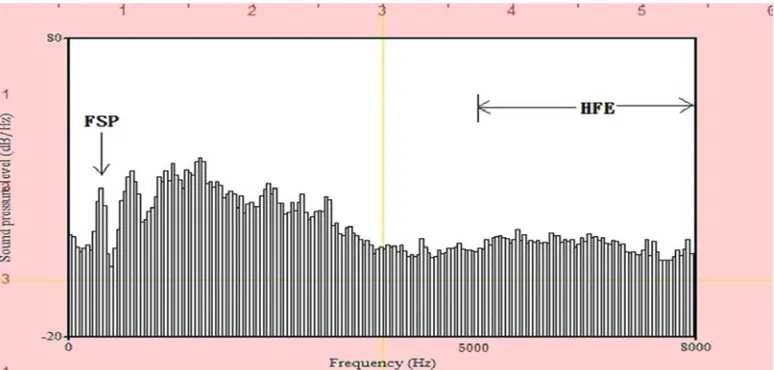
First spectral peak (FSP): the first amplitude peak across the LTAS display.
Mean spectral energy (MSE): the mean amplitude value from 0 to 8000 Hz. Average energy from 0 to 8000 Hz - first peak energy
Spectral tilt (ST): the ratio of energy between 0-1000 Hz, and 1000-5000 Hz. Average energy from 1000 to 5000 Hz / average energy from 0 to1000 Hz
High frequency energy (HFE): the sum of amplitudes from 5000 to 8000 Hz. Average energy from 5000 to 8000 Hz *(8000-5000) / the bandwidth of LTAS
Figure 1. Typical LTAS display showing the location of the first spectral peak
(FSP) and high frequency energy (HFE) between 5000Hz and 8000Hz.
82 Li-mei Chen
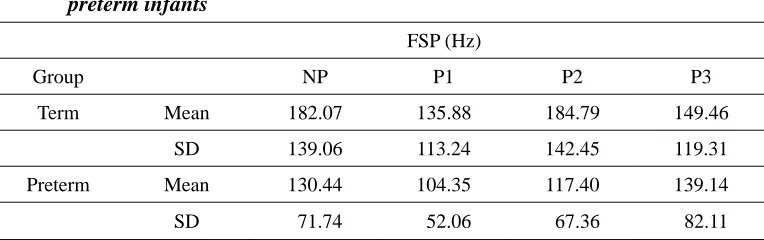
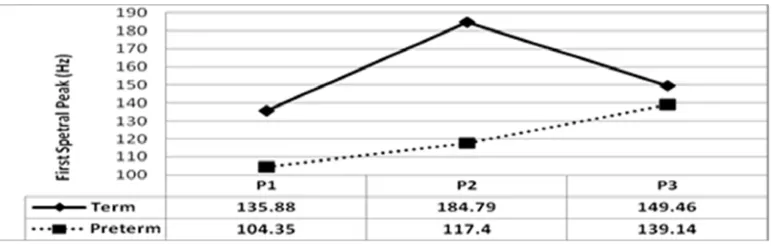
Figure 2. First spectral peak in term and preterm infants over time (P1, P2, and
P3 are three equal-length partitioned cry episodes.)
A two-way analysis of variance (ANOVA) was performed to calculate if there were significant differences in FSP values between the two groups (term factor), and whether there was significant variation between the three equal-length cry durations (P1, P2, P3) in each group (partition factor). The results indicated no significant term by partition interaction (p = 0.64), no significant main effect for term status (p = 0.17), and no significant main effect for partition (p = 0.56). Despite the fact that there was no significant difference in statistical tests, from overall observation, term infants demonstrated higher FSP in non-partitioned and the three partitioned episodes than that in preterm infants. Moreover, term and preterm infants displayed different trends of FSP in P1, P2, and P3. Term infants’ cry episode involved more distinct phases with decrease of FSP in P3, whereas FSP kept increasing from P1 to P3 in preterm infants.
While the infants were receiving injections, the sharp pain stimulated them and all the infants burst out to cry. According to the previous studies (Johnston et al., 1993; Goberman & Robb, 1999), preterm infants were expected to have higher FSP because preterm infants were thought to be more sensitive and would react more intensely to pain. Intensive cry causes the increase of the subglottal pressure and the stiffness of the vocal folds. Premature infants, compared to term infants, were thus reported to have higher fo in their cry phonation due to tension of the larynx. However, this difference was not found in this current study. The mean FSP of the term infants turned out to be higher than that of the preterm infants, in both the non-partitioned episode and the three equal-length episodes. Nevertheless, the difference between these two groups was not statistically significant as mentioned above. More data with controlled methodology in future studies can verify the discrepancy of the findings.
Quantitative Assessment of Cry in Term and Preterm Infants: 83 Long-Time Average Spectrum Analysis
there was no reduction of FSP in preterm infants.
3.4 Mean Spectral Energy (MSE)
The mean spectral energy values of non-partitioned and partitioned episodes of the 16 term and the 10 preterm infants are shown in Table 2 and Figure 3.
Table 2. Mean spectral energy from the non-partitioned episodes (NP) and three partitioned cry episodes with equal length (P1, P2, P3) in the term and preterm infants
MSE (dB)
Group NP P1 P2 P3
Term Mean 19.368 19.982 19.507 14.323
SD 9.627 9.523 11.158 11.266
Preterm Mean 22.801 25.201 18.695 15.628
SD 5.785 6.409 7.963 6.153
Figure 3. Mean spectral energy in term and preterm infants over time (P1, P2,
and P3 are three equal-length partitioned cry episodes.)
A two-way analysis of variance (ANOVA) was performed to investigate if there were significant differences between term and preterm infants (term factor), as well as across P1, P2, and P3 (partition factor) in each group. The results indicated no significant term by partition interaction (p = 0.36). There was a significant main effect for partition (F = 6.47, p = 0.003), yet there was no significant main effect for term, p = 0.52. One-way ANOVA tests were then performed in each group to check the changes of MSE in P1, P2, and P3. In term infants, P2 was significantly higher than P3 (p = 0.029). In preterm infants, P1 showed significantly higher energy than P2 (p =0.042) and P3 (p = 0.012).
84 Li-mei Chen
indicated to correspond to tension of the laryngeal musculature (Fuller & Horii, 1988). In this current study, although no significant difference could be identified, preterm infants showed higher MSE in non-partitioned episode and the three equidurational cry episodes. This shows that during the cry duration, the preterm infants’ laryngeal muscles were tighter and they had a more severe reaction toward pain stimulus. The tighter laryngeal muscles suggested a more intense cry production. This finding was also indicated in Goberman and Robb (1999). Moreover, a decrease of MSE over time could be observed in both term and preterm infants. This might suggest that the laryngeal muscles of both groups of infants loosened by phase, especially in preterm infants. There was a sharper decrease of MSE from P1 to P3 in preterm infants. The trend seemed to correspond to the distinct phases in a cry episode indicated in Truby and Lind (1965) with the attack phase (high amplitude) and the cruising phase followed by the subdual phase (the lowest period of stress).
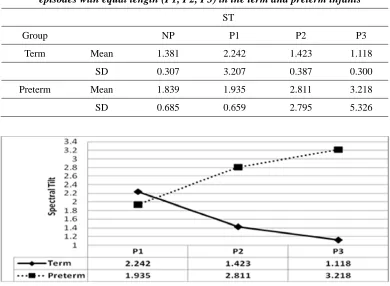
3.5 Spectral Tilt (ST)
The spectral tilt values of non-partitioned and partitioned cry episodes of the two groups are listed in Table 3 and displayed in Figure 4.
Table 3. Spectral tilt from the non-partitioned episodes (NP) and three partitioned cry episodes with equal length (P1, P2, P3) in the term and preterm infants
ST
Group NP P1 P2 P3
Term Mean 1.381 2.242 1.423 1.118
SD 0.307 3.207 0.387 0.300
Preterm Mean 1.839 1.935 2.811 3.218
SD 0.685 0.659 2.795 5.326
Figure 4. Spectral tilt in term and preterm infants over time (P1, P2, and P3
86 Li-mei Chen
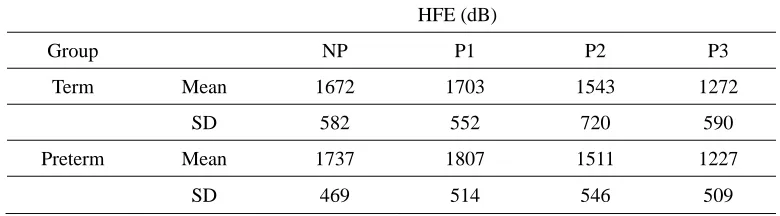
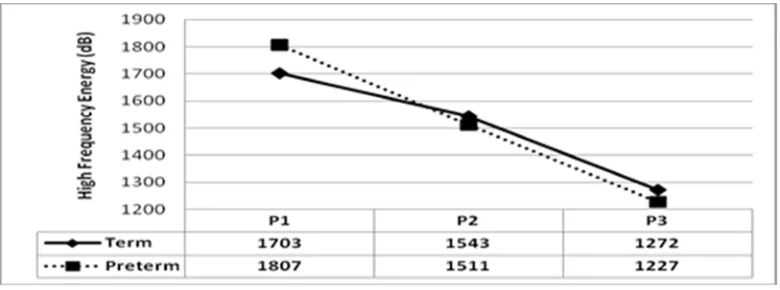
Figure 5. High frequency energy in term and preterm infants over time (P1, P2,
and P3 are three equal-length partitioned cry episodes.)
In order to identify if there was significant variation of HFE between term and preterm infants, and whether there were significant variations between the three equal-length cry durations (P1, P2, P3) in each group, a two-way analysis of variance (ANOVA) was performed. No significant term by partition interaction (p = 0.805) was found. Like in Goberman and Robb (1999), there was no main effect for term (p = 0.962). That is, there was no significant difference in HFE across the two groups. There was significant main effect for partitions (F = 8.29, p = 0.001). One-way ANOVA tests were then performed to check changes in HFE across partitions within each group. Significant differences in HFE were found across partitions for both term infants (F = 3.91, p = 0.031) and for preterm infants (F = 4.57, p = 0.025). There was a significantly higher P1 in HFE than P3 in both infant groups (p = 0.029 in term infants, and p = 0.02 in preterm infants). In both groups, HFE decreased over time. The HFE of term infants did not change drastically over time; however, in preterm infants, the HFE showed a steep descent, crossing from 1807 to 1227.
HFE measures the energy in the range of 5000-8000 Hz, which was indicated to be related to the noise elements in phonation (e.g., irregular cry utterance). It was reported that dysphonation in infant cry was very likely related to neurological disorders (Mende, Herzel, & Wermke, 1990). However, no significant difference of HFE between groups was found in this current study. Further studies with more data from both term and preterm infants might verify the correspondence of HFE and its physiological bases.
4.
Summary and Suggestion for Future Studies
Cry productions of 16 term infants and 10 preterm infants under 4 months of age were analyzed with long-time average spectrum (LTAS). Major findings were:
Quantitative Assessment of Cry in Term and Preterm Infants: 89 Long-Time Average Spectrum Analysis
Michelsson, K., Raes, J., Thoden, C., & Wasz-Hockert, O. (1982). Sound spectrographic cry analysis in neonatal diagnostics: An evaluative study. Journal of Phonetics, 10, 79-88. Qiu, J. (2006). Does it hurt? Nature, 444, 143-145.
Radhika, R. L., Chandralingam, S., Anjaneyulu, T. & Satyanarayana, K. (2012). A suggestive diagnostic technique for early identification of acyanotic heart disorders from infant’s cry. International Journal of Electrical and Electronics, 1(3), 32-38.
Soltis, J. (2004). The signal functions of early infant crying. Behavioral and Brain Sciences, 27, 443-458.
Thoden, C., Jarvenpaa, A., & Michelsson, K. (1985). Sound spectrographic cry analysis of pain cry in prematures. In B. Lester & C. Boukydis (Eds.), Infant crying: Theoretical and research perspectives (pp. 105-118). New York: Plenum Press.
Truby, H., & Lind, J. (1965). Cry motions of the newborn infant. In J. Lind (Ed.), Acta paediatrica Scandanavica: Newborn infant cry (Suppl.163), 7-58.
Zeskind, P. & Barr, R. (1997). Acoustic characteristics of naturally occurring cries of infants with "colic". Child Language Development, 68, 394-403.
Zeskind, P. (1983). Production and spectral analysis of neonatal crying and its relation to other biobehavioral systems in the infant at-risk. In T. Field & A. Sostek (Eds.), Infants born at-risk: Physiological and perceptual processes. New York: Grune & Stratton.