CSEIT1833542 | Received : 10 April 2018 | Accepted : 28 April 2018 | March-April-2018 [ (3 ) 3 : 1917-1929 ]
© 2018 IJSRCSEIT | Volume 3 | Issue 3 | ISSN : 2456-3307
A Feature Selection for Intrusion Detection System Using a
Hybrid Efficient Model
Sivasangari Gopal, Sathya M
Department of computer science, Pondicherry University, Pondicherry, India
ABSTRACT
In modern technologies network intrusion detection system plays an important role to defence the network system security. Network traffic and multi-type network system lead to considerable increase of vulnerability and intrusion. Due to the complexity of network attacks, it is always important to achieve high performance security methods, which need to thwart different attacks. Intrusion detecting method identifies whether the network traffic be normal or anomalous from the gathered information that related to security policies. High-dimensional input data analysis is most confronts in IDS. Feature selection frequently encounters this difficulty. This paper proposed the hybrid efficient model used to analyse the optimal features in the data, and it improve the detection rate and time complexity effective. This approach deals with high false and low false negative rate issue, first pre-processed data should be correlation based particle swarm optimization with GR-CR (Gain Ratio & Co-Relation) combination of this approach provide learning based some important subset of features and shows progress in the accuracy and time complexity level. Next, the novel approach tested on KDD cup 99, ISCX and ITDUTM dataset. This approach-achieved machine learning methods and it provide better performance in terms of accuracy rate, time taken, precision, and recall of the networks. Proposed approach compared with the following classification methods: Tree, Bagging, Navie Bayes, RBF classifier, Multiclass classifier, Logistic. The simulation results, gave the high detection accuracy (99.7%) in KDD 1999, (98.3 %) in ISCX and (99.3%) in ITDUTM with fewer feature selection.
Keywords: Feature selection, Particle swarm optimization, Classification algorithm, Accuracy, Time taken
I.
INTRODUCTION
Information guarantee is a concern of serious global concern. The intricacy and openness of client/server technology pooled with Internet contain fetch about enormous profit to the progressive society; meanwhile, the hurriedly increasing, openness, high complexity, and increasing accessibility of the networks not only escort to exploitation of vulnerabilities in the communication protocol stack but moreover enlarge the risk of existing information security system. Network attack vulnerability depends upon the expensive information hacking by attackers. The attacker intrude the network system
as important pre-process method to predict the data. Over-fitting, over-training problem reduce the prediction accuracy and provide biased results, feature selection conquer this problem, and provide better performance of classification models, reducing the training and testing time complexity problems, getting better stability adjacent to noise.[4]. Depending on feature subset evaluation, categorize the feature selection approaches preserve into filter, wrapper, and Hybrid methods [4]. The filter approach is self-determining of the knowledge initiation algorithm, computationally effortless speedy with scalable. The filter technique used inbuilt welfare of data as well as the objective class on the way to be learned intended for feature selection, so these methods are appropriate for processing high dimensional data[6]. A subset evaluator exploited in the wrapper approach to produce entire probable subsets since a feature vector. Removal of the features will construct IDS appearance enhanced in conditions of computation, dimension reduction and time complexity [24] [25]. Subsequently, a learning algorithm applied to prompt a classifier from the subset’s features [6, 15]. Building effectual intrusion detection is dynamic in the network system and security and services detecting threads over the network. Hence, a hybrid efficient features selection approaches proposed based on Intrusion detection model. Before, the KDD 1999, ISCX and ITDUTM data set’s magnitudes reduced through the execution of feature selection. Next, to increase the attack detection rate in the dataset the application of machine learning approaches used in an intrusion detection model. Proposed model require feature reduction, dimensionality reduction that can weaken the extracted features, and feature selection [26]. The method of feature reduction contains the process of all revolution features, which in chances ended up of a fusion of all the original features. Through the method of feature selection, the classification principles help as the root for the selection of features.
The rest of the paper has organized as follows. The related works are conversed in Section II. In Section III, Functionality overview of proposed model described. In Section IV, presents the proposed model and its prototype with details of its phases such as pre-processing, normalization, classifier selections, features selection, and post-processing. Section V discusses the results, and finally, Section VI concludes the paper indicating possible future work.
II.
RELATED WORKSmethod, analyzing 19 features in NSL KDD dataset out of 41 features. [7]. S. Udhaya Kumar (2016) hybridization of particle swarm optimization (PSO)-based rough set feature selection method projected for optimum least set of significant features from explored features. Novel neighborhood rough set classifier classifies the selected features form the hybrid model (NRSC). Tentative results works of the BCI Competition 2008 Dataset. Classifier results have higher mean kappa of 0.743 compared with existing work.
K. Kanaka Vardhini 2017 [10] an enhanced heuristic algorithm, ant colony optimization approach used to analyse the efficient features and increase the detection rate .enhanced method trained and test on KDD dataset. The proposed approach increased the percentage of intrusion detection rate. Chandrashekhar Azad (2017) [11] recognises the finest features using fuzzy min max neural network and the particle swarm optimization. The method assessed on KDD cup 99 dataset. The projected model delivers the superior performance as compared with other machine learning methods. ShadiAljawarneh2017 [1] new hybrid model for choice the greatest features for this evaluation NSL-KDD data set used. Data require filtering the features by the Vote algorithm with Information Gain that syndicates to analyse the best features. Next, the selected features classify into different classifiers. The detection rate of proposed model dignified as 99.81% and 98.56% for binary class and multiclass NSL-KDD data sets, respectively; at the same, it raises accuracy, high false negative rate, and low false positive rate. Li-Yeh Chuang 2011 [12] progress the binary particle swarm optimization, the catfish binary particle swarm optimization used, in search space it remove the poorest fitness and improve global best. The selected features give the input to K-nearest neighbor with leave one cross validation method. It will evaluate the accuracy. Mohammed A. Ambusaidi 2016 [13] linear and nonlinear-based mutual information based algorithm that logically selects the finest features. The building IDS method tested on
KDD Cup 99, NSL-KDD and Kyoto 2006+ dataset. Least Square Support Vector Machine based IDS (LSSVM-IDS), used to expand the accuracy and computational cost. ZheniStefanova2017 [2], In IDS Network Attribute Selection, Classification and Accuracy (NASCA) method increase network reliability, availability and integrity. Four-stages of intrusion detection method that contain positively perceive annoying intrusion to the systems. The method is static, and then it modified to a dynamic test bed.
III.
FUNCTIONALITY OVERVIEW OF PROPOSED MODELAn efficient hybrid model improves accuracy greater and increase the performance by behind these steps: 1. choosing a proper dataset that has quality data such as NSLKDD, KDD cup 1999. Distribute the dataset into 70% train and 30% test for resolve of the testing. The pre-processing permits to reduce or remove the noise forced on the data. Build the hybrid model consisting of the following classifiers such as J48, Meta Pagging, Random Tree, REP Tree, AdaBoostM1, Decision Stump and Naïve Bayes. Supervised or unsupervised learning are two phases involved in the classification part; it is improving the classification accuracy rate and system performance. Classification system contains these stages:
Dataset pre-processing from training set through representing the dataset and selecting the optimal features.
To build the training classifier model it takes learning model from the classifier.
Test data used to classify the attacks and evaluate the classification rules accuracy. Future, if the accuracy considered adequate, the classification procedures used on the novel dataset.
GR-CR (Gain Ratio & Co-Relation). The model reduces irrelevant feature and provide the excellent accuracy.
A. Filter Based Feature selection
Correlations among network traffic archives to be linear associations, before a linear degree of requirement such as Linear Correlation Coefficient (LCC) used to analyse the reliance between two random variables. However, the real world communication, the correlation between variables can be nonlinear as fit. Speciously, a linear degree cannot expose the bond between two nonlinearly reliant variables. Therefore, analyse the relation between two variables no difficulty whether they are linearly or nonlinearly dependent. In this work expects to discover ideal features from a feature space irrespective of the form of correlation between features. [13][16]
Feature selection of KDD cup, ISCX and NSL KDD data using Filter approach, features ranked by [Gain Ratio (GR) and Correlation (CR)] attribute selection methods. Combinations of this hybrid method eliminate the unbalanced features from the data. Eliminating features given feed forward to neural network for training and testing the dataset. Finally, reduced features analyse the Performance of training data. [17][18].Figure 1 shows filter based feature selection module.
Figure1. Diagrammatic representation of proposed module
B. Gain Ratio (GR) based feature selection
Non-terminal nodes in decision tree test more features value and terminal nodes provide the observing value of features. Highly weighted features give the first rate in feature selection by Information Gain. Gain Ratio is superior version of Information Gain. When select the subset of features according to their weight, it efficient to decrease bias [18]. Collected features information ratio defined Gain Ratio. Features spilt by this method and training information divided into V partition (high split info, Medium split info, Low split info). Let A consists feature information with m split labels’. Conventional feature information classify a exacting features is specified by Esq. 1
( ) ∑ (| |
| |) (
| | | |)
... (1) Where are the viewpoint of subset of feature belongs to labels and is predictable by /s. Let features A has v distinct weights. Let is number of features related to labels in a subset. . Contain features in S that have weight of A. Predictable feature information based on the partitioning into subsets by A, given by
( ) ( )... (2)
Training information that would be gained by branching on A is Gain (A) = I(S) – E (A). Beyond those weights, present the feature in rank construct throughout splitting the training data set S into v partitions related to v outcomes of a test on the features A. Gain ratio (GR) is define as
Gain Ratio (A) = Gain (A)/ SplitInfoA (S)... (3) Which features have highly weighted that feature preferred by splitting attributes.
C. Correlation based feature selection (CFS)
Consequence of a subset of features develops throughout the correlation among attribute and class labels, and CFS diminish inter-correlation [19]. Equation for CFS
√ ( ) ... (4)
Where is the correlation between the collected feature subsets and the label value, k is the integer of subset features, is the middling of the correlations between the subset of attribute and the label value, and is the average inter-correlation between subset features.
Filter approach based ranking the Gain Ratio (GR) and Correlation (CFS) attribute evaluation, testing done by KDD 1999, ISCX, data and NSL KDD. Preferred features exposed in Table 1
Table1. Feature selection using hybrid model Dataset All optimization method proposed in 1995 by Eberhart & Kennedy. PSO is encouraged as of the shared manners of bird flocking and fish school [14] [23]. The PSO system started with population of random
solutions and searches primary solutions for finding the feasible optimal solution by upgrading to various generations. In this probable solutions are called particles, every fly throughout solution space by subsequent the global and local finest particles. In PSO model, each particle velocity (acceleration) needs to alter closer to pbest and gbest. The pbest position. While better positions exposed after that, the solution will direct the manners of the swarm. In PSO, each particle constitutes the potential solution in the n-dimensional feature space. The location of the particle is the queue value it has collected of the n- features [11] [20]. Each particle flies throughout the search space for select the feasible optimal solution. Every particle I sustain the following information:
: The existing position of particle, : The existing velocity of particle, : The individual best position of particle.
By means of the following notations particles velocity as well as the positions are to be traverse as the equations specified on the under mentioned Eqs. (5) and (6) respectively:
( ) ( ) ( ) ( ( )
( )) ( )( ( ) ( ))... (5)
( ) ( ) ( )... (6)
Where W is the inactivity weight C1 and C2 are the acceleration constants. ( ) ( ) ( ) As well as
K = 1, 2... The velocity of every particle considered using the following three contributions
b. The cognitive module is the purpose of the space of particle starting its individual best. c. The social module is the purpose of the space
of the particle starting the finest of the individual bests (gbest). The individual best of the particle i designed using the Eq. (7):
( )
{ ( ) ( ( )) ( ( ))
( ) ( ( )) ( ( ))... (7)
Every vector related to one packet. Furthermore, each vector has N tokens. Every token enchant its individual secret and explicit index. The token established on a packet, the token’s TF value positioned on its exact index. Another way, the token not established in this packet, the TF value is zero. Besides, the TF value put on a precise index establish in the vector. A label that related to value for each packet, which in revolve corresponds to the kind of the packet, is create at the end of the vector. However, the packet is considered an intrusion if this value is equal to 1. If the value is 0, then the packet is considered a normal (benign).According to this condition the data packets classify attack or normal by classification methods.
Because either dataset features can have continuous or discrete values, features comprise dissimilar ranges for the features value, therefore feature value not correspond. Consequently, min-max normalization used to normalize the features. This also allowed for the mapping of all the various values for every feature in the [0, 1] range.
IV.
PROPOSED MODELThe proposed model’s pretend code presented by Algorithm1
The proposed model integrates correlation based particle swarm optimization with GR-CR (Gain Ratio & Co-Relation) combination of this approach provide learning based some important subset of features. Figure 1 shows the block diagram of the proposed model.
Figure 2. Block diagram of Proposed Model
A. Performance Evaluation
Quite a lot of experiments directed to improve the performance and efficiency of the proposed model. For this reason, the accuracy rate, detection rate, false positive rate and F-measure metrics are applied. The accuracy metric, detection rate and false positive rate are determine by [13]
... (9)
... (11)
Where True Positive (TP) is the amount of definite attack detected as attacks, True Negative (TN) is the amount of normal data detected as normal; False Positive (FP) is the amount of attack detected, but actually normal data, and False
Negative (FN) is the amount of normal detected but actually attack data [11] [21].
The precision (PR) is the quantity of predicted positive value which are actually positive. The precision value reduces the system performance [22]. If precision value is high, it have lower false positive rate and vice versa. Esq. (12) gives the precision value.
... (12)
V.
RESULTS AND DISCUSSIONWEKA is a mechanized data-mining tool that utilized to accomplish the classification experiments for KDD 1999, ISCX, and ITDUTM dataset. The data set ended up of various classes of attacks. KDD 1999 contain normal, DoS, U2R, R2L, Probe attacks. ISCX (2012) dataset contain Priesc, flood and normal.
2. Remove the feature from the data;
3. Use the consequential data set to train the classifier;
4. Analyze the performance of the classifier using the test set, in terms of the chosen performance criteria;
5. Features Reduce the importance of the feature according to the rules
KDD 1999 dataset contain 41 features, that is
Duration, protocol_type, Service, src_bytes,
dst_bytes, Flag, wrong fragment, Urgent, Hot,
is_host_login,is_guest_login, Count, serror_rate,
srv_serror_rate,rerror_rate,
srv_rerror_rate,
same_srv_rate, diff_srv_rate, srv_diff_host_rate.
same <IP, Port> as that of the current connection, Total number of connection seen in the time window, Packet rate destined to the IP address as that of the current connection (pps), Packet rate destined to the IP address and emerging from the same IP address as that of the current connection (pps)The total number of records in the KDD 1999 original labelled training dataset is 97,278 for Normal, 4,107 for Probe, 3, 96,689 for DoS and 1,126 for R2L attack. After filtering out the duplicate records, there were 87801 records for Normal, 906 for Probe, 641 for DoS and 946 for R2L attack classes. In ISCX, original labeled training dataset is 37,165 for normal, 6,862 for priesc and 2428 for flood attack classes. After preprocessing the data, there were 26,015 labels for normal, 4803 for priesc and 1699 labels for flood. In ITDUTM, original labelled training dataset is 43,386 for normal, 16,128 for priesc, 1962 for flood and 10,833 for probe attack classes. Preprocessing the data, there were 30,370 labels for normal, 11,290 for priesc, 1,373 labels for flood and 7,583 for probe attack. Following pre-process method, the training dataset given input to the hybrid method of feature selection. The combination of correlation based particle swarm optimization with GR-CR (Gain Ratio & Co-Relation) select the important feature and it improve the accuracy rate with low time complexity. Six distinct pattern recognition and machine learning algorithms tested on the KDD1999, ISCX and ITDUTM dataset. Tree, Bagging, Random Forest, RBF network, Multiclass classifier and Logistic. These algorithms selected so that they represent a
wide variety of fields: neural networks, functions, and bayes and decision trees.
As mentioned in Section 5, the dataset needs to preprocessed and classified, according to the range of {0-1}. The dataset classified using various machine-learning classifiers. Then, the classifier with the best accuracy is functional for feature selection. Two approaches used for feature selection: search method and subset attribute evaluator. In conclusion, the model formed by using the optimal features and the finest classifier.
A. Result analysis
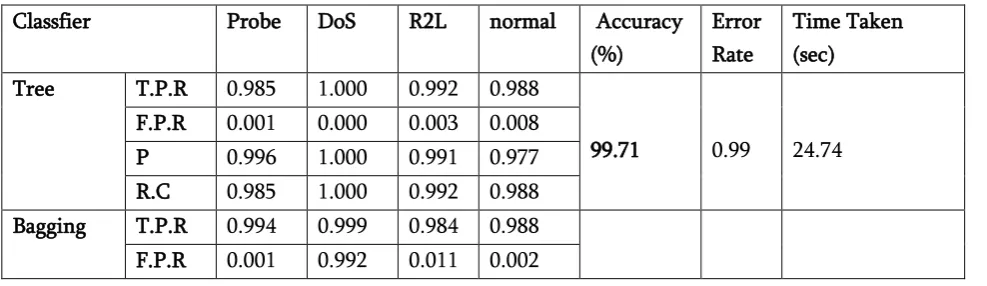
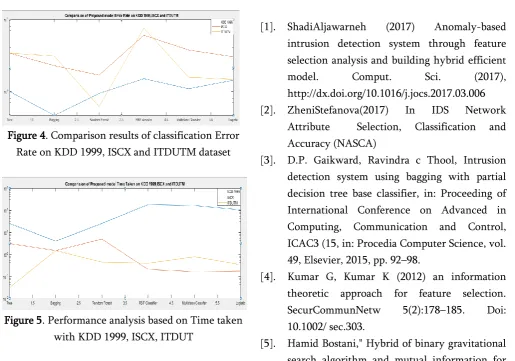
The proposed feature selection model (correlation based particle swarm optimization with GR-CR (Gain Ratio & Co-Relation)) exhibit promising results in conditions of low computational cost and high accuracy. Table2, 3, and 5condense the classification results of detection accuracy, true positive rate, false positive rates, precision, recall and time taken. It reveals effective feature selection method has achieved an accuracy rate of 99.71, 98.3 and 99.3 percent for KDD Cup 99, ISCX and ITDUTM respectively. The proposed model compared with all features in the dataset. Figure 3 reveals the classification accuracy of hybrid model enhanced on the dataset. Figure 4 stand for error rate of the model carried out different classification methods. Figure 5 shows the runtime of each classification algorithm during the process of the training set3
Table 2. Proposed model experimental performance on KDD 1999 dataset Classfier Probe DoS R2L normal Accuracy
(%)
Error Rate
Time Taken (sec)
Tree T.P.R 0.985 1.000 0.992 0.988
99.71 0.99 24.74 F.P.R 0.001 0.000 0.003 0.008
P 0.996 0.002 0.969 0.926 99.53 0.46 3.86 R.C 0.994 0.992 0.984 0.993
Random forest
T.P.R 0.986 1.000 0.987 0.989
99.06 0.93 24.64 F.P.R 0.001 0.000 0.002 0.009
P 0.996 1.000 1.993 0.989 R.C 0.986 1.000 0.987 1.000 RBF
classifier
T.P.R 0.988 1.999 1.000 0.952
98.5 1.49 177.96 F.P.R 0.007 0.001 0.008 0.004
P 0.978 1.988 0.976 0.989 R.C 0.988 1.000 1.000 0.952 Multiclass
Classifier
T.P.R 0.987 1.000 0.996 0.974
98.9 1.08 160.49 F.P.R 0.002 0.001 0.005 0.006
P 0.993 1.000 0.986 0.982 R.C 0.987 0.996 0.996 0.974
Logistic
T.P.R 0.994 1.000 0.991 0.984
99.3 1.42 102.04 F.P.R 0.002 1.000 0.000 0.003
P 0.995 1.000 0.958 0.991 R.C 0.994 1.000 0.997 0.984
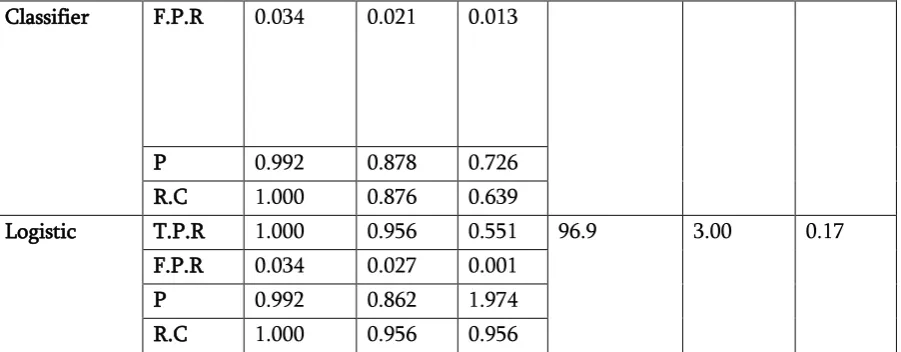
TABLE3. Proposed model experimental performance on ISCX dataset Classifier Normal Priesc Flood Accuracy
(%)
Error Rate
Time taken Trees,j48 T.P.R 0.990 0.940 0.770 97.9 3.37 3.03
F.P.R 1..000 0.006 0.023 P 0.990 0.870 0.920 R.C 1.000 0.008 0.013
Bagging T.P.R 1.000 0.978 0.631 97.7 2.26 1.44 F.P.R 0.018 0.022 0.018
P 0.995 0.886 0.979 R.C 1.000 0.978 0.977 Random
forest
T.P.R 1.000 0.988 0.713 98.3 1.67 4.78 F.P.R 0.000 0.018 0.002
P 1.000 0.002 0.957 R.C 1.000 0.003 0.713
RBF classifier T.P.R 1.000 0.949 0.000 94.01 5.98 0.2 F.P.R 0.131 0.039 0.000
P 0.968 0.806 0.000 R.C 1.000 0.949 0.000
Classifier F.P.R 0.034 0.021 0.013
P 0.992 0.878 0.726 R.C 1.000 0.876 0.639
Logistic T.P.R 1.000 0.956 0.551 96.9 3.00 0.17 F.P.R 0.034 0.027 0.001
P 0.992 0.862 1.974 R.C 1.000 0.956 0.956
Table 4. Proposed model experimental performance on ITDUTM dataset Classifier Probe Norma
l
Priesc Flood Accurac y (%)
Error Rate
Time taken
Trees,j48 T.P.R 0.978 0.923 0.960 1.000
96.61 3.37 0.03 F.P.R 0.004 0.017 0.023 0.001
P 0.986 0.947 0.930 0.998 R.C 0.978 0.923 0.960 1.000 Bagging T.P.R 0.985 0.925 0.964 0.999
96.93 3.07 1.44 F.P.R 0.012 0.912 0.013 0.004
P 0.963 0.961 0.960 0.989 R.C 0.985 0.925 0.964 0.999 Random
forest
T.P.R 0.993 0.991 0.991 1.000
99.03 0.61 0.43 F.P.R 0.001 0.004 0.003 0.000
P 0.995 0.991 1.991 1.000 R.C 0.993 1.000 0.991 1.000 RBF
classifier
T.P.R 0.938 1.942 1.815 0.993
92.4 7.52 0.38 F.P.R 0.051 0.024 0.018 0.007
P 0.955 1.925 0.936 0.982 R.C 0.938 1.042 0.815 0.993 Multiclas
s
Classifier
T.P.R 0.988 0.973 0.974 1.000
98.4 1.56 0.76 F.P.R 0.002 0.010 0.009 0.000
P 0.994 0.969 0.972 1.000 R.C 0.988 0.973 0.974 1.000
Logistic
T.P.R 0.990 0.971 0.978 1.000
98.5 1.46 0.33 F.P.R 0.002 0.008 0.00 0.000
All tables represent the performance of the proposed model exhibited the higher accuracy and Error rate 99.7, 98.3 and 99.3 accuracy on KDD 1999, ISCX, and ITDUTM respectively. Behind the entire huge amount of undetected attacks over the dataset that do not emerge in the subsequent training dataset, build it even complex for IDS to identify an attack. For example, in the correctly classified labels dataset has exposed the normal records have nearly the same features and this makes it impossible for any IDS to identify this kind of attacks.
Figure 3. Comparison results of classification accuracy on KDD 1999, ISCX and ITDUTM dataset
Figure 4. Comparison results of classification Error Rate on KDD 1999, ISCX and ITDUTM dataset
Figure 5. Performance analysis based on Time taken with KDD 1999, ISCX, ITDUT
VI. CONCLUSIONS
The vulnerability in the network systems leads to dump the process; mainly the traditional intrusion detection systems have concert a essential role to prevent the system from attach, even though IDS had many restrictions due to secure the systems. In this paper, responsibility and specificity are important component of heuristic function. Feature reduction methods integrate to the data mining technique for improving the classification efficiency is a dynamic field intimately associated to data mining and additional data processing techniques. The proposed correlation based particle swarm optimization with GR-CR (Gain Ratio & Co-Relation) methods provide feature reduction improve the training performance and achieving the accuracy compared to the other conventional methods. The proposed model assess on three-intrusion detection dataset: KDD Cup 99, ISCX and ITDUTM.
VI.
REFERENCES
[1]. ShadiAljawarneh (2017) Anomaly-based intrusion detection system through feature selection analysis and building hybrid efficient model. Comput. Sci. (2017), http://dx.doi.org/10.1016/j.jocs.2017.03.006 [2]. ZheniStefanova(2017) In IDS Network
Attribute Selection, Classification and Accuracy (NASCA)
[3]. D.P. Gaikward, Ravindra c Thool, Intrusion detection system using bagging with partial decision tree base classifier, in: Proceeding of International Conference on Advanced in Computing, Communication and Control, ICAC3 (15, in: Procedia Computer Science, vol. 49, Elsevier, 2015, pp. 92–98.
[4]. Kumar G, Kumar K (2012) an information theoretic approach for feature selection. SecurCommunNetw 5(2):178–185. Doi: 10.1002/ sec.303.
feature selection in intrusion detection systems ", Springer-Verlag Berlin Heidelberg, 2015. [6]. You Chen, Yang Li (2006) Survey and
Taxonomyof Feature Selection Algorithms in Intrusion Detection System. Inscrypt 2006, LNCS 4318, pp. 153 – 16.
[7]. Mehdi HosseinzadehAghdam, "Feature Selection for Intrusion Detection System Using Ant Colony Optimization", International Journal of Network Security, Vol.18, No.3, PP.420-432, May 2016.
[8]. Xiangyang Wang (2006) feature selection based on rough sets and particle swarm optimization (PSO). Else viewer B.V 2006, doi: 10.1016/ j. patrec. 2006. 09.003.
[9]. FatemehAmiri (2011) Mutual information based feature selection for intrusion detection system. Elseviewer Ltd 2011, doi:10.1016/j.jnca.2011.01.002
[10]. K. Kanaka Vardhini and Dr. T. Sitamahalakshmi (2017) Enhanced Intrusion Detection System Using Data Reduction: An Ant Colony Optimization Approach. International Journal of Applied Engineering Research ISSN 0973-4562 Volume 12, Number 9 (2017) pp. 1844-1847
[11]. Chandrashekhar Azad, Vijay Kumar Jha 2017, Fuzzy min–max neural network and particle swarm
[12]. Li-yehchuang, sheng-weitsai (2011), improved binary particle swarm optimization using catfish effect for feature selection.Elseviewer Ltd 2011,doi:10.1016/j.eswa.2011.04.057. [13]. Mohammed A. Ambusaidi (2006) Building an
Intrusion Detection System Using a Filter-Based Feature Selection Algorithm, ieee transactions on computers, vol. 65, no. 10, october 2016
[14]. Dongshu Wang, Dapei Tan (2017) Particle swarm optimization algorithm: an overview, Soft Comput (2018) 22:387–408 https://doi.org/10.1007/s00500-016-2474-6
[15]. H. Liu and L. Yu.Towards integrating feature selection algorithms for classification and clustering. IEEE Transactions on Knowledge and Data Engineering, 17(3):1-12, 2005.
[16]. A. M. Ambusaidi, X. He, Z. Tan, P. Nanda, L. F. Lu, and T. U. Nagar, "A novel feature selection approach for intrusion detection data classification," in Proc. Int. Conf. Trust, Security Privacy Comput. Commun., 2014, pp. 82–89.
[17]. Akashdeep, IshfaqManzoor (2017) A Feature reduced intrusion detection system using ANN classier. ElseviewerLtd 2017,http://dx,dirg/10/1016/j.eswa.2017.10.005, 0957_4174.
[18]. AshaGowdaKaregowda(2010) comparative study of attribute selection using gain ratio and correlation based feature selection", International Journal of Information Technology and Knowledge Management, 2010.
[19]. Lei Yu leiyu,asu.edu Huan Liu (2003) Feature Selection for High-Dimensional Data: A Fast Correlation-Based Filter Solution, Proceedings of the Twentieth International Conference on Machine Learning (ICML-2003), Washington DC, 2003.
[20]. Kennedy J (2010) Particle swarm optimization. In: Encyclopedia of machine learning. Springer, USA, pp 760–766
[21]. R. Battiti, "Using mutual information for selecting features in supervised neural net learning," IEEE Trans. Neural Netw., vol. 5, no. 4, pp. 537–550, Jul. 1994
[22]. F. Amiri, M. RezaeiYousefi, C. Lucas, A. Shakery, and N. Yazdani, "Mutual information-based feature selection for intrusion detection systems," J. Netw. Comput.Appl., vol. 34, no. 4, pp. 1184–1199, 2011.
[24]. SumaiyaThaseenIkram, "Intrusion detection model using fusion of chi-square feature selection and multi class SVM", School of Computing Science and Engineering, VIT University, Chennai, December 2015.
[25]. Li Ma and Suohai Fan, Ma and Fan "CURE-SMOTE algorithm and hybrid algorithm for feature selection and parameter optimization based on random forests" BMC Bioinformatics, 2017.
[26]. Ujwala Ravale, Nilesh Marathe, Puja