•Ì¸·²¹- ¿®» ¬¿´µ·²¹Œ
ß² »-¬·³¿¬·±² ±º ·²²±ª¿¬·ª» ½¸¿²¹» º±®
ÎÚ×Ü ¾¿-»¼
-»®ª·½»-ß²µ» ßòÐò Ø¿¹»³»·¶»® Óͽò
ͽ¸±±´ ±º Ó¿²¿¹»³»²¬ ¿²¼ Ù±ª»®²¿²½»
Ó¿-¬»® ¬¸»-·- Þ«-·²»-- ß¼³·²·-¬®¿¬·±² Û²-½¸»¼»ô ß°®·´ ïꬸ
‘
’
‘Everything flows, nothing remains’
Ó¿²¿¹»³»²¬ -«³³¿®§
Introduction
First off, this study will search for a valid method to forecast future demand for innovative
strategic processes. Secondly it will test the selected method in the innovative market of RFID
based real-time services.
Being able to forecast market demand is of great interest in business context, because
planning a new business requires a large number of decisions to be made in advance of the
actual launch of that service. Common market research typically collects information from an
existing market. For innovative products and services however, such historical data and past
experience does not exist. Forecasting future demand for innovative products can therefore
only be done by estimation. Commonly accepted methods for this kind of estimation are the
Delphi method (Jolson and Rossow, 1971), scenario planning, conjoint analysis and the lead
user method (von Hippel, 1986). These methods are less adequate when forecasting for
radically innovative products, because of functional fixedness, an effect that causes subjects
to experience great difficulty in generating novel product concepts that deviate from the
familiar.
Current study
To overcome this problem, the method for estimating innovative change (Geurts and
Roosendaal, 2001) was selected to be applied onto the RFID market. This particular method
uses Talcott Parsons’ AGIL scheme to describe the market that is being investigated. The four
subsystems are captured in a four-function model, which serves as a framework from which
provocative statements are generated. These statements are then introduced by a textual
sketch of an imaginary future on which one should react. Probing generates additional
qualitative information. This qualitative information is quantified and interpreted into the
four- function framework.
This model is tested at Royal KPN N.V., a Dutch, north-western Europe oriented
telecommunication company that seriously considers the option of providing RFID enabled
services. KPN is currently focusing on two kinds of RFID services: Asset Management
services, that focus on real-time, location based assets and personnel tracking. And ‘Value
Chain Visibility services’, which focus on providing timely information for control in logistic
KPN searches for an answer to the questions: ‘What are the expectations of business
customers for RFID based real-time services that KPN should provide in the future?’ and
‘Can these expectations and KPN’s strategy be linked?’ The most interesting competitors
were contacted with the philosophy that a successful service, provided by direct competition,
might be successful for KPN as well. However, BT as well as T-systems was not prepared to
cooperate for strategic and legal reasons. Therefore this part of the research was abandoned.
After applying the method for estimating innovative change, it will be evaluated for more
generic use in KPN’s department Business Strategy & Innovation.
In order to find answers to the questions, the four-function framework for the market
for RFID enabled services is constructed. The four functions that were identified are
Adequate Information, User Interface, Real-time Response and System Reliability. Two
separate questionnaires where established for Asset Management and Value Chain Visibility.
Twelve individuals were interviewed, being business customers regarding RFID and contacts
with solid experience in the field. Seven individuals were interviewed for Value Chain
Visibility and five were interviewed for Asset Management.
Results and implications
The results show that expectations of business customers differ per client. This is deducted
from the variation in answers to the provocative statements, the many referents made to
Adequate Information and the little convergence in the composition of referents made in
reaction to the statements. These results imply that the services should be tailor-made. This
interferes with the strategy of the KPN department Business Strategy & Innovation, which is
to create high-growth business with a repeatable business model, and hence standardized
products. Providing tailor-made services will only be interesting in two cases; for large
corporate clients -in which case it will be a matter for the KPN department Corporate
Solutions, which is equipped for providing tailor-made services and handling major corporate
clients- and when only those parts that can be standardized, are offered as a semi-finished
product.
Furthermore, the results show that the form of the user interface is not a requirement
by itself. It is important that the information that is being communicated to the user is
be most suitable. A product containing a standardized interface will therefore be unsuccessful.
In addition, the reliability of the technique used, is important in selecting an interface.
With regard to the degree in which an information system must be able to take
real-time action on collected data, it is indicated that the technology that is used, should be
extremely reliable. The interviewees appear to differ in opinion whether the reliability will be
sufficient enough or not. Delivering reliable products as well as being able to choose how
information is communicated, are values that are explicitly stated in KPN’s mission statement
and are therefore strategically interesting to KPN.
Application of the method of estimating innovative change has proven the method to
be able to deliver both interesting and useful results. However application needs education of
the innovation-managers and outsourcing of the interviews as well as labour-intensive data
processing parts. Application of the method for every innovation subject will be too costly
and time-consuming. Application can therefore only be justified when strategic, high
investment decisions are to be made.
With regard to the backward processing promoted by a textual introduction, not all
interviewees were able to think freely about their needs. Interviewees referred to the current
possibilities as an argument for their choices in needs. To help them to consider their needs
more freely, it is recommended that backward processing entails a textual introduction
accompanied by a short movie.
Conclusion and recommendations
Because of customer-specific wishes, a tailor-made product is needed. It is advised to only
provide tailor-made services to major corporate clients and transfer this responsibility to KPN
Corporate Solutions. KPN Business Strategy & Innovation should concentrate on small and
medium sized companies. To decrease the ‘tailor-made factor’, it is well-advised to provide a
semi-finished product, containing an accurate database and a reliable network. The more
customer-specific user interface should be transferred to partners or value-added resellers.
Because of the customers’ hesitation towards allowing a system to make real-time
decisions without human intervention, KPN is advised to focus on doing a pilot that shows all
technological abilities. This pilot should be actively used for visits by potential customers.
In regard to using the method for estimating innovative change (Geurts & Roosendaal,
Klant InZicht (Customer InSight) should be used for scanning purposes. When this indicates
strategic, big investment decisions; more accurate research should be done by applying the
method for estimating innovative change.
A scan has identified the four-function model used in this research, to also represent
the innovations within Business Strategy & Innovation that involve information systems. For
innovations that serve as a tool or as entertainment, the goal and latency function should be
Ю»º¿½»
This report is the result of my graduation project for the Master of Science degree in
Innovation Management. The graduation project was performed at Royal KPN N.V. and was
supervised by the School of Management and Governance of the University of Twente.
While a preface is the beginning for you reading this Master Thesis, for me it marks an
ending. Getting this far would not have been possible without the help of several people. I
would like to use this preface to thank them for their support. First of all I would like to thank
all that have contributed to this research by making time for interviews. Furthermore, thanks
to all of my colleagues at KPN Business Strategy & Innovation for their hospitality and all
their suggestions. You made my stay at KPN a very valuable learning experience and a nice
conclusion to my years as a student.
Specifically, my gratitude goes out to Jan Kroon, my internship supervisor for this project.
Jan was always available for all my questions and his feedback usually provided me with
coffee and some metaphors to understand KPN, RFID and life.
Furthermore I would like to express my gratitude to Hans Roosendaal en Peter Geurts, my
supervisors at the University of Twente. I would like to thank them for their useful feedback
during the project and their critical review of this report.
Certainly, I would also like to take this opportunity to thank my parents and brothers for their
never-ending support and interest. Not only during this project, but during both of my studies,
my rowing career and in everything I undertake. And Joris, thank for being my second
corrector!
Of course, also a special ‘thank you’ to all my friends for both their useful and their less
useful suggestions. And last, but certainly not least: ‘Timo, thank you for just being there.. ‘
Anke Hagemeijer
Ì¿¾´» ±º
ݱ²¬»²¬-Management summary ... I Preface ...V
Table of Contents ... 1
1. Introduction... 1
2. Forecasting future demand for new products and services... 3
2.1 RFID Technology and research... 5
2.1.1 Adoption issues... 6
2.2 Telecommunication and RFID ... 8
2.2.1 Royal KPN N.V. ... 9
2.2.2 KPN and strategy ... 10
2.2.3 KPN and RFID... 11
2.2.3.1 Value Chain Visibility... 11
2.2.3.2 Asset Management ... 12
2.2.4 KPN and market research... 12
2.3 Research objectives... 14
2.4 Forecasting in context ... 16
2.4.1 Accepted methods ... 17
2.4.1.1 Exploratory models ... 17
2.4.1.2 Primary market research techniques... 18
2.4.2 Forces and functions (Geurts and Roosendaal, 2001)... 20
2.4.2.1 The interview method... 23
4.1 Results for the provocative statements ... 31
4.2 Results for the probing questions ... 32
4.2.1 Adequate Information ... 32
4.2.2 Adequate Information – User Interface... 34
4.2.3 User Interface... 34
4.2.4 User Interface – Realtime Response... 35
4.2.5 Realtime Response... 35
4.2.6 System Reliability ... 36
5. Discussion and conclusion ... 38
5.1 The results from application of the model ... 38
5.1.1 Customer specific reactions... 38
5.1.2 User Interface... 39
5.1.3 Realtime Response and System Reliability... 40
5.1.4 The expectation of the customers and the fit with KPN’s strategy ... 40
5.2 The value of the method for KPN’s purposes ... 42
5.2.1 The framework... 42
5.2.2 The interview ... 43
5.2.3 Data processing... 44
5.2.4 KPN and estimating innovative change ... 44
5.2.4.1 Using the constructed fourfunction model ... 45
6. Recommendations ... 47
6.1 Recommendations for Business Strategy & Innovation ... 47
6.2 Recommendations for using ‘estimating innovative change’ ... 49
References... 50
-ïò ײ¬®±¼«½¬·±²
The desire to be able to predict the future has been one of all times. Astrology, crystal balls,
tarot cards, the techniques are endless! Predicting the future has, in some instances, even
become a common daily practice. A prediction for the next day or even a week is done daily
for the weather. The meaning of some predictions can be vital. In case of earthquakes,
hurricanes or tornados, it can save the lives of entire populations.
Predicting the future is also interesting in a more commercial context. It can have
tremendous significance for businesses to be able to predict the future. What if you could
predict what product a market will be waiting for in a few years from now? Then you could
start the research and development program in time, you would be able to start the production
and marketing efforts before the market even realizes it needs a product or service. You
would have a great advantage over your competitors.
It is obvious that being able to forecast market demand is of great interest in business
context. McBurney, Parsons & Green (2002) describe in their discussion about demand
forecasting, that planning a new business requires a large number of decisions to be made in
advance of the launch of the service. Many of these decisions depend upon knowing the likely
number of customers. In the absence of live, operating data, these decisions can only be made
on basis of forecasting the number of customers and frequency of usage.
The difficulty of forecasting is that the available information is always derived from
present-day measurements, through for example business analysis or interviews, but must
give information for the future. So somehow, these present conditions are the fundament for
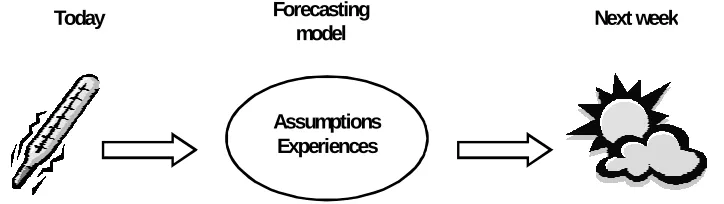
the future. A forecasting model determines what kind of present-day measurements lead to
what kind of future. This is based on experiences from the past and the assumption that the
same conditions always lead to the same future. To illustrate this, it is useful to draw the
comparison with weather predictions. Present-day measurements for temperature, humidity,
atmospheric pressure and knowledge of the location of anti-cyclones and depressions are
converted by a forecasting model. Based on assumptions about the impact of these conditions
on the weather, a forecasting model converts the information into a prediction for next week
Figure 1. The forecasting model.
However, unlike the weather, for very innovative products and services, the conditions
for a forecast cannot be determined on past experience and can only be determined by making
assumptions. That is what makes forecasting for innovative products a challenging task. Even
when data from similar markets are available, a turbulent market environment may make
historic data less useful (Gruszecki and Andries, 1990).
This research will therefore discuss and compare several market research methods for
innovative products. The selected model of Geurts and Roosendaal (2001) for estimating
innovative change will be tested in the innovative RFID market (Radio Frequency
Identification). The research will be done at KPN, a Dutch telecom provider involved in this
technique. The following paragraph will discuss the relevant background for this research.
Today Next week
Assumptions Experiences Forecasting
îò Ú±®»½¿-¬·²¹ º«¬«®» ¼»³¿²¼ º±® ²»© °®±¼«½¬- ¿²¼
-»®ª·½»-The need for a dependable forecast is a significant one. An estimation of what the market will
be like, will support go or no-go decisions in time and effort supported to the development,
manufacturing and commercialization of the product or service. An inaccurate forecasting
could mean company wide consequences (Kahn, 2000). However, doing accurate forecasting
for innovative products is a ‘frustrating, perhaps futile, effort because of minimal data, limited
analysis time and a general uncertainty surrounding a new product and the marketplace’
(Kahn, 2000).
What makes forecasting complicated is the fact that a product or service, that makes
use of a new, innovative technology, is usually yet to be launched. In the innovation literature
these products are known as radical or discontinuous innovations. Innovations can be thought
of as falling in a continuum from continuous orincremental innovation to discontinuous or
radical innovation (Veryzer, 1998). Continuous or incremental innovation refers to
improvements, upgrades and line extensions while radical or discontinuous innovations refer
to radically new products or services that involve dramatic leaps in terms of customer
familiarity and use (Veryzer, 1998). RFID enabled services are such radical innovations.
Instead of the currently needed human action to identify a product -by scanning a barcode- the
product now is sending out its identity by itself, and thus radically changing the arrangement
of the business process.
Precisely the necessary leap in what the customer is used to, makes common market
research, like the Delphi method (Jolson and Rossow, 1971), scenario planning, conjoint
analysis and the lead user method (von Hippel, 1986), typically not very useful to determine
which radical innovation will be most interesting in the future. This is due to the fact that new
information is always interpreted in the light of one’s own knowledge (Trott, 2001).
Therefore these approaches are commonly more useful to predict incremental innovations
(von Hippel, 1986; Trott, 2001).
The general problem statement for this research is formulated in terms of this
discussion. Many companies can benefit business-wise from a prediction of customers’ future
The problem statement for this research will therefore be:
The problem described above will be researched in depth in terms of a radically
innovative product. As a case study Radio Frequency Identification (RFID) is chosen. RFID
is a tracking, tracing and identification technology that has received a great amount of
attention in the last few years. The technology will be further described in the next section. “What is a valid method for future demand forecast for innovative strategic
2.1 RFID Technology and research
Tracking, tracing and identification systems are innovative technologies in information
systems. Tracking refers to the ability to localize a product in a supply chain; tracing is the
ability to find the origin and characteristics of a product (Doukidis & Pramatari, 2005) and
identification refers to the recognition of a unique entity. Unique identification enables
tracking and tracing. For obtaining detailed information about a specific object and its
whereabouts an identification system is essential. A system that is able to accomplish this
very specific identification is a system that makes use of radio frequency to broadcast its
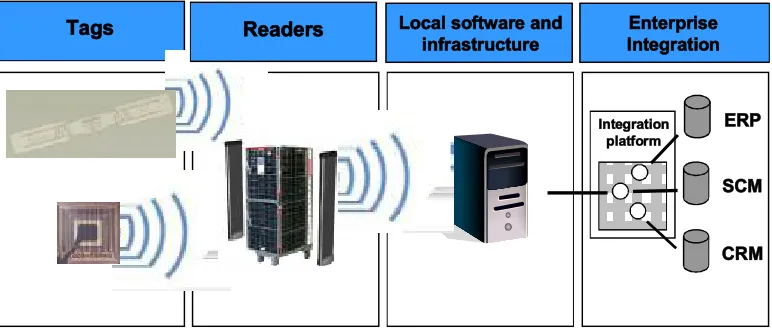
identity by sending out a unique code. Radio Frequency Identification, or RFID, is a wireless
tracking technology that allows a reader to activate a transponder on a radio frequency tag.
This tag can be attached to or imbedded in an item and allows the reader to remotely read the
tag, or write data onto it (Curtin, Kauffman & Rigggins, 2007). The information gathered is
translated by some kind of middleware into valuable information for the organisation (see
figure 2).
Figure 2. The RFID architecture.
By coupling an RFID system to some kind of communication device any tagged entity
can become a mobile, intelligent, communicating component of the organization’s overall
information infrastructure (Curtin et al., 2007). Because of the electronic identity that a
physical object obtains from the unique code it broadcasts, it is able to identify itself while
communicating with other objects. This turns physical objects in an internet of things (Glover
Ì¿¹- Ô±½¿´ -±º¬©¿®» ¿²¼
·²º®¿-¬®«½¬«®»
Û²¬»®°®·-» ײ¬»¹®¿¬·±²
ÛÎÐ
ÍÝÓ
ÝÎÓ
λ¿¼»®-& Bhatt, 2006). It can dramatically change the capabilities of an organisation to acquire a vast
array of data about the location and properties of a tagged entity (Curtin et al., 2007).
Especially the real-time information that can be gathered through RFID systems will
be interesting for companies that operate within a forecast driven process chain. These
companies often suffer from a phenomenon called theBullwhip effect. The information flow
within the chain is distorted as the demand information passes along the chain. Because
demand is hardly ever stable, every party in a chain will carry an inventory buffer, a safety
stock. This results in a distortion of demand information and implies that the manufacturer,
who only observes its immediate order data, will be misled by amplified demand (Lee,
Padmanabhan & Whang, 1997). RFID can help to prevent this effect by providing real-time
data about the actual demand of the several links of a value chain, without the information
having to pass trough the whole chain.
Early application areas involve tagging books for bookstores (Selexyz), tagging
consumer electronics for proof of delivery (Sony), tagging airplane parts for administration of
maintenance (Airbus), tagging luggage to avoid errors in baggage handling (Schiphol),
tagging equipment and medicine in hospitals (AMC), tagging waste containers to bill after
kilograms of waste offered (Rova), tagging assets and ID-cards in office buildings (Samskip)
and tagging crates for monitoring the supply chain of fresh vegetables (Schuitema). In spite of
these early applications RFID is not yet broadly utilized. The next paragraph will discuss the
adoption issues.
îòïòï ß¼±°¬·±²
·--«»-In the last few years many companies have become aware of the possibilities of RFID. The
technology is fairly developed and the applications seem endless. Nevertheless, the
technology has yet to become standard. However obvious the advantages of this innovation
seem, innovative IT-systems are complex to introduce. The description Utterback (1991)
gives of the several stages in the introduction of a new technology into an industry, which he
callswaves of change, is useful to describe these difficulties.
In these waves a parallel to an existing form is usually first created, and a dominant
design emerges. The existing form in case of RFID is the barcode. A passive technology that
requires line of sight for reading information. Barcoding still seems to be the standard at this
point. In a wave of change outsiders often seem to be the real innovators, resulting in
adoption of this technology means that all products, now containing barcodes, must be
provided with a RFID tag. And all barcode scanners must be replaced with RFID readers.
This transition will be costly and will take time. Therefore companies might be reluctant to
make this transition. At this point in the wave the innovation shifts from product to process
innovation as it affects the whole process it is embedded in. RFID affects the process by
giving exact information. This way, entities can always be backtracked. And because of the
real-time information, problems can be intervened even before they occur.
Utterback (1994) continues that there is a dual focus on cost and quality in a wave of
change. Because of the high cost of introducing process innovation, the costs must be as low
as possible but with a high level of quality. Costs in case of RFID consist, among other things,
of the tag itself, the applying of tags, purchasing and installing the readers, system integration
costs, training and reorganisation and the costs of implementing application solutions (Smith
& Konsynski, 2003). With regard to the costs of the tags, Sheffi (2004) states that a
widespread adoption of RFID will only happen when a tag becomes cheaper than five dollar
cents. It is needless to say that the quality cannot suffer.
Utterback (1994) lastly stresses the importance of innovation in the whole system. All
elements should be altered as to support the innovation. The introduction of RFID in a value
chain means that the whole chain should adopt this technology to be able to track entities the
entire chain trough. Because of the expenses involved, many companies wait for early
adopters to take on the costs (Clemons & Row, 1991). This way the copying firm learns from
the innovator and can use the same technology, at a lower cost.
This illustration of the wave of change clearly illustrates the difficulty of the adoption
of RFID. To lower the threshold for adopting RFID more research should be done. As the
technology behind RFID is becoming more and more mature, the focus of attention turns to
managerial and organizational issues (Curtin et al., 2007). Curtin et al. (2007) recently made a
research agenda for RFID in which three topics are proposed to especially receive research
attention. The topics are: the adoption dimension-how RFID is adopted and implemented by
organisations to solve business problems- the usage dimension–the way RFID is used within
processes, organizations and alliances- and the impact dimension –the way RFID impacts
individuals, business processes, organizations and markets.
Theadoption dimension for innovations in general received a fair amount of attention
a social system is determined by the following characteristics: the relative advantage should
be obvious in economic terms, social prestige, convenience, and satisfaction. The technology
should be compatible with the existing values, past experiences and needs of prospective
adopters. The complexity is important. It should be perceived as not difficult to comprehend,
implement and maintain. An innovation that is “trial-able” represents fewer uncertainties to
the individual who is considering it for adoption. Lastly, the observability is important. The
results of the innovation must be visible to others (Rogers & Scott, 1997). In summary,
innovations that are perceived by individuals as having greater relative advantage,
compatibility, trialability, observability, and less complexity will be adopted more rapidly
than other innovations (Rogers & Scott, 1997).
The adoption dimension for RFID and specifically for RFID services, is what is of
interest to this research. Before the usage and impact dimension (Curtin et al., 2007) can be
established it is important to find out which RFID services are perceived to satisfy the
description of Rogers and Scott (1997) for a trial-able product.
2.2 Telecommunication and RFID
Communication via RFID would mean an exceptionally high growth of business for
Telecommunication Companies (TelCo’s), who exploit networks necessary for the
transmission of sound, images and other data. In case of RFID not only we, as humans, make
contact with the network, but also “things” will do so, to communicate with other “things”.
These “talking things” will especially be beneficial when the corporate market gets interested.
When stocks can be kept up-to-date and business processes can be regulated from one central
point, were all information comes together. The adoption of RFID is therefore evidently of
great interest to TelCo’s.
KPN, a Dutch based, north-western Europe oriented Telecommunication Company,
has also taken a keen interest in the possibilities. KPN has thus commissioned this research
into the market demand for RFID.
îòîòï α§¿´ ÕÐÒ ÒòÊò
What is nowadays Royal KPN N.V. was founded as a state company for Post, Telegraphy and
Telephony (PTT) in the mid 19th century. The company name was changed into Koninklijke
PTT Nederland (KPN) when the company was privatised in 1989. In 1998 the post services
were split off to become an independent company, the TPG, and later TNT.
Nowadays KPN is the leading multimedia company in the Netherlands. KPN has been
a traditional telecommunication company focused on technology and products in the past, but
is now transforming into an independent commercial undertaking with a great variety of
multimedia services for consumers and fully managed ICT services for companies. The
mobile services cover the Netherlands, Germany and Belgium for corporate customers as well
as personal customers (Royal KPN N.V., 2006).
As a mission KPN describes “to deliver high-quality and reliable services to enable
its customers to reach their personal and business aims, both during work and in free time.”
(Royal KPN N.V., 2006).
As of December 31st 2007 KPN has over 35 million customers in the Netherlands,
Belgium and Germany, of which 27 million in wireless services, 5.4 million wire-line voice,
2.4 million in broadband internet and 0.5 million in television. At this moment KPN employs
over 25.500 individuals (Royal KPN N.V., 2007). KPN reports revenues of €12.6 billion and
an operating profit of €2.5 billion for the year 2007.
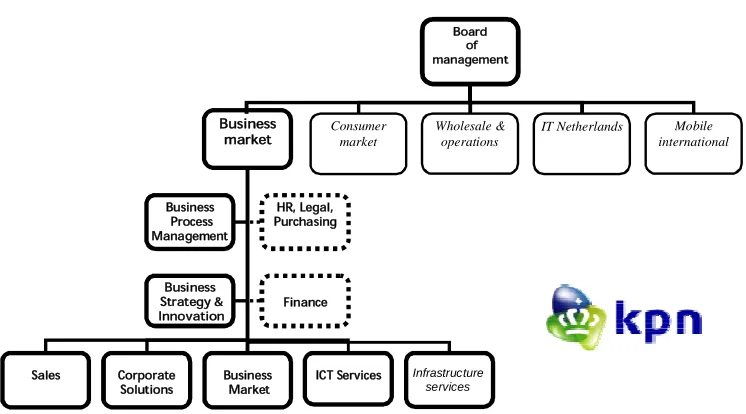
The department that is concerned with the development of Tracking, Tracing &
Identification services is Business Strategy & Innovation (BS&I). This is a staff department of
the Business Market division. The department develops new products and businesses to
support KPN’s growth ambitions. Within the department several venture teams work within a
given subject. The Tracking, Tracing & Identification venture team is one of these teams. The
next section will describe the strategy supporting the growth ambitions in detail.
îòîòî ÕÐÒ ¿²¼ -¬®¿¬»¹§
KPN has been a traditional telecom provider for as long as it exists. However, the traditional
telecom market is under severe pressure due to price erosions as well as the gradual
disappearance of traditional voice traffic and data traffic, like fax. New IP based technologies
can eventually make the old wire-line network obsolete. The traditional voice and data traffic
services through the physical network make up 70% of the current business. Therefore new
services must be developed to replace the traditional business. For the coming years KPN
will, for that reason, focus on online managed work stations, online applications and managed
services. Managed services are end-to-end services in which everything, from reselling of
These managed services also involve tracking, tracing and identification services.
Besides GPS, GSM and Wi-Fi, KPN is currently also looking into RFID.
îòîòí ÕÐÒ ¿²¼ ÎÚ×Ü
RFID includes many applications which make this technology interesting for businesses, for
internal operations as well as business to business logistics and business to consumer
marketing. At this moment KPN has developed real-time tracking and tracing services that
make use of RFID in mainly two areas. These services are focused on real-time, location
based assets and personnel tracking and on providing timely information for control in
logistic chains. The services have the working names Asset Management andValue Chain
Visibility. Both services will be explained and illustrated with pilot studies below.
2.2.3.1 Value Chain Visibility
A promising service is what KPN calls Value Chain Visibility (VCV). Within this service all
products -or crates which hold products- are tagged with an RFID chip which sends
information back to a central database at given steps of a process. This way the process can be
controlled from one location. In addition, problems can be intervened before they actually
occur. Problems like decay of fresh food or financial damage due to loss of high value goods
can be prevented with VCV services. The promising part of such a service for a TelCo is that
‘things are talking’. Not only humans make contact with a network, but also ‘things’ make
use of the network to communicate with other ‘things’. Also Curtin et al. (2007) have stated
that transportation, logistics and shipping are among the most interesting and potentially most
valuable application areas for RFID technology.
In the past two years KPN did two pilot studies for VCV services. In 2006 the
Telitrace Study started; a pilot study at TNT. Mobile phones and boxes were tagged and
readers and antennas were installed throughout the warehouse. The study learned that Value
Chain Visibility Services provide an improved efficiency and better and real-time insight in
stock levels in the warehouse, during transport and in the shops.
A recently completed study is the collaboration between Schuitema N.V., the
distribution centre of C1000, W. Heemskerk B.V., a supplier of fresh vegetables and KPN. In
this project RFID chips were attached to some thousands of crates, in which bundles fresh cut
chain. At a number of locations in the production company and the lorries of Heemskerk
B.V., the distribution centre of Schuitema N.V. and a C1000 supermarket RFID readers were
placed. By means of the combination of RFID and temperature tracking it was possible to
make use of the philosophyFirst Expired, First Out. The information gathered by the RFID
tag, was sent back by means of the fixed and mobile networks of KPN to a central database in
KPN’s CyberCenter. All parties concerned in the chain were able to consult this data
(Schuitema, 2006). This study is currently being evaluated.
2.2.3.2 Asset Management
Secondly KPN is involved in a project called Intelligent Building (I-building), an asset
management system that makes use of RFID.
A pilot study for I-building is currently taking place at Samskip B.V., a transport and
logistics company in Rotterdam. At Samskip B.V. every employee will receive a company
card containing an RFID chip. This chip refers to his information in a database. This can, for
example, be about the areas a specific employee is, or is not authorized to enter. After an
automatic check in the database some doors open automatically, and others stay closed.
Besides the company cards, also assets, like laptops and beamers, can be tagged. When an
employee leaves the building with a laptop that is not linked to his company card, a security
camera will automatically capture his leaving.
îòîòì ÕÐÒ ¿²¼ ³¿®µ»¬ ®»-»¿®½¸
For idea to product development, KPN uses a process divided in five phases. After every
phase a go or no-go decision is made. Successively the process contains the following phases:
Concept phase, marketing plan phase, launch preparation, launch and monitoring &
evaluation. Before starting this process, a team consisting of individuals from several
disciplines is assembled to investigate a development, of which the strategic department
observes that it fits the core competences of KPN –like the tracking, tracing & identification
team for RFID-. Such a team examines the chances for the specific development in
telecommunication.
At this moment determining whether a technology is a market chance for KPN, is
done based on primary market research, or what KPN calls ‘Klant inZicht’ (‘Customer
combined with conversations based on a questionnaire, which consists roughly out of three
parts; the first part discusses the company, the second part is about the currently used ICT and
the last part discusses some kind of innovative development, for instance RFID. The
questions serve as a guiding principle and are not fixed. The purpose of this questionnaire is
to identify possible drivers and barriers. The different comments are grouped afterwards into
common subjects, which serve as insights for developing new propositions and marketing
strategies.
This method does not lead to an actual forecast, but merely determines the situation as
it is. The problem of this method is that customer insights can only flow from their own real
world experience. This method, as a result, is likely to help innovate incrementally; however
radical innovation will be hard to accomplish.
KPN is interested in the future market demand for the innovative RFID enabled
services. This research will therefore focus on the selection of an appropriate method for
predicting future demand for these innovative services. In testing the selected model, an
estimation of this demand will be done as well. The next section will formulate the research
2.3 Research objectives
The method KPN currently uses, ‘Klant inZicht’ (‘Customer inSight’), is less useful for
supporting radical innovation. In order to forecast demand for an innovative product like
RFID another forecasting method will be needed. The first research objective will therefore
be:
The selected forecasting method will be applied to the field for RFID based real-time
services. A first indication for the possible success of an RFID product is the group of
customers that partnered in a trial with KPN involving an RFID service. The availability of all
details of the projects they partnered in, and the already established relationships with these
customers, makes this an interesting group for this research. However, this group of early
adopters alone will not represent the whole market. Therefore, contacts that have solid
experience with RFID will also be involved in this research.
The second question and sub question therefore are:
A second indication for the potential of a service would be the activities of other
parties involved in the RFID service business, i.e. the competitors. The philosophy is that a
successful service, provided by direct competition, might be successful for KPN as well.
However, through several ways it was attempted to get in contact with representatives of the
most interesting competitors, BT as well as with T-systems. These companies were 1 “What forecasting method is valid for KPN to use in this particular case?”
1.1 “Is the selected method appropriate for generic use within KPN
Business Strategy and Innovation?”
2. “What are the expectations of business customers for RFID based real-time
services that KPN should provide in the future?”
unfortunately not prepared to cooperate for strategic and legal reasons. Therefore this part of
the research was abandoned.
The next section will focus on choosing the right model to do a forecast for
RFID-based real-time services for KPN. In order to do so it will firstly discuss several issues in
forecasting future demand. Hereafter some accepted models are considered and compared. In
2.4 Forecasting in context
There are several methods available for the estimation of market demand for innovative
products. The methods used for such market research can be roughly divided into two
categories: exploratory methods and primary market research techniques(McBurney et al,
2002). Exploratory methods (or qualitative methods) do not collect the primary data from
prospect customers. Usually the participants are drawn from the management or a group of
experts. Primary market research techniques collect data through interviews with prospect
customers, like KPN does with its ‘Klant inZicht’ (‘Customer Insight’).
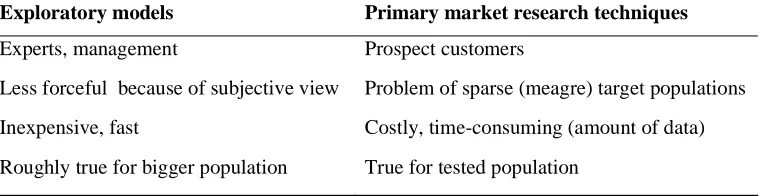
Table 1 displays the characteristics of exploratory methods and primary market
research techniques. The selection of a technique always depends on the situation in which it
will be applied. Current market research methods are typically not reliable at all, in case of
radically innovative products or product categories characterized by rapid change, such as
high technology products (von Hippel, 1986; Trott, 2001). In this instance no real markets
exist yet, because of the launch of new generations of technology. With primary market
research techniques the interviewed potential customers seem unable to understand the
product and to articulate their needs. Exploratory methods on the other hand are generally
perceived to be less persuasive then forecasts based on primary market research, because of
the subjective views of the marketplace (Mc.Burney et al., 2002).
Table 1. Characteristics of exploratory and primary market models
(deducted from McBurney et al.)
Exploratory models Primary market research techniques
Experts, management Prospect customers
Less forceful because of subjective view Problem of sparse (meagre) target populations
Inexpensive, fast Costly, time-consuming (amount of data)
Roughly true for bigger population True for tested population
However, the main problem with current research methods seems to be that the users
and experts, selected to provide input, are constrained by their own real world experience.
New information is always interpreted in the light of one’s own knowledge (Trott, 2001).
conflict with the familiar (von Hippel, 1986). When the function of an object is primed,
subjects become ‘fixed’ on the design function of the object (German & Barret, 2005); an
effect that Dunker (1945) has called functional fixedness. Because of this fixedness only
incremental innovations seem possible through market research. It can help fine-tuning an
existing concept, but it seldom is the source for an entirely new product concept (Hamel &
Prahalad, 1994). For many markets, like the food market, this is not a real problem. However
incremental innovation can be helpful for the more fast-moving technology and ICT market.
Sometimes the innovation will need to be more radical to stay on top of the market. The next
paragraph discusses some accepted methods in reference to the discussion above.
îòìòï ß½½»°¬»¼
³»¬¸±¼-The discussion of the models will be divided in exploratory models and primary market
research models. Out of both categories two frequently used models will be discussed.
2.4.1.1 Exploratory models
The first method to be discussed is the Delphi method (Jolson and Rossow, 1971). This is a
widely used exploratory, pure qualitative research method. Within this method the researcher
asks a group of experts individually about their opinions for the future of a product. After this
opinion is expressed, feedback is given about the answers of the other experts. In the light of
this new information the experts are allowed to adjust their opinion. The process is then
repeated until some kind of consensus is reached. Despite of Delphi being a widely adopted
method, it has been criticised for its artificial consensus due to the pressure for it and for
personal and situation specific biases (Woudenberg, 1991).
Another widely used exploratory method is scenario planning. This method has experts consider possible futures and then explore the consequences of those futures.
However for market categories in turbulent environments, there may be a large number of
influences and a consensus of the possible future will be difficult to reach (McBurney et al.,
2002). Furthermore it is difficult to really take innovations into consideration, when one starts
from the current situation. The problem with scenario planning is that it is based on a
technique called forward processing. Not the current situation as it should be, but the situation
fix this problem. Within such a technique a notion of an imaginary future is constructed and
the decision to be made is backtracked from this point (Saaty, 1980).
Both the Delphi method and scenario planning seem unsuitable for forecasting radical
innovation because of the consensus creation in both methods. Secondly, both methods only
use qualitative data and are not supported by quantitative data in any way. Additional
quantitative data could help interpret the qualitative data. Greene, Caracelli and Graham
(1989) identified this as one of five reasons to use a mixed method approach. Greene et al.
(1989) also point out that a mixed method increases the validity, meaningfulness, breadth,
depth and scope of the results.
2.4.1.2 Primary market research techniques
Primary market research techniques are less sensitive for the subjective market views that
exploratory methods cope with. Conjoint analysis is a quantitative example of such a technique. For new services a key marketing task is to decide what features are to be included
in a service package. Conjoint analysis is frequently used to this end. Within this technique,
customers are typically asked to rank hypothetical products, which sometimes only differ in
one feature, order of preference. The extent to which one product is preferred over another
can be calculated afterwards (McBurney et al., 2002). This technique is more persuasive than
exploratory techniques, however far more time-consuming. This is due to the intensive
interviews needed and the enormous amount of data to be evaluated afterwards.
Conjoint analysis, being a quantitative measurement tool, produces a less subjective
result. The results however lack an interpretation frame. Questions like ‘why does the
consumer like product x better than product y?’ and ‘Has the personal situation been of
influence in making this choice?’ typically will not be answered. Also the functional fixedness
can be expected to play a role within this technique. Products that do not match a customer’s
real world perspective may be discarded because of that (Trott, 2001). When this is taken into
consideration, conjoint studies seem mainly suitable for incremental innovation.
Von Hippel (1986) developed a currently widely used primary market research
technique, that deals with functional fixedness; the lead users method. Lead users are users whose present needs will become general in the market place months or years into the future.
Because these users are familiar with conditions which are in the future for most others, they
examples of major companies that successfully adopted this strategy to do their market
forecasts (Lilien, Morrison, Searls Sonnack & von Hippel, 2002),
However, the lead users concept is not without difficulties. Diffusion literature, i.e.
literature about the way innovations spread out, suggests that early adopters might differ from
the main users, so there might be some kind of translation needed (Von Hippel, 1986).
Furthermore, though lead users will be able to deal with innovative concept much better; it is
probable that they will suffer from functional fixedness to some degree as well. In addition,
because of the use of forward processing, the result will not be very innovative, but somewhat
conservative.
Geurts and Roosendaal (2001) propose a technique for estimating innovative change,
which can be used as a primary market research technique as well as an exploratory model. It
draws on a four-function framework from which interviews are established and in which the
results can be interpreted afterwards. The method uses the discussed interview technique
backward processing combined with provocative statements. This should encourage a
reaction based on invariant needs and bypass the problem of functional fixedness. The data
processing involves converting the qualitative data into quantitative data, making the
interpretation afterwards straightforward.
The method of Geurts and Roosendaal (2001) seems to overcome the mentioned
limitations of the discussed models for forecasting demand. This method is therefore selected
îòìòî Ú±®½»- ¿²¼ º«²½¬·±²- øÙ»«®¬- ¿²¼ α±-»²¼¿¿´ô îððï÷
According to Geurts and Roosendaal (2001) the base for an estimation of a direction of
innovative change should be twofold. Firstly, the validity of the measurement is essential.
This, because of the functional fixedness, can be a challenging task. Secondly, it is important
to recognize that there is a balance between all parties or stakeholders. This balance is similar
to one in an ecosystem. The balance serves as the starting point for the interviews and as an
interpretation frame for the results afterwards. The balance may change with the introduction
of an innovation.
Geurts and Roosendaal (2001) developed a multilevel model in which the core
activities and the forces governing a system should be rethought. This way a more general
system can be created instead of just taking the direct interest of the current stakeholders as a
starting point for the model. On the highest level of the model the forces of the market are
represented and inspired by this, on a somewhat lower level it illustrates the functions of the
product.
The method is based on the assumption that there are several forces present within a
market. Each of these forces pulls the market into a certain direction. On a lower level the
functions are influenced by this. These functions are invariant; however, the balance between
the functions can change. By mapping the balance between these functions, the direction of
innovative change can be estimated, according to Geurts and Roosendaal (2001). When all
forces and functions are taken into consideration, the model can serve as a general framework.
This way, a potential product can be related to the deeper level of the forces of the market and
the functions of the product.
The function part of this method for capturing the functional demands of a system is
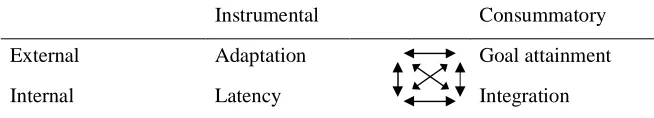
based on a theory proposed by Parsons (1967) named AGIL. This theory assumes that a social
system is an action system; a system of relationships of an actor to a situation (Parsons, 1967).
The system can be divided by two dimensions into four subsystems (see table 2). The first
dimension is the internal versus the external characteristics of a system. The second
dimension captures the instrumental versus the consummatory characteristics of a system. In
which consummatory characteristics point to the need of an actor for a relationship to an
object; instrumental characteristics on the other hand involve the need of an actor for help to
establish a relationship to an object (Parsons, 1967). The four subsystems that result from this
of these functions is a system on its own. In order for a system to be stable and have a
successful and continuing existence, there must be a balance between the functions (Parsons,
1967).
Table 2. Parsons’ AGIL scheme (1967)
Parsons’ scheme can be understood as a social system that functions in an
environment. The extent to which the system can control the environment as to provide for its
members is represented by Adaptation.Goal attainment refers to a systems need for collective
goals, to which activities can be devoted.The extent, to which the system is able to coordinate
the subsystems when conflicts between these subsystems occur, is the ability for Integration
of the system. Latency refers to the ability of a system to maintain the value pattern of a
system (Parsons, 1967).
The subsystems influence each other mutually -as depicted in table 2 by the arrows-;
the character of the whole system is determined by the way in which the subsystems influence
each other (Parsons, 1967).
The description of a social system is useful for estimating innovative change for a
certain product category. It captures the dynamics of a system and the reaction to external
influences. These influences can shift the balance between the functions, but never change the
functions itself.
This concept is illustrated by the following example in scientific communication
(Roosendaal and Geurts, 1998). The functions in scientific communication are identified as
registration, archiving, awareness, and certification. Scientific information used to be
communicated in a linear fashion, through books or magazines. The need for awareness and
archiving at this point in time was low. The internet caused a shift in the way scientific
information could be retrieved. The need for archiving and awareness of the information
became more apparent. As a result a more interactive network arose. This example shows that
Instrumental Consummatory
External Adaptation Goal attainment
however the balance between these functions has changed in the past decennia, the
composition is still the same!
Following the Geurts and Roosendaal method (2001), a model of functions is used as a
framework to establish interviews that can help determining the balance between the
functions. In addition, the model will serve as an interpretation frame afterwards. The
determined balance helps foreseeing the direction of innovative change. Subsequently it will
help foreseeing which products have a better probability of being successful.
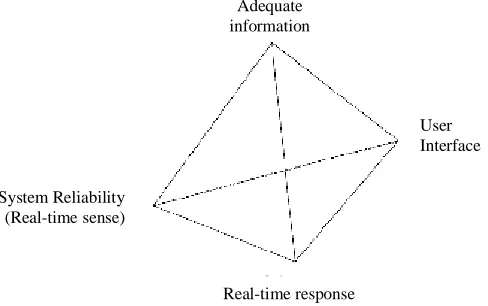
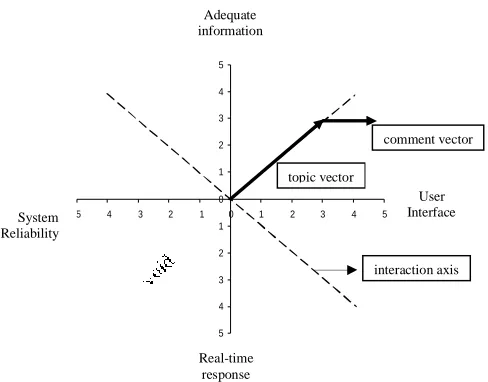
As interpretation frame Geurts and Roosendaal propose a model based on AGIL but
depicted in a three-dimensional figure, like in figure 4. Doing so, it is not necessary to
represent the functions in a specific order, because each order will result in the same figure,
be it turned. More over, each point within the three dimensional space can represent an
interaction between two, three or four functions. This way every balance between the
functions can be represented in the same model.
Figuur 4: The four functions in a three-dimensional model
2.4.2.1 The interview method
To determine the balance between the functions, and thereby the character of the system,
several topics are to be established. The introduction of a topic places the issue at hand in the
future (“in ten years from now…”). This introduction is followed by a provocative statement
concerning the interaction between two or more of the four functions. This introduction
combined with the statement should encourage the interviewee not to answer with a general
affirmative remark, but based on (latent) needs. The interviewee is then asked to react to the
statement on a quantitative five point scale (running from strongly disagree to strongly agree).
Agreeing in this case means that the interviewee expects the proposed shift in balance, a
neutral answer means that there is no perceived balance between the functions; disagreeing
means that there will be a shift, but in an opposite direction. This way the sketch of a possible
future gives information about the direction of the change.
In order to obtain information regarding the way the initial reaction should be
interpreted, (qualitative) probing questions like ‘Why do you think that?’ and ‘In what time
frame do you expect that..?’ can be posed. This should give information about the way the
proposed interaction between the functions is potentially influenced by the other functions.
The introduction, the provocative statement and the probing together should avoid functional
fixedness. To illustrate, this assume that the functions for retrieval of information are
timeliness, completeness, reliability and relevance. A possible statement on the interaction
between reliability and completeness is: In ten years from now timely information will only be
interesting when it’s complete. When the reaction of an interviewee is “I agree partially” and
his answer to the probing why-question is “I’m only interested in timely, complete
information when I know I can trust it”, then there is a three-way interaction; namely for
timeliness,completeness,reliability.
After some probing questions the interviewee is given the chance to revise the initial
reaction to the statement and to give a final reaction to the statement. The final reaction will
be used in the data-processing.
In the next chapter this model will be applied to the IT real-time service market in
íò ̸»±®§ ¿²¼
³»¬¸±¼-In order to answer both research questions 1 and 2 the method developed by Geurts and
Roosendaal (2001) will be used. It is important to keep in mind that predicting the success of
an innovative product or service, just like predicting the weather, isn’t an exact science. There
are routes that lead to an informed estimation or an educated guess, but these estimations will
still be based on assumptions.
This chapter will develop the model of the functions by the method of Geurts and
Roosendaal (2001) for estimating innovative change. For the purpose of this study only the
somewhat lower and less abstract level of the of the product functions is interesting.
Therefore only the future functional demands of the stakeholders for a product will be plotted.
The establishment of the questionnaire will also be commented.
3.1 The functions
The model will be applied to the system for RFID enabled real-time IT-services. To be able to
create the model of the functions, first of the goal of the system must by be determined. All
three of the other functions serve that goal. In case of the system of real-time IT services
offering adequate information is its goal. Therefore, this will serve as the function for the
subsystem ‘goal attainment’. Adequate information will refer to the degree in which the
information will be real-time, on time or afterwards, as well as to the degree to which the
information is relevant for the receiving end of the information. Adequate information is an
external function, meaning that ‘adequate information’ cannot be influenced by the system
itself, but is, in this case provided via a telecom provider, or more specifically KPN.
User interface is identified to represent the adaptation subsystem. By user interface is
meant: the way the information is presented to the user. This can be done in a personal way,
for example by e-mail or text message on a mobile phone, or through some kind of more
generally accessible management dashboard. Making the user aware of important information
and subsequently enable him to act on it, is the only means by which a real-time system can
control its environment. Just like adequate information, this function is an external one, which
The third function in this model is System Reliability, as function for the subsystem
integration. Shekhar and Ramachandra (2006) have developed a reference model for an RFID
enabled enterprise in which they named this specific function real-time sense and in their
definition it ‘comprises hardware for detecting or sensing physical events of business
significance’. This ‘sensing’ enables the system to integrate other systems and coordinate
between the subsystems. However, the technical part of this ‘sensing’ is not important for the
customers to understand. It is to be filled in by KPN afterwards. The only thing the customer
has to know is that the technology is reliable. As an illustration; it is not important for a driver
to know how his car works, to be able to use it. The driver only has to be able to use its
interface, being the steering wheel and the gas-, brake- and clutch pedal.
Lastlyreal-time response is identified as representing the latency part. This term too,
is chosen following the example of Shekhar and Ramachandra (2006). In their definition this
function is involved in interpreting and responding to the physical environment. In the current
research it also includes the degree to which the system can act independently on information
in predetermined scenarios. The system must, on basis of the provided data, independently
determine whether the situation is desirable and no action should be taken or whether the
situation is undesirable and action should be taken. In the latter the data should be acted upon
by the system itself in simple cases (for example grant or deny access) or communicated to a
human in more complex cases. This system-intelligence is what makes the difference between
the current situation, in which information can only become available after the fact, and the
new system, in which the information will be made available as it happens. The
three-dimensional model of the discussed functions is represented in figure 5.
Figure 5: The representation of the functions for real-time IT services
Adequate information
Real-time response
User Interface
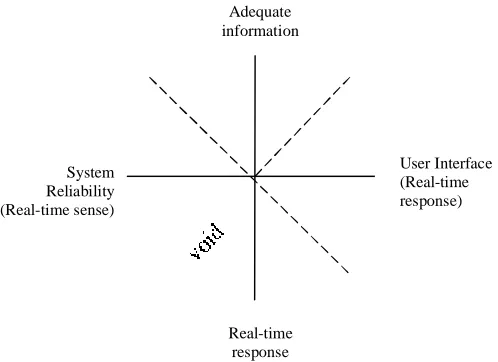
The three-dimensional model as depicted on the previous page is very useful when
every combination between the functions is meaningful. However, in this case, some of the
combinations are void. Firstly, the combination System Reliability–real-time responseis not
of value, because it is either without goal or connection with the end-user. In other words, this
combination doesn’t contribute to the goal, nor does it reach the user.
Secondly, the combination System Reliability- user interface is meaningless. However
the reliability of the user interface is interesting, the function System Reliability refers to the
accurateness with which the information is collected. The reliability of the user interface is
captured in the function user interface itself.
Lastly, the combination adequate information–real-time response is void. The
real-time response can only serve the goal by providing adequate information via a user interface.
More concrete, when it is decided through predetermined rules that the information is
important enough to be communicated to the users, but there are no means of communication,
this real-time response is of no value.
With the discussed combinations being void, a two-dimensional model as depicted in
figure 6 will be sufficient to depict all meaningful interaction axes.
Figure 6. The two-dimensional representation of the functions for real-time IT services
Adequate information
User Interface (Real-time response) System
Reliability (Real-time sense)
Now that the model of functions is established, the framework for the development of
the questionnaire and the interpretation of the results afterwards, is ready for use.
3.2 The business customers
íòîòï ̸» ·²¬»®ª·»©
The discussed interview method proposed by Geurts & Roosendaal (2001) was used. For the
interviews, two questionnaires were developed. One questionnaire for RFID services
concerning Asset Management and one for RFID services concerning Value Chain Visibility.
For the questionnaire ‘Asset Management’ twelve provocative statements were developed to
which the interviewees could react to. For the questionnaire ‘Value Chain Visibility’ thirteen
similar statements were established. The topics that were used in the interviews can be found
in appendix A.
Because the (potential) tracking and tracing customers of the KPN department
Business Strategy and Innovation formed the group of interviewees, no statements regarding
technology were incorporated. The technology, represented in the system reliability function,
is regarded to be external to the customer’s demands and internal to the service provider’s
process. In other words, it is not necessary for the customers to know how the technology
works, to be able to express their needs regarding it. This technology that is to be used to
make these wishes happen is to be filled in afterwards by the service provider. Statements
regarding the technology will therefore be of no interest.
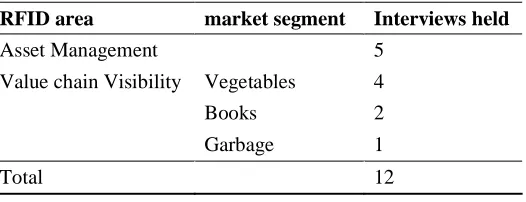
íòîòî Ü¿¬¿ ½±´´»½¬·±²
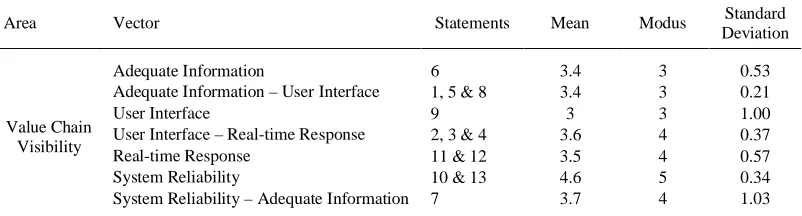
Table 3 shows the division of interviews per area. The data was collected from twelve
individuals. Five of the individuals had a business relation with KPN concerning Asset
Management. Three value chains, in which KPN was or still is involved for the development
of an RFID solution, were subject for the Value Chain Visibility interviews. Four of the
interviewees represented the links in ‘Vers Schakel’, the project where crates of fresh
vegetables were followed throughout the chain, mentioned earlier. Two of the interviewees