DOI : https://doi.org/10.32628/CSEIT195140
Enhancement in the Lifetime of Wireless Sensor Network
Bhumika Yadav1, Ram Neresh Sharma2
1Computer Science Engineering Department, Maharana Pratap College of Technology, Madhya Pradesh, India 2Assistant Professor, Computer Science Engineering Department, Maharana Pratap College of Technology,
Madhya Pradesh, India ABSTRACT
Technology changes every day and everyone wants to add more comfort in our life but some technologies increase the safety. Wireless Sensors are one of the technologies which increase the safety in our life in some manner. Wireless sensors are used in remote areas where human cannot survive to collect results of atmosphere, temperature and pressure. All the technical devices are work on electricity/battery and in remote area it is impossible to change batteries or provide continues power supply to sensors that is why we want to increase the lifetime of wireless sensor network in this paper. In this paper we are explaining our approach which is developed by us to increase the lifetime of wireless sensor network as well as we are comparing its results to some other technologies which are already present now a days.
Keywords : EES Scheme, LBM, REAR, Hybrid, Network Topology, Routing, Random Event Model
I. INTRODUCTION
In this paper I am evaluating the performance of my proposed approach and compare the sink lifetime achieved with existing EES schemes to place sink. Firstly I will describe my experimental setup to calculate the performance and later we discuss the results.
Experimental Setup
In this experiment I am going to measure how the network lifetime improves which is under a set of random events. The Coverage area of each event, start time, location and duration is randomly generated. Simulation is programmed with C language and running on Xcode in Mac OS C Lion. I have also used a number of different-different size networks and for each network size I am randomly generate several sensor distributions.
To validate our proposed schemes the simulation are running on 3 different network with different size and also with randomly distributed sensor nodes:
1. 160mX160m square sensing area with 100 sensors 2. 220mX220m square sensing area with 200 sensors 3. 360mX360m square sensing area with 500 sensors
Below mentioned grid topologies are used in our simulation
1. 160mX160m square sensing area with 100 sensors 2. 220mX220m square sensing area with 225 sensors 3. 360mX360m square sensing area with 400 sensors
Random Event Setup
For every set of simulation I consider 500 random events. The attributes of events such as start and end time etc are generated randomly and stored in a file as an input to simulator. In performance evaluation comparison in EES with 50 events in the simulation, my experiment has higher occurrence rate because I am considering the 500 random events are put into launce sequence during one simulation. The coverage are for each event varies from 6m to 30m in the network and the duration of the event varies from 1 unit time to maximum 3000 unit time in the system. The actual duration of an event will depend on specific application and the time may vary in millisecond, or in several minutes or in several hours.
In each time interval many events can start, many can end or many can continue. To define each time unit of the simulation the simulator uses a timeline, event file access, read Startn and Endn of every event and place them into corresponding sequence of launch for every time interval. When the simulation start simulation process and the simulation reach the time interval then it will generate pop event in the sequence and perform start or end activities.
Random event launch sequence
Other Parameters
Algorithm
LBM can be represented as
• S = the set of all sensors in the network
• pfinal = (Xs, Ys) the final position of the sink node • ptentative = (X’s, Y’s) the tentative position of the
sink node (for finding routes)
• pi = (xi, yi) the position of sensor node 𝑠𝑠𝑖𝑖∈𝑆𝑆.
• bi = Total number of bits transmitted by sensor node
𝑠𝑠𝑖𝑖∈𝑆𝑆.
• wi = Total number of bits generated by sensor node
𝑠𝑠𝑖𝑖∈𝑆𝑆 .
Step 1: Calculate tentative sink position ptentative =
Based on EES [51], use equations (3) and (4) to compute values for X’s and Y’s
Step 2: Calculate paths
Use Dijkstra’s algorithm [52] to compute the path
from each sensor 𝑠𝑠𝑖𝑖∈𝑆𝑆 to sink node at (X’s, Y’s) Step 3: Determine load on each sensor node
Load on
node-Step 4: Calculate final sink position
For the LBM algorithm
Finally the new location of the sink is determined in step 4
Result Analysis and Performance
I am comparing 4 different strategies in our comparisons
1. Location based sink placement (EES) 2. Load based sink placement (LBM) 3. Residual Energy aware routing (REAR) 4. Hybrid approach that combines both LBM
and REAR (Hybird).
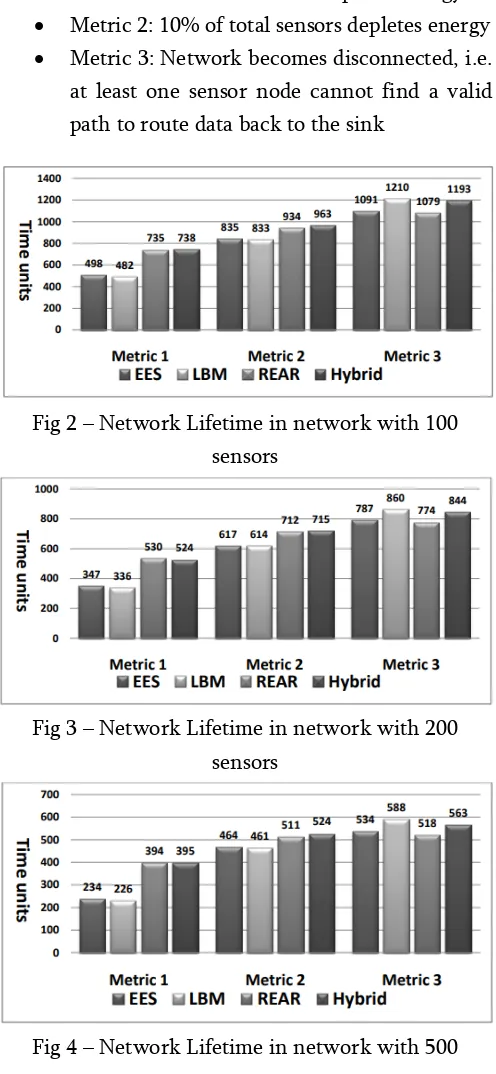
For each network size, we generated 5 different random topologies, and tested each topology with 5 sets of random events sequences. So, the results reported for the random networks are averages from the 25 runs. As mentioned earlier, different researchers have used different metrics to measure the lifetime of a wireless sensor network. In our simulations, we have taken the following commonly used metrics to measure network lifetime:
• Metric 1: First sensor node depletes energy
• Metric 2: 10% of total sensors depletes energy
• Metric 3: Network becomes disconnected, i.e. at least one sensor node cannot find a valid path to route data back to the sink
Fig 2 – Network Lifetime in network with 100 sensors
Fig 3 – Network Lifetime in network with 200 sensors
Fig 4 – Network Lifetime in network with 500 sensors
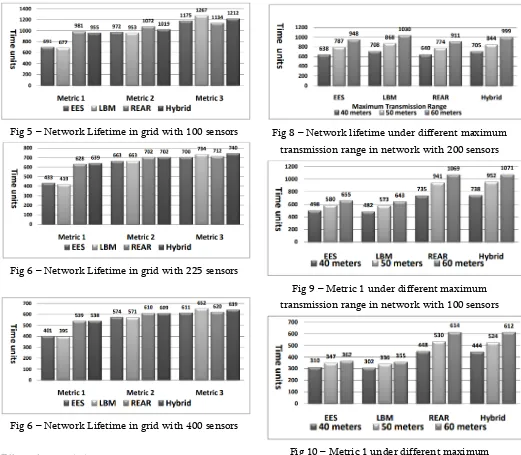
Fig 5 – Network Lifetime in grid with 100 sensors
Fig 6 – Network Lifetime in grid with 225 sensors
Fig 6 – Network Lifetime in grid with 400 sensors
Effect of transmission range
Fig 7 – Network lifetime under different maximum transmission range in network with 100 sensors
Fig 8 – Network lifetime under different maximum transmission range in network with 200 sensors
Fig 9 – Metric 1 under different maximum transmission range in network with 100 sensors
Fig 10 – Metric 1 under different maximum transmission range in network with 200 sensors
II. CONCLUSION
In this paper I have created an algorithm in which I have introduce two new methods in network lifetime in random event and time-based methods. In these kind of cases rand event happens regularly and end for a specific time slot. In the proposed scheme it is a mixture of LBM and REAR Technology which can balance the lifetime of wireless sensor network in much more efficient manner. In LBM method, it takes load of transmission and adjust the sink node position when an event occurs and the sink node is very heavily loaded. REAR technology is very helpful in the calculation to find routing path in the network.
We have used a simulator or we can call it custom node move from one place to another. We have also found that a particular matric is calculating the lifetime has very significant effect on performance.
III. REFERENCES
[1]. Romer, K and Mattern, F. The Design Space of Wireless Sensor Networks. IEEE Wireless Communications, 11(6), (2004) 54-61
[2]. D. Estrin, R. Govindan, J. Heidemann, S. Kumar, Next century challenges: scalable coordination in sensor networks, ACM
MobiCom’99, (Washington, USA, 1999), 263-270.
[3]. Bari. A. Relay node in Wireless Sensor Network: a survey. Computer Science, University of Windsor, Windsor, (2005)
[4]. Chong.C.Y. andKumar.S.P. Sensor Networks: Evolution, Opportunities and Challenges. Proceeding of the IEEE, 91(8), (2003) 1247-1256
[5]. Luo.F. Relay node placement and trajectory computation of mobile data collectors in wireless sensor networks. University of Windsor, Windsor, Master Thesis 2011
[6]. Akyildiz, I.F., Su, W.,Sankarasubramaniam, Y.,Cayirci, E. Wireless sensor networks: a survey. Computer Networks, (2002), 393-422. [7]. W. Heinzelman, A. Chandrakasan and H.
Balakrishnan.Energy efficient communication protocol for wireless micro-sensor networks. HICSS, (2000) 3005- 3014
[8]. J. Pan, Y. T. Hou, L. Cai, Y. Shi, and S. X. Shen.
Topology Control for Wireless Sensor
Networks. International Conference on Mobile Computing and Networking, (2003) 286-299.
[9]. ZhiAngEu; Seah, W.K.G. Impact of
Transmission Power And Routing Algorithms in Designing Robust Wireless Sensor Networks.
Personal, Indoor and Mobile Radio
Communications, (2007) 1-5 56
[10]. Y. Bi, L. Sun, N. Li. 2009. BoSS: a moving strategy for mobile sinks in wireless sensor networks. International Journal of Sensor Networks, 5(2009), 173-184
[11]. Nazir, B. and Hasbullah, H. Mobile Sink based Routing Protocol (MSRP) for Prolonging Network Lifetime in Clustered Wireless Sensor Network. Computer Applications and Industrial Electronics, (2010), 624 - 629.
[12]. G. Gupta, M. Younis. Fault-tolerant clustering of wireless sensor networks. Proceedings of IEEEWCNC, (2003), 1579 - 1584
[13]. G. Gupta, M. Younis. 2003. Performance evaluation of load-balanced clustering of wireless sensor networks. 10th International Conference on Telecommunications, (2003), 1577-1583
[14]. Bari, A and Jaekel, A, Techiques for Exploiting Mobility in Wireless Sensor Networks. Handbook of Research on Mobile Business:
Technical, Methodological and Social
[15]. Tian, K., Zhang, B., Huang, K. and Ma, J. Data Gathering Protocols for Wireless Sensor Networks with Mobile Sinks. IEEE Global Telecommunications Conference, (2010), 1 - 6. [16]. Wang, B., Xie, D., Chen, C., Ma, J. and Cheng,
S. Deploying Multiple Mobile Sinks in Event-Driven WSNs. Communications, (2008), 2293 - 2297.
Cite this article as :
Bhumika Yadav, Ram Neresh Sharma, "Enhancement in the Lifetime of Wireless Sensor Network", International Journal of Scientific Research in Computer Science, Engineering and Information Technology (IJSRCSEIT), ISSN : 2456-3307, Volume 5 Issue 1, pp. 185-190, January-February 2019.
Available at doi :
https://doi.org/10.32628/CSEIT195140

