| INVESTIGATION
Detection and Classi
fi
cation of Hard and Soft Sweeps
from Unphased Genotypes by Multilocus
Genotype Identity
Alexandre M. Harris,*,†Nandita R. Garud,‡and Michael DeGiorgio*,§,**,1
*Department of Biology,†Program in Molecular, Cellular, and Integrative Biosciences at the Huck Institutes of the Life Sciences,
§Department of Statistics, and **Institute for CyberScience, Pennsylvania State University, University Park, Pennsylvania 16802 and ‡Gladstone Institute, University of California, San Francisco, California 94158
ABSTRACTPositive natural selection can lead to a decrease in genomic diversity at the selected site and at linked sites, producing a characteristic signature of elevated expected haplotype homozygosity. These selective sweeps can be hard or soft. In the case of a hard selective sweep, a single adaptive haplotype rises to high population frequency, whereas multiple adaptive haplotypes sweep through the population simultaneously in a soft sweep, producing distinct patterns of genetic variation in the vicinity of the selected site. Measures of expected haplotype homozygosity have previously been used to detect sweeps in multiple study systems. However, these methods are formulated for phased haplotype data, typically unavailable for nonmodel organisms, and some may have reduced power to detect soft sweeps due to their increased genetic diversity relative to hard sweeps. To address these limitations, we applied the H12 and H2/H1 statistics proposed in 2015 by Garudet al., which have power to detect both hard and soft sweeps, to unphased multilocus genotypes, denoting them as G12 and G2/G1. G12 (and the more direct expected homozygosity analog to H12, denoted G123) has comparable power to H12 for detecting both hard and soft sweeps. G2/G1 can be used to classify hard and soft sweeps analogously to H2/H1, conditional on a genomic region having high G12 or G123 values. The reason for this power is that, under random mating, the most frequent haplotypes will yield the most frequent multilocus genotypes. Simulations based on parameters compatible with our recent understanding of human demographic history suggest that expected homozygosity methods are best suited for detecting recent sweeps, and increase in power under recent population expansions. Finally, we find candidates for selective sweeps within the 1000 Genomes CEU, YRI, GIH, and CHB populations, which corroborate and complement existing studies.
KEYWORDSexpected haplotype homozygosity; multilocus genotype; positive selection; hard sweep; soft sweep
P
OSITIVE natural selection is the process by which anadvantageous genetic variant rises to high frequency in a population, thereby reducing site diversity and creating a tract of elevated expected homozygosity and linkage disequi-librium (LD) surrounding that variant (Sabetiet al.2002). As beneficial alleles increase to high frequency in a population, the signature of a selective sweep emerges, which we can characterize from the number of haplotypes involved in the sweep (Maynard Smith and Haigh 1974; Schweinsberg and Durrett 2005; Hermisson and Pennings 2017). A hard sweep
is an event in which a single haplotype harboring a selectively advantageous allele rises in frequency, while in a soft sweep, multiple haplotypes harboring advantageous mutations can rise in frequency simultaneously. Thus, selective sweeps rep-resent a broad and nonhomogenous spectrum of genomic signatures. A selective event that persists until the beneficial allele reaches fixation is a completesweep, while a partial
sweep is one in which the selected allele does not reach
fixation. Consequently, expected haplotype homozygosity surrounding the selected site is greatest once the selected allele hasfixed and before recombination and mutation break up local LD (Przeworski 2002).
Two modes of soft sweeps have been proposed across three seminal papers, consisting of sweeps from standing genetic variation that becomes beneficial in a changing environment, or new recurrent de novo adaptive mutations (Hermisson and Pennings 2005; Pennings and Hermisson 2006a,b), and Copyright © 2018 by the Genetics Society of America
doi:https://doi.org/10.1534/genetics.118.301502
Manuscript received March 3, 2018; accepted for publication October 8, 2018; published Early Online October 12, 2018.
Supplemental material available at Figshare: https://doi.org/10.25386/genetics. 7128560.
1Corresponding author: Pennsylvania State University, 502 Wartik Laboratory,
these can be complete and partial as well. Unlike hard sweeps, where haplotypic diversity is decreased, in a soft sweep, haplotypic diversity remains, since multiple haplo-types carrying the adaptive allele rise to high frequency (Przeworskiet al.2005; Berg and Coop 2015). Patterns of diversity surrounding the selected site begin to resemble those expected under neutrality as the number of unique haplotypic backgrounds carrying the beneficial allele (the softness of the sweep) increases, potentially obscuring the presence of the sweep. Accordingly, the effect of a soft sweep may be unnoticeable, even if the selected allele has reachedfixation.
Popular modern methods for identifying recent selective sweeps from haplotype data identify distortions in the hap-lotype structure following a sweep, making use of either the signature of elevated LD or reduced haplotypic diversity surrounding the site of selection. Methods in the former category (Kelly 1997; Kim and Nielsen 2004; Pavlidiset al.
2010) can detect both hard and soft sweeps, as neighboring neutral variants hitchhike to high frequency under either scenario. Indeed, LD-based methods may have an increased sensitivity to softer sweeps (Pennings and Hermisson 2006b), especially relative to methods that do not use hap-lotype data, such as composite likelihood approaches (Kim and Stephan 2002; Nielsenet al.2005; Chenet al.2010; Vy and Kim 2015; Racimo 2016). Haplotype homozygosity-based methods include iHS (Voight et al. 2006), its ex-tension, nSL (Ferrer-Admetlla et al. 2014), and H-scan (Schlampet al.2016). These approaches identify a site un-der selection from the presence of a high-frequency haplo-type. Additionally, Chen et al.(2015) developed a hidden Markov model-based approach that similarly identifies sites under selection from the surrounding long, high-frequency haplotype.
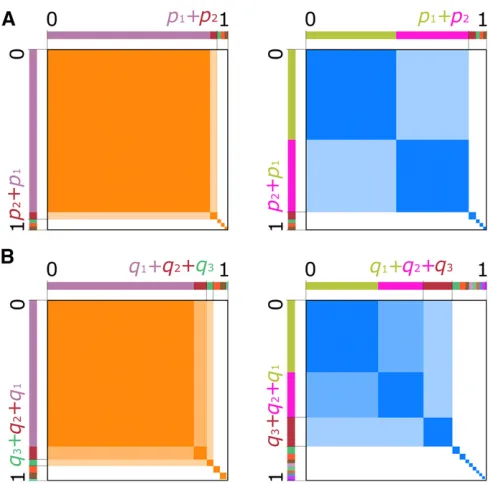
While the aforementioned methods are powerful tools for identifying selective sweeps in the genome, they lack the ability to distinguish between hard and soft sweeps. It is this concern that Garudet al.(2015) address with the statistics H12 and H2/H1. H12, a haplotype homozygosity-based method, identifies selective sweeps from elevated expected haplotype homozygosity surrounding the selected site. It is computed as the expected haplotype homozygosity, with the frequencies of the two most frequent haplotypes pooled into a single frequency:
H12¼ ðp1þp2Þ2þ
XI
i¼3
p2i; (1)
where there areIdistinct haplotypes in the population, and
piis the frequency of theith most frequent haplotype, with p1$p2$⋯$pI:Pooling the two largest haplotype frequen-cies provides little additional power to detect hard sweeps relative to H1, the standard measure of expected haplotype homozygosity, where H1¼PIi¼1p2
i (Figure 1A, left panel). However, pooling provides more power to detect soft sweeps, in which at least two haplotypes rise to high frequency, and
the distortion of their joint frequency produces an elevated expected haplotype homozygosity consistent with a sweep (Figure 1A, right panel).
In conjunction with an elevated value of H12, the ratio H2/H1 serves as a measure of sweep softness, and is not meaningful on its own. H2 is the expected haplotype ho-mozygosity, omitting the most frequent haplotype, com-puted as H2¼H12p2
1;and is larger for softer sweeps. In the case of a soft sweep, the frequencies of the first- and second-most frequent haplotypes are both large, and omitt-ing the most frequent haplotype still yields a frequency distribution in which one haplotype predominates. Under a hard sweep, the second throughIth haplotypes are likely to be at low frequency and closer in value, such that their expected homozygosity is small. Thus, while H2,H1 in all cases, the value of H2 is closer to that of H1 under a soft sweep.
To leverage the power of H12 and H2/H1 to detect sweeps in nonmodel organisms, for which phased haplotype data are often unavailable, we extend the application of these statistics to unphased multilocus genotype (MLG) data as G12 and G2/G1. MLGs are single strings representing a diploid indi-vidual’s allelic state at each site as homozygous for the reference allele, homozygous for the alternate allele, or het-erozygous. Similarly to H12, we define G12 as
G12¼ ðq1þq2Þ2þ
XJ
j¼3
q2j; (2)
where there areJdistinct unphased MLGs in the population, andqjis the frequency of thejth most frequent MLG, with q1$q2$⋯$qJ:As with haplotypes, pooling the most fre-quent MLGs only provides marginally more resolution to de-tect hard sweeps, as only a single predominant unphased MLG is expected under random mating (Figure 1B, left panel). However, because the input data for G12 and G2/G1 are unphased MLGs, we define another statistic that is uniquely meaningful in this context. The presence of mul-tiple unique haplotypes at high frequency under a soft sweep implies not only that the frequency of individuals homozy-gous for these haplotypes will be elevated, but also that the frequencies of their heterozygotes will be elevated. When haplotypesXandYboth exist at high frequency, diploid indi-viduals of type XX; YY;and XY will also exist at high fre-quency, assuming individuals mate randomly within the population (Figure 1B, right panel). Therefore, we can define a statistic truly analogous to H12 for unphased MLG data, G123. This statistic is calculated as
G123¼ ðq1þq2þq3Þ2þ
XJ
j¼4
q2j: (3)
the presence of one or more high-frequency MLGs implies a sweep, even if any one of theXX;YY;orXYMLGs is absent. We show through simulation and empirical application that the MLG identity statistics G12 and G123, in conjunction with the ratio G2/G1, both maintain the power of the expected haplotype homozygosity statistic H12 to detect and classify sweeps, without requiring phased haplotype input data. Furthermore, as a closer analog to H12, the use of G123 with G2/G1 more closely maintains the classification ability of H12 with H2/H1 than does G12. Generally, we find that the selective events visible with H12 in phased haplotype data are visible to G12 and G123 in unphased MLG data, with trends in power and genomic signature of the applica-tions remaining consistent with one another. Accordingly, we recover well-documented sweep signatures at LCT and
SLC24A5in individuals with European ancestry (Bersaglieri
et al.2004; Sabetiet al.2007; Gerbaultet al.2009), with the latter also detected in South Asian individuals (Coopet al.
2009; Mallick et al.2013), as well as the region linked to
EDARin East Asian populations (Fujimotoet al.2007; Bryk
et al.2008; Pickrellet al.2009), andSYT1in African individ-uals (Voightet al.2006). In addition, we identify novel can-didatesRGS18in African individuals,P4HA1in South Asian individuals, andFMNL3in East Asian individuals.
Materials and Methods
Simulation parameters
To compare the powers of G12 and G123 to detect sweeps relative to H12 and H123 (Garudet al.2015), we performed simulations for neutral and selection scenarios using SLiM 2 (version 2.6) (Haller and Messer 2017). SLiM is a gen-eral-purpose forward-time simulator that models a popula-tion according to Wright-Fisher dynamics (Fisher 1930; Wright 1931; Hartl and Clark 2007) and can simulate com-plex population structure, selection events, recombination, and demographic histories. For our present work, we used SLiM 2 to model scenarios of recent selective sweeps, long-term background selection, and neutrality, additionally including models of population substructure and pulse admix-ture. Our models of sweeps comprised complete and partial hard sweeps, as well as soft sweeps from selection on stand-ing variation (SSV). For background selection, we simulated a gene with introns, exons, and untranslated regions (UTRs) in which deleterious mutations arose randomly. We addition-ally tested the effect of demographic history on power by examining constant population size, population expansion, and population bottleneck models for hard sweep scenarios.
General approach
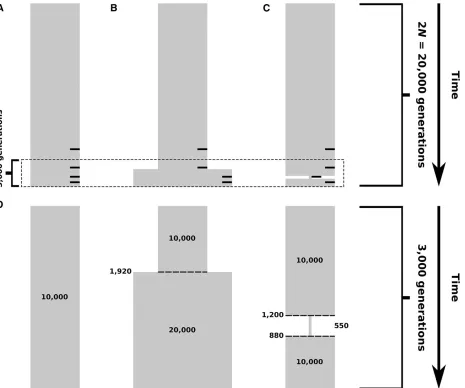
Wefirst simulated data according to human-specific param-eters for a constant population size model. For simulated sequences (Figure 2, A and D), we chose a mutation rate of m¼2:531028per site per generation, a recombination rate ofr¼1028per site per generation, and a diploid population size ofN¼104(Takahataet al.1995; Nachman and Crowell 2000; Payseur and Nachman 2000). All simulations ran for a duration of 12Ngenerations, whereNis the starting popula-tion size for a simulapopula-tion, equal to the diploid effective pop-ulation size. The duration of simpop-ulations is the sum of a 10N
generation burn-in period of neutral evolution to generate equi-librium levels of variation across simulated individuals (Messer 2013), and the expected time to coalescence for two lineages of 2Ngenerations. Simulation parameters were scaled, as is com-mon practice, to reduce runtime while maintaining expected levels of population-genetic variation, such that mutation and recombination rates were multiplied by a factorl, while pop-ulation size and simpop-ulation duration were divided by l. For simulations of constant population size, we usedl¼20:
Scenarios involving population expansion and bottleneck were modeled on the demographic histories inferred by Lohmuelleret al.(2009). For population expansion (Figure 2, B and D), we usedl¼20;and implemented the expansion at 1920 unscaled generations before the simulation end time. After expansion, the size of the simulated population doubled
Figure 1 Visual representation of the haplotype- and MLG-based statis-tics. For all panels, the total area of the orange or blue squares within a panel represents the value of the statistics. Hard sweep scenarios are in orange, and soft sweeps are in blue. (A) Under a hard sweep (left), a single haplotype rises to high frequency, p1;so the probability of sam-pling two copies of that haplotype is p2
from 104to 23104diploid individuals. This growth in size corresponds to the increase in effective size of African pop-ulations that occurred48,000 years ago (Lohmuelleret al.
2009), assuming a generation time of 25 years. Population bottleneck simulations (Figure 2, C and D) were scaled by l¼10;began at 1200 generations before the simulation end time, and ended at 880 generations before the simulation end time. During the bottleneck, population size fell to 550 dip-loid individuals. This drop represents the8000-year bottle-neck that the population ancestral to non-African humans experienced as it migrated out of Africa (Lohmueller et al.
2009), assuming a generation time of 25 years.
Simulating selection
Our simulated selection scenarios encompassed a variety of se-lection modes and parameters. Though we primarily focused on
selective sweeps, we additionally modeled a history of long-term background selection to test the specificity of methods for sweeps. Background selection may decrease genetic diversity relative to neutrality. For sweep experiments specifically, we tested the power of methods to detect selection occurring between 40 and 4000 generations prior to the simulation end time (thus, within 2N generations prior to sampling). We set the site of selection to be at the center of the simulated chromosome, and performed two categories of simulations, allowing us to answer two distinct types of questions about the power of our approach: whether G12 and G123 properly identify the signature of a selective sweep (the detection experiments), and whether G12 or G123 in conjunction with G2/G1 can distinguish between hard and soft sweeps, and ultimately infer the number of selected haplotypes (k; the clas-sification experiments), and hence“softness”of the sweep.
Figure 2 Simulated demographic models. Selection events, where applicable, occurred within 2Ngenerations of sampling, indicated by small black bars on the right side of (A–C) corresponding to selection 4000, 2000, 1000, and 400 generations before sampling. (A) Constant-size model. Diploid population size is 104individuals throughout the time of simulation. (B) Model of recent population expansion. Diploid population size starts at 104 individuals and doubles to 23104individuals 1920 generations ago. (C) Model of a recent strong population bottleneck. Diploid population size starts
at 104individuals and contracts to 550 individuals 1200 generations ago, and subsequently expands 880 generations ago to 104individuals. (D) View of
For the detection experiments (seeDetecting sweeps), we simulated chromosomes of length 100 kb under neutrality and for each set of selection parameters, performed 103 rep-licates of sample sizen= 100 diploids (andn= 25 for hard sweep experiments in Supplemental Material, Figure S19). Here, wefixed the times (t) at which selected alleles arise to be 400, 1000, 2000, or 4000 generations prior to sampling (Figure 2), and selection coefficients (s) to be either 0.1 or 0.01, representing strong and moderate selection, respec-tively. The parameterstandswere common to all selection simulations of thefirst type, with additional scenario-specific parameters, which we subsequently define. For the classifi -cation experiments (seeDifferentiating between hard and soft sweeps), we performed two types of simulations. First, we simulated 106replicates of n = 100 diploids for each sce-nario, withs2 ½0:005;0:5;drawn uniformly at random from a natural log-scale, andt2 ½40;2000(also drawn uniformly at random from a natural log-scale), across chromosomes of length 40 kb. With these simulations, we assessed the occu-pancy of specific hard and soft sweeps among (G12, G2/G1), (G123, G2/G1), (H12, H2/H1), and (H123, H2/H1) test points. Second, we simulated 5 3 106 replicates with
s2 ½0:05;0:5andt2 ½200;2000and all other parameters as previously. Here, we assigned the most probablekto each test point from the posterior distribution ofkamong nearby test points, drawingk2 f1;2;. . .;16guniformly at random. We scaled selection simulations as previously described.
We first examined hard sweeps, in which the beneficial mutation was added one randomly-drawn haplotype from the population at timet, remaining selectively advantageous un-til reaching a simulation-specified sweep frequency (f) be-tween 0.1 and 1.0 at intervals of 0.1, where f,1:0 represents a partial sweep andf¼1:0 is a complete sweep (tofixation of the selected allele). Although we conditioned on the selected allele not being lost during the simulation, we did not require the selected allele to reachf. We additionally modeled soft sweeps from SSV. For this scenario, we intro-duced the selected mutation to multiple different, but not necessarily distinct, randomly -drawn haplotypes (k) such thatk¼2;4, 8, 16, or 32 haplotypes out of 2N¼103(scaled haploid population size) acquired the mutation at the time of selection. We did not condition on the number of remaining selected haplotypes at the time of sampling as long as the selected mutation was not lost.
For hard sweeps only, we additionally examined the ef-fects of three common scenarios—population substructure, pulse admixture, and missing data—on performance. The population substructure model consisted of six demes in a symmetric island migration model in which migration be-tween each deme is constant at rate mper generation for the duration of the simulation (Figure S21A). We simulated
m2 f1025;1024;1023;1022;1021g All demes were identi-cal in size at N¼1660 (unscaled) diploid individuals, and samples consisted ofn¼100 diploid individuals, with 50 in-dividuals sampled from each of two demes. Thus, asm in-creases, the structured model converges to the unstructured
model ofN¼104(unscaled) diploid individuals. Our admix-ture scenarios examined a single pulse of gene flow from an unsampled donor population into the sampled target at ratem2 f0:05;0:10;0:15;0:20;0:25;0:30;0:35;0:40g; occur-ring 200 generations prior to sampling (Figure S21B). We performed experiments in which the donor had a (unscaled) diploid size ofN¼103;104;or 105;keeping the size of the targetfixed atN¼104:For admixture simulations, a single population of size 104diploids evolves neutrally until it splits into two subpopulations at 4000 generations before sam-pling. We selected the divergence and admixture times to approximately match the timing of these events in sub-Saharan African populations (Veeramah et al.2011; Busby
et al.2016). Sample sizes were ofn¼100 diploids, matching the standard hard sweep experiments.
To simulate missing data in the sampled population, we followed a random approach. Using data generated for the previous simple hard sweep experiment, we removed data from a random number of SNPs in each replicate sample, between 25 and 50, drawing these sites from locations throughout the simulated sequence uniformly at random. At each missing site, we assigned a number of the sampled individuals, between one andfive, uniformly at random, to have their genotypes missing at the site. We then accounted for missing data in one of two ways. First, we omitted any SNP with missing data in each analysis window. This reduced the number of SNPs included in each computation. Second, we assigned any haplotype or MLG with missing data as an entirely new string. Thus, the number of distinct haplotypes and MLGs increases when sites are missing, providing a more conservative approach than thefirst.
Finally, our single scenario of background selection was intended to quantify the extent to which the long-term re-moval of deleterious alleles in a population, which reduces nearby neutral genetic diversity, would mislead each method to make false inferences of selective sweeps. We generated a 100 kb chromosome containing an 11 kb gene at its center and allowed it to evolve over 12Ngenerations under a con-stant-size demographic model. The gene was composed of 10 exons of length 100 bases with 1 kb introns separating each adjacent exon pair. Thefirst and last exons wereflanked by UTRs of length 200 bases at the 59end and 800 bases at the 39end. Strongly deleterious mutationsðs¼ 20:1Þarose at a rate of 50% in the UTRs, 75% in exons, and 10% in introns, while mutations occurring outside of the genic re-gion were neutral. To measure the confounding effect of background selection, we observed the overlap between the distributions of maximum G12, G123, H12, and H123 values of 103simulated replicates under neutrality and background selection. Our model here is identical to that of Chenget al.
(2017), with the sizes of genetic elements based on human mean values (Mignoneet al.2002; Sakharkaret al.2004).
Detecting sweeps
windows of length 40 kb, advancing by 4 kb increments. We chose this window size primarily because the mean value of LD between pairs of loci across the chromosome decays be-low one-third of its maximum value over this interval (Figure S1), and because this was the window size with which we analyzed all non-African populations from the 1000 Genomes dataset. Window size also affects sensitivity to sweeps by constraining the minimum strength of selective sweeps we can detect. That is, with our chosen window size, we are likely to detect sweeps withs.0:004;because such sweeps will generate genomic footprints on the order of 40 kb for our simulated population size ofN¼104:We computed this value as F¼s=ð2r lnð4NsÞÞ;whereFis the size of the foot-print in nucleotides,sis the per-generation selection coeffi -cient,ris the per-base, per-generation recombination rate, andNis the effective population size (Gillespie 2004; Garud
et al.2015; Hermisson and Pennings 2017).
For experiments measuring power at defined time points, we recorded the chromosomal maximum value of G12, G123, H12, or H123 across all windows as the score for each of 103replicates of 100 kb chromosomes. Selection simulation scores provided us with a distribution of values that we com-pared with the distribution of scores generated under neutral parameters. We define a method’s power for each of our specified time intervals at the 1% false positive rate (FPR). This measures the proportion of our 1000 replicates gener-ated under selection parameters with a score greater than the top 1% of scores from the neutral replicates. The method performs ideally if the distribution of its scores under a sweep does not overlap the distribution of scores for neutral simu-lations;i.e., if neutrality can never produce scores as large as a sweep.
In addition to power, we also tracked the mean scores of G12 and G123 across simulated 1 Mb chromosomes at each 40 kb window for all selection scenarios at the time point for which power was greatest. In situations where G12 or G123 had the same power at more than one time point (this oc-curred for strong selection within 1000 generations of sam-pling), we selected the most recent time point in order to represent the maximum signal, since mutation and recombi-nation erode expected haplotype homozygosity over time. This analysis allowed us to observe the interval over which elevated scores are expected, and additionally define the shape of the sweep signal.
Differentiating between selection scenarios
Experiments to test the ability of G2/G1 to correctly differ-entiate between soft and hard sweeps, as H2/H1 can (condi-tioning on a G12 or G123 value for G2/G1, or an H12 or H123 value for H2/H1), required a different simulation approach than did the simple detection of selective sweeps. Whereas multiple methods exist to identify sweeps from extended tracts of expected haplotype homozygosity, the method of Garudet al.(2015) classifies this signal further to identify it as deriving from a soft or hard sweep. As did Garud et al.
(2015), we undertook an approximate Bayesian computation
(ABC) approach to test the ability of our method to distin-guish soft and hard sweeps. To demonstrate the ability of G2/G1 conditional on G12 and G123 to differentiate be-tween sweep scenarios and establish the basic properties of the (G12, G2/G1) and (G123, G2/G1) distributions, we sim-ulated sequences of length 40 kb under a constant popula-tion size demographic history (Figure 2A) with a centrally located site of selection. Here, we treated the whole simu-lated sequence as a single window.
For ABC experiments to classify test points as hard or soft from afixed number of different selected haplotypesk, we performed 106simulations for each selection scenario, drawing selection coefficients sand selection times t uni-formly at random from a log-scale as previously described. Soft sweeps from SSV were generated fork¼5 andk¼3 starting haplotypes (out of a scaled 2N¼103 haploids). Soft sweeps generated under randomtandswere compared with hard sweeps generated under random t and s, with completion of the sweep possible but not guaranteed. From the resulting distribution of scores for each simulation type, we computed Bayes factors (BFs) for direct comparisons between a hard sweep scenario and either soft sweep scenario.
For two selection scenariosAandBand a (G12, G2/G1) or (G123, G2/G1) test point (or haplotype statistic test point), we compute BFs as the number of simulations of typeA yield-ing results within a Euclidean distance of 0.1 from the test point, divided by the number of simulations of typeBwithin that distance. Here, test values of (G12, G2/G1) and (G123, G2/G1) are each plotted as a 100 3 100 grid, with both dimensions bounded by ½0:005;0:995 at increments of 0.01. In the work of Garud et al.(2015), soft sweeps were of typeAand hard sweeps were of typeB, and we retain this orientation in our present work. Following these definitions, a BF less than one at a test coordinate indicates that a hard sweep is more likely to generate such a (G12, G2/G1) or (G123, G2/G1) pair, whereas a BF larger than one indicates greater support for a recent soft sweep generating that value pair. As do Lee and Wagenmakers (2013), we define BF$3 as representing evidence for selection scenarioAproducing a similar paired (G12, G2/G1) or (G123, G2/G1) value as the test point, and BF$10 to represent strong evidence. Simi-larly, BF#1=3 is evidence in favor of scenario B, and BF#1=10 is strong evidence. We performed analyses for both MLG and haplotype data to demonstrate the effect of data type on sweep type inference.
yielded an ambiguous result, and all test points were assigned a most probablek.
Analysis of empirical data
We evaluated the ability of G12, G123, and H12 to corroborate and complement the results of existing analyses on human data. Because G12 and G123 take unphased diploid MLGs as input, we manually merged pairs of haplotype strings for this dataset [1000 Genomes Project, Phase 3 (1000 Genomes Project Consortiumet al.2015)] into MLGs, merging haplo-type pairs that belonged to the same individual. We also complemented the individual-centered approach by ran-domly merging pairs of haplotypes to produce a sample of individuals that could arise under random mating. Our ap-proaches therefore allowed us to determine the effect of us-ing different data types to infer selection. Unlike biallelic haplotypes, MLGs are triallelic, with an indicator for each homozygous state and the heterozygous state. Thus, there are at least as many possible MLGs as haplotypes, such that a sample with I distinct haplotypes can produce up to
IðIþ1Þ=2 distinct MLGs.
We scanned all autosomes using nucleotide-delimited ge-nomic windows, proportional to the effective size of the study population, and the interval over which the rate of decay in pairwise LD plateaus empirically (see Jakobssonet al.2008). For the 1000 Genomes YRI population, we employed a win-dow of length 20 kb sliding by increments of 2 kb, whereas for non-African populations (effective population size ap-proximately half of YRI) we used a window of 40 kb sliding by increments of 5 kb (seeResults). This means that we were sensitive to sweeps from approximately s$0:002 for YRI, and approximately s$0:004 for the others. We recorded G12, G123, and H12 scores for all genomic windows, and subsequentlyfiltered windows for which the observed num-ber of SNPs was less than a certain threshold value in order to avoid biasing our results with heterochromatic regions for which sequence diversity is low in the absence of a sweep. Specifically, we removed windows containing fewer SNPs than would be expected (Watterson 1975) when two line-ages are sampled, which is the extreme case in which the selected allele has swept across all haplotypes except for one. For our chosen genomic windows and all populations, this value is 4Nem3ðwindow size in nucleotidesÞ ¼40 SNPs, where Ne is the diploid effective population size and m is the per-site per-generation mutation rate. As in Huber
et al.(2016), we additionally divided each chromosome into nonoverlapping 100 kb bins and removed sites within bins whose mean CRG100 score (Derrienet al.2012), a measure of site mappability and alignability, was ,0.9. Filtering thereby removed additional sites for which variant calls were unreliable, making no distinction between genic and non-genic regions.
Following a scan, we intersected selection signal peaks with the coordinates for protein- and RNA-coding genes and generated a ranked list of all genomic hits discovered in the scan for each population. We used the coordinates for human
genome build hg19 for our data, to which Phase 3 of the 1000 Genomes Project is mapped. The top 40 candidates for each study population were recorded and assignedP-values and BFs. Specifically, we simulated sequences following the estimates of population size generated by Terhorst et al.
(2017) from smc++ using ms (Hudson 2002) to assign
P-values and SLiM 2 to assign BFs, with per-generation, per-site mutation and recombination rates of 1:2531028 and 3:12531029 (Narasimhan et al.2017; Terhorst et al. 2017), and sample sizes for each population matching those of the 1000 Genomes Project. For P-value simulations, we selected a sequence length uniformly at random from the set of all hg19 gene lengths, appended the window size used for scanning that population’s empirical data to this se-quence, and used a sliding window approach, retaining in-formation from the window of maximum G12, G123, or H12 value. For BF simulations, we used simulated sequence lengths of either 20 kb for YRI or 40 kb for others, to match the strategy of empirical scans. That is, once we have
identi-fied an elevated sweep signal within a window, we then seek to classify it as hard or soft.
We assignedP-values by generating 106replicates of neu-trally evolving sequences, where theP-value for a gene is the proportion of maximum G12 (or G123 or H12) scores gener-ated under neutrality that is greater than the score assigned to that gene. After Bonferroni correction for multiple test-ing (Neyman and Pearson 1928), a significantP-value was
p,0:05=23;7352:1065931026; where 23,735 is the number of protein- and RNA-coding genes for which we assigned a G12 (or G123 or H12) score. To assign BFs, we simulated 106replicates of hard sweep and SSVðk¼5Þ sce-narios for each study population (thus, 2 3 106 replicates for each population), wherein the site of selection was at the center of the sequence. We drew t2 ½40;2000 and
s2 ½0:005;0:5uniformly at random from a log-scale, and defined BFs as previously. Additionally, we assigned the most probable values ofkfrom the posterior distribution for each top 40 sweep candidate for each population, following the previous protocol. Values oftwere chosen to reflect selective events within the range of detection of G12, G123, and H12, while also being after the out-of-Africa event, whereas values of s represent a range of selection strengths from weak to strong. We once again conditioned on the selected allele remaining in the population throughout the simulation, though not on its frequency beyond this constraint.
Data availability
We affirm that all data necessary for confirming the conclu-sions of the article are present within the article,figures, and tables. Supplemental material available at Figshare:https:// doi.org/10.25386/genetics.7128560.
Results
expectations under neutral demographic scenarios. We com-pared the power of the MLG-based methods G12 and G123 to that of the haplotype-based methods H12 and H123 (Garud
et al.2015), at the 1% FPR obtained from simulations under neutral demographic models (see Materials and Methods). We performed simulations under population-genetic pa-rameters inferred for human data (Takahata et al. 1995; Nachman and Crowell 2000; Payseur and Nachman 2000) with the forward-time simulator SLiM 2 (Haller and Messer 2017). Because SLiM outputs paired phased haplotypes for each diploid individual, we manually merged each individu-al’s haplotypes to apply the MLG-based methods. Our simu-lated replicates included scenarios of selective neutrality, hard sweeps, and soft sweeps. We evaluated methods across simulations of constant demographic history, as well as realistic human models of bottleneck and expansion (Lohmuelleret al.2009) (Figure 2). We then used an ABC approach to evaluate the ability of the MLG-based methods with G2/G1, and the haplotype-based methods with H2/H1, to differentiate between hard and soft sweeps. Finally, we evaluated empirical data from the 1000 Genomes Project (1000 Genomes Project Consortium et al.2015), manually merging each study individual’s phased haplotypes into MLGs to observe the effect of phasing on our ability to detect selective events. See Materials and Methods for a detailed explanation of experiments.
Using G12 and G123 to detect sweeps
We demonstrate the range of sensitivity of G12 and G123 relative to H12 and H123 for selective sweeps occurring at time points between 400 and 4000 generations before the time of sampling. We evaluated G123 to determine whether it is a more direct analog of H12 as we expected, while our application of H123 follows from the work of Garud et al.
(2015), which suggested that H123 yields little difference in power to detect sweeps relative to H12 for given sample and window size parameters. In the following experiments, we simulated 100 kb chromosomes carrying a selected allele at their center (sweep simulations), or carrying no selected allele for neutrality, performing 103replicates for each sce-nario with sample sizen¼100 diploid individuals.
For each series of simulations, we detected sweeps using a sliding window of size 40 kb shifting by 4 kb increments across the chromosome. We selected this window size to ensure that the effect of short-range LD would not inflate the values of our statistics (Figure S1). This additionally matched the window size we selected for analysis of empir-ical data in non-African populations (seeAnalysis of empirical data for signatures of sweeps). According to theoretical expec-tations (Gillespie 2004; Garudet al. 2015; Hermisson and Pennings 2017), a window of size 40 kb under our simulated parameters is sensitive to sweeps with selection strength
s$0:004 (seeMaterials and Methods). Additionally, although we used a nucleotide-delimited window in our analysis, one can alsofix the number of single-nucleotide polymorphisms (SNPs) included in each window (SNP-delimited window),
though this somewhat changes the properties of the methods (seeDiscussion). A SNP-delimited window corresponding to 40 kb for our simulated data contains on average 235 SNPs under neutrality. To supplement experiments measuring the power of each method, we also assessed the genomic distri-bution of G12 and G123 values to characterize their patterns under sweep scenarios.
Tests for detection of hard sweeps
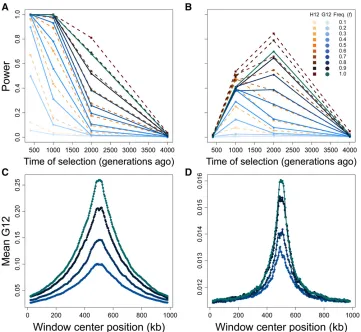
Methods that detect selective sweeps typically focus on the signature of hard sweeps, though many can detect soft sweeps as well. Accordingly, we began by measuring the ability of G12, G123, H12, and H123 to detect both partial and complete hard sweeps, under scenarios in which a single haplotype acquires a selected mutation and rises in frequency. We examined selec-tion start times (t) of 400, 1000, 2000, and 4000 generations before the time of sampling. These values oftspan the time periods of various sweeps in human history (Przeworski 2002; Sabeti et al. 2007; Beleza et al. 2012; Jones et al.
2013; Clementeet al.2014; Fagnyet al.2014). For eacht, we simulated hard sweeps under the aforementioned param-eters to sweep frequencies (f) between 0.1 and 1 for the selected allele (Figure 3 and Figure S2). Sweeps to smaller
fhave a smaller effect on the surrounding expected haplotype homozygosity and are more difficult to detect. We performed hard sweep simulations for a large selection coefficient of
s¼0:1 and a more moderate selection coefficient of
s¼0:01:
The values oftandfboth impact the ability of methods to identify hard sweeps (Figure 3). At the 1% FPR, all methods are suited to the detection of more recent sweeps for simu-lated data, losing considerable power to resolve hard sweep events occurring prior to 2000 generations before sampling, and losing power entirely for hard sweeps occurring prior to 4000 generations before sampling. For selection within 2000 generations of sampling, trends in the power of the MLG-based methods resemble those of the haplotype-based methods, with the power of the MLG-based methods either matching or approaching that of the haplotype-based meth-ods fors¼0:1 (Figure 3A and Figure S2A), and following similar trends in power for s¼0:01 (though with slightly reduced power overall; Figure 3B and Figure S2B), indicating that the two frequency MLGs and the two highest-frequency haplotypes have a similar ability to convey the signature of a sweep.
ablated the longer a sweep lasts. Thus, G12 and H12 are best able to detect sweeps over recent time intervals, especially as the sweep goes to larger values of f. Strong hard sweeps additionally create a peak in signal surrounding the site of selection that increases in magnitude with increasing dura-tion of a sweep. This signal is broad and extends across the 1 Mb interval that we modeled in Figure 3C. These patterns repeat for G123 and H123 (Figure S2A), yielding little dif-ference in power between H12 and H123, and no difdif-ference in power between G123 and G12 (along with a nearly iden-tical spatial signature along the chromosome; Figure S2C).
At a smaller selection coefficient ofs¼0:01 (Figure 3B), G12 and H12 have a distinct range of sweep detection from
s¼0:1:The reduced strength of selection here leads
bene-ficial mutations to rise more slowly in frequency than for stronger selection. Consequently, after 400 generations of selection, the distribution of haplotype (and therefore MLG) frequencies has scarcely changed from neutrality, and G12 and H12 cannot reliably detect the signal of a sweep. However, the powers of G12 and H12, as well as G123 and H123 (Figure S2B), are greatest for a moderate sweep to
f$0:9 starting 2000 generations prior to sampling. As with stronger selection, pooling the three largest frequencies had little effect on power relative to pooling the two largest fre-quencies (Figure S2). We could not detect adaptive muta-tions appearing more anciently than 2000 generamuta-tions before sampling, indicating that all methods lose power to
detect sweeps for smaller values of s, and that haplotype methods may outperform MLG methods for smaller values ofsas well. Furthermore, the range of time over which meth-ods detect a sweep narrows and shifts to more ancient time periods with decreasings. Weaker selection nonetheless pro-duces a signal peak distinct from the neutral background and proportional in magnitude to the value off(Figure 3D and Figure S2D), though the sweep signal for both haplotypes, and therefore MLGs, is reduced for moderate selection (com-pare vertical axes of Figure 3, C and D and of Figure S2, C and D).
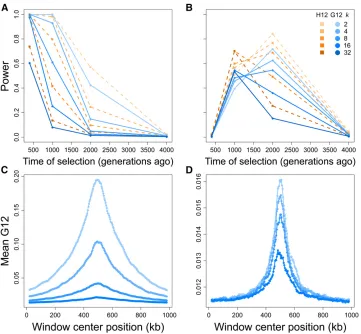
Tests for detection of sweeps on standing variation
We characterized the properties of G12, G123, H12, and H123 for simulated soft sweeps from SSV. We generated results analogous to those for hard sweeps: measures of power for each method, and the chromosome-wide spatial distribution of the G12 and G123 signals. Across identical times of selec-tion (t) and selection coefficients (s) as for hard sweep sim-ulations, we simulated SSV scenarios by introducing the selected mutation on multiple haplotypes simultaneously. We evaluated method ability to correctly distinguish sweeps onk¼2;4, 8, 16, and 32 initially selected different haplo-types from neutrality. One copy of the selected allele is guar-anteed to remain in the population for the entire simulation, but we do not condition on the number of sweeping haplo-types at the time of sampling. Indeed, we do not expect that
for larger values of k, all haplotypes carrying the selected allele will remain at high frequency, or remain at all by the time of sampling (Figure S4). For our scaled (seeMaterials and Methods) simulated population size of 500 diploids (unscaled 104diploids), this corresponds to having the ben-eficial allele present on 0.2–3.2% of haplotypes at the onset of selection. Our results for these tests mirror those for hard sweeps, with stronger selection on fewer distinct haplotypes yielding the most readily detectable genomic signatures (Fig-ure 4 and Fig(Fig-ure S3).
SSV once again produces a signal of elevated MLG identity fors¼0:1 that all methods most readily detect if it is recent, and rapidly lose power to detect astincreases. G12 and H12 reliably detect signals of SSV in simulated 100 kb chromo-somes, retaining power for SSV on as many ask#16 haplo-types within thefirst 400 generations after the start of selection (Figure 4A). However, the relatively smaller expected homo-zygosity under SSV leads the power of each method to decay more rapidly than under a hard sweep. The levels of expected homozygosity produced under SSV are consequently smaller in magnitude than those generated under hard sweeps, but un-ambiguously distinct from neutrality for at least one combina-tion of each testedkandt, withk¼2 most closely resembling a hard sweep throughout (Figure 4C). As with the hard sweep scenario, G123 and H123 yield little change in resolution for detecting strong soft sweeps from SSV, suggesting that pooling additional frequencies may hold little importance in
detect-ing sweeps (Figure S3, A and C). Once again, H123 maintains slightly greater power than does G123.
G12 and H12 perform comparably well for moderate ðs¼0:01Þ sweeps from SSV (Figure 4B). Similarly to hard sweep scenarios for s¼0:01; G12 and H12 detected soft sweeps from SSV occurring between 1000 and 2000 genera-tions before sampling. Once again, the power of H12 was greater than that of G12, with trends in power for G12 fol-lowing those of H12. For both MLG and haplotype data, the inclusion of additional selected haplotypes at the start of selection up tok¼8 only slightly reduced the maximum power of G12 and H12 to detect sweeps, but with time at which maximum power is reached shifting from 2000 gener-ations before sampling fork#8 to 1000 generations before sampling fork$16:Additionally, the spatial signal for mod-erate sweeps was comparable between SSV and hard sweep scenarios (Figure 4D). This result may be because at lower selection strengths, haplotypes harboring adaptive alleles are more likely to be lost by drift, leaving fewer distinct selected haplotypes rising to appreciable frequency. These trends per-sist for G123 and H123, which display similar powers to G12 and H12 across all scenarios (Figure S3, B and D).
Effect of population size changes on detection capabilities of G12 and G123
Changes in population size that occur simultaneously with or after the time of selection may impact the ability of methods
to detect sweeps because haplotypic diversity may decrease under a population bottleneck, or increase under a population expansion (Campbell and Tishkoff 2008). To test the robust-ness of the haplotype- and MLG-based methods to these po-tentially confounding scenarios, we modeled hard sweeps following the human population bottleneck and expansion parameters inferred by Lohmuelleret al.(2009) (Figure 2). We measured the powers of G12, H12, G123, and H123 across our previously tested parameters, using simulated 100 kb chromosomes and sliding windows, and approaching these scenarios in two ways.
First, we applied a 40-kb window as previously to evaluate the effect of population size change on the power of each method. Under a bottleneck, a 40-kb window is expected to carry fewer SNPs than under a constant-size demographic history, whereas an expansion results in greater diversity per window. Second, we examined whether we could increase the robustness of all methods to population size changes by adjusting the window size for each scenario to match the expected number of segregating sites for a 40-kb window under constant demographic history. To do this, we followed the approach outlined in DeGiorgioet al.(2014), increasing window size for bottleneck simulations and decreasing win-dow size for expansion simulations. We employed winwin-dows of size 56,060 nucleotides for bottleneck, and of size 35,048 nucleotides for expansion scenarios (see DeGiorgio et al.
2014).
A recent population bottleneck reduces the powers of all methods to detect sweeps, whereas a recent population expansion enhances power (Figures S5 and S6). This results from the genome-wide reduction in haplotypic diversity under a bottleneck relative to the constant-size demographic history. Thus, the maximum values of both the haplotype-and MLG-based statistics in the absence of a sweep are inflated, resulting in a distribution of maximum values under neutrality that has increased overlap with the distribution under selective sweeps. In contrast, haplotypic diversity is greater under the population expansion than what is expected for the constant-size demographic history, render-ing easier the detection of reduced genetic diversity due to a sweep.
For strong selectionðs¼0:1Þ under a population bottle-neck, all methods using unadjusted windows have reliable power to detect only recent hard sweeps to largefoccurring within 1000 generations of sampling (Figures S5A and S6A). Adjusting window size has little effect on this trend, with powers for sweeps beginning 400 generations before sam-pling increasing only slightly (Figures S5C and S6C). This result indicates that we can apply the haplotype- and MLG-based methods to populations that have experienced a severe bottleneck and make accurate inferences about their selective histories. Similarly, adjusting window size had little effect on the power of all methods to detect a sweep under a population expansion, wherein power is already elevated. As with the bottleneck scenario, reducing the size of a 40-kb window (Figure S5B and S6B) to 35,048 bases (Figure S5D
and S6D) provided a minor increase in power to detect se-lective events occurring within 2000 generations of sam-pling, with high power for larger values of f extending to 2000 generations prior to sampling.
Distinguishing hard and soft sweeps with G2/ G1
Having identified selective sweeps with the statistics G12 or G123, our goal is to make an inference about the number of sweeping haplotypes. To distinguish between hard and soft sweeps, Garudet al.(2015) defined the ratio H2/H1, which is larger under a soft sweep and smaller under a hard sweep. The H2/H1 ratio leverages the observation that haplotypic diversity following a soft sweep is greater than that under a hard sweep. Garud and Rosenberg (2015) showed that the value of H2/H1 is inversely correlated with that of H12, and that identical values of H2/H1 have different interpretations depending on their associated H12 value. Therefore, H2/H1 should only be applied in conjunction with H12 when H12 is large enough to be distinguished from neutrality.
Here, we extend the application of H2/H1 to MLGs. As with the haplotype approach, G2/G1 is larger under a soft sweep and smaller under a hard sweep, because MLG diversity following a soft sweep is greater than under a hard sweep. G2/G1 should therefore distinguish between hard and soft sweeps similarly to H2/H1, conditional on a high G12 or G123 value. To demonstrate the classification ability of the MLG-based methods with respect to the haplotype-MLG-based methods, we began by generating 106 simulated replicates of 40 kb chromosomes with sample size n¼100 diploids for hard sweep and SSV scenarios, treating each chromosome as a single window and recording its G12, G123, and G2/G1 val-ues (seeMaterials and Methods).
We evaluated the ability of G2/G1 with G12 or G123 to distinguish between hard sweeps and soft sweeps from SSV specifically from k¼3 and k¼5 drawn haplotypes, both within the range of method detection (Figure 4 and Figure S3), with all sweeps allowed but not guaranteed to go to
fixation. We examined two values ofk, distinct from one an-other and from hard sweeps, to illustrate the effect of model choice on sweep classification. Each experiment evaluated the likelihood that a soft sweep scenario would produce a partic-ular paired (G12, G2/G1) or (G123, G2/G1) value relative to a hard sweep scenario. We measured this relative likelihood by plotting the BFs for paired (G12, G2/G1) and (G123, G2/G1) test points generated from an ABC approach (seeMaterials and Methods). A BF.1 indicates a greater likelihood of a soft sweep generating the paired values of a test point, and a BF,1 indicates that a hard sweep is more likely to have generated such values. In practice, however, we only assign BF#1=3 as hard and BF$3 as soft to avoid making infer-ences about borderline cases (Figure 5). For each replicate, time of selection (t) and selection strength (s) were drawn uniformly at random on a log-scale fromt2 ½40;2000 gen-erations before sampling ands2 ½0:005;0:5:
for the haplotype-based approaches (Garud et al. (2015), Garud and Rosenberg (2015); Figure 5). In Figure 5, colored in blue are the values most likely to be generated under SSV, and colored in red are the values most likely to be generated under hard sweeps. In all scenarios tested, hard sweeps pro-duce relatively smaller G2/G1 values than do soft sweeps. Intermediate G12 and G123 paired with large values of G2/G1 are more likely to result from soft sweeps than from hard sweeps. SSV cannot generate large values of G12 or G123 because these sweeps are too soft to elevate homozy-gosity levels to the extent observed under hard sweeps. This is particularly so when soft sweeps are simulated withk¼5: Therefore, the majority of test points with extreme values of G12 and G123, regardless of G2/G1, have BF#1=3 (mean-ing only one SSV observation within a Euclidean distance of 0.1 for every three or more hard sweep observations), and this is in line with the results from the constant-size de-mographic model of Garud et al. (2015) for comparisons between hard sweeps and the softest soft sweeps. Addition-ally, we cannot classify sweeps if the values of G12 and G123 are too low, as these values are unlikely to be distinct from neutrality. Thus, our ability to distinguish between hard and soft sweeps is greatest for intermediate values of G12 and G123. In practice, our empirical top sweep candidates all converge over this range of the (G12, G2/G1) and
(G123, G2/G1) values (Figure 6), meaning that we can
con-fidently classify sweeps from outlying values of G12 and G123 in our data as hard or soft.
In Figure S7, we repeat our ABC procedure for the phased haplotype data corresponding to our preceding analyses.
We find that a small proportion of (G12, G2/G1) and
(G123, G2/G1) values for which we lack the ability to distin-guish hard and soft sweeps (gray points), corresponds to (H12, H2/H1) values that do classify sweeps as soft. Addi-tionally, the (H123, H2/H1) values yielded a still larger pro-portion of SSV-classified (blue) values. This result may indicate that the haplotype approaches maintain a some-what greater ability to classify sweeps than do the MLG ap-proaches. Accordingly, the skew toward larger BFs among the (G123, G2/G1) values relative to (G12, G2/G1) may indicate that classification with the former may more closely resemble classification using (H12, H2/H1) values.
To further characterize the classification properties of both the MLG- and haplotype-based approaches, we next employed an alternative ABC approach in which we determined the posterior distribution of k for a range of (G12, G2/G1), (G123, G2/G1), (H12, H2/H1), and (H123, H2/H1) value combinations. For these experiments, we generated 53106 replicates of sweep scenarios with k2 f1;2;. . .;16gdrawn uniformly at random for each replicate, maintaining all other
Figure 5 Assignment of BFs to tested paired values of (G12, G2/G1) and (G123, G2/G1). Plots represent the rela-tive probability of obtaining a paired (G12, G2/G1) or (G123, G2/G1) value within a Euclidean distance of 0.1 from a test point for hardvs.soft sweeps, de-termined as described inMaterials and Methods. Selection coefficients (s) and times (t) were drawn as described in
relevant parameters identical to the BF experiments (see
Materials and Methods). From the posterior distribution ofk
values, we assigned the most probablekfor a wide range of points using both MLG and haplotype data (Figure S8), and generated probability density functions across H12, H2/H1, G123, and G2/G1 for each value ofk(Figure S9). G12, G123, H12, and H123 values were larger for sweeps with smallerk, while G2/G1 and H2/H1 values were smaller for these sweeps, as expected. Thus, our inference of the most proba-ble values of k across test points was concordant with the BF-based results. Also matching the BF experiments, we achieved a finer resolution between sweep classifications from haplotypes than from MLGs, resulting from the greater number of discrete values that exist for the haplotype-based statistics. Because all of the statistics are computed as the sum of squared frequencies in the sample, their values depend on the sample size and the haplotype or MLG frequency spectrum. This property of the MLG iden-tity and expected haplotype homozygosity statistics is ap-parent when comparing the probability density functions for H2/H1 (Figure S9B) and G2/G1 (Figure S9D). The probability density functions of G2/G1 demonstrate that askincreases, particular values of the statistic are rare or impossible in the upper tail of the distribution for sam-ple size n¼100 individuals, contrasting with the distri-butions of the H2/H1 probability density functions ð2n¼200Þ;which have fewer modes. As previously, hard sweepsðk¼1Þoccupied larger values of G12, G123, H12, and H123 and smaller values of G2/G1 and H2/H1, with inferred k (similarly to inferred BF) increasing with in-creasing G2/G1 and H2/H1, regardless of G12, G123, H12, and H123 value. Thus, our alternative ABC ap-proach can assign a most probablekfrom the entire tested range ofk2 f1;2;. . .;16g;allowing for sweep classifi ca-tion without the ambiguity of BFs.
Analysis of empirical data for signatures of sweeps
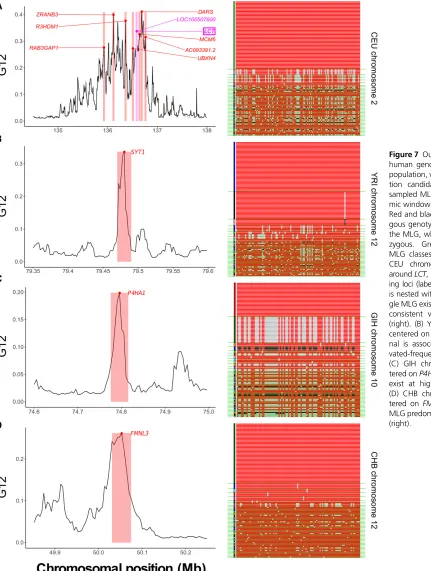
We applied G12, G123, and H12 to whole-genome variant calls on human autosomes from the 1000 Genomes Project (1000 Genomes Project Consortiumet al.2015) to compare the detective properties for each method on empirical data (Figure 7, Figures S11–S18, and Tables S3–S14). This ap-proach allowed us to understand method performance in the absence of confounding factors such as missing data and small sample size. The choice of human data additionally allowed us to validate our results from the wealth of
identi-fied candidates for selective sweeps within human popula-tions worldwide that has emerged from more than a decade of research (e.g., Sabetiet al. 2002; Bersaglieriet al.2004; Voight et al. 2006; Bhatia et al. 2011; Chen et al. 2015; Schrider and Kern 2016; Cheng et al.2017). To apply our MLG-based methods to the empirical dataset, consisting of haplotype data, we manually merged the haplotypes for each study individual to generate MLGs. Thus, all comparisons of G12 and G123 with H12 were for the same data, as in our simulation experiments.
For our analysis of human data, we focused on individuals from European (CEU), African (YRI), South Asian (GIH), and East Asian (CHB) descent. Across all populations, we assigned
P-values and BFs, as well as maximum posterior estimates and Bayesian credible intervals onk, for the top 40 selection candidates (see Materials and Methods). Our Bonferroni-corrected significance threshold (Neyman and Pearson 1928) was 2:1065931026;with critical values for each sta-tistic in each population displayed in Table S1. We defined soft sweeps as those with BF $3 or inferredk$2;and hard sweeps as those with BF #1=3 or inferredk¼1:Following each genome-wide scan, wefiltered our raw results using a mappability and alignability measure (see Materials and Methods), following the approach of Huber et al. (2016). We additionally omitted genomic windows from our analysis with,40 SNPs, the expected number of SNPs in our genomic windows (Watterson 1975) under the assumption that a strong recent sweep has affected all but one of the sampled haplotypes. This is thus a conservative approach. We display thefiltered top 40 outlying sweep candidates for G12, G123, and H12, includingP-values, BFs, and inferredk(with cred-ible interval), in Tables S3–S14. We also overlay the top 40 selection candidates for each population onto (G123, G2/G1) test points (Figure 6 and Figure S10). For all popu-lations, we see that top candidates, regardless of assignment as hard or soft, generate broadly similar G123 values within a narrow band of paired (G123, G2/G1) values. Finally, we indicate the top 10 selection candidates in chromosome-wide Manhattan plots for both G12 and G123 (Figures S11–S18). Expectedly, G12 and G123 plots are nearly identical in their profiles.
We recovered significant signals from the
well-documented region of CEU chromosome 2 harboring the
LCT gene, which confers lactase persistence beyond child-hood (Bersaglieri et al. 2004). Although filtering removed
SLC24A5, another expected top candidate controlling skin
pigmentation, the adjacent SLC12A1 gene remained.
Assigned BFs and inferred values of k suggest that hard sweeps in each of these regions yield the observed signals (Tables S3 and S4). In YRI (Tables S6 and S7), we most notably found the previously identifiedSYT1,HEMGN, and
NNT (Voight et al. 2006; Pickrell et al. 2009; Fagny et al.
2014; Pierronet al.2014).SYT1andHEMGNwere significant for G12, G123, and H12 analyses, with SYT1 yielding the strongest signal by a large margin, whileNNTwas not signif-icant. Of these, we could only confidently classify HEMGN, which we uniformly identified as hard. Though we were more likely to confidently classify candidate sweeps in YRI as hard from their MLG-based BFs, the proportion of top candidates assigned as hard from the posterior distribution ofk remained comparable across data types, and generally greater than the levels we observed in other populations (see
Discussionfor further analysis). The most outlying target of selection in GIH (Tables S9 and S10) for all methods was at
2013), which we also recovered as a top candidate in CEU. We could classify this signal as hard from haplotype data, but we assignedk¼2 from MLGs, despite a BF,1:Finally, our analysis of CHB returned EDAR-adjacent genes among the top sweep candidates, including LIMS1, CCDC138, and
RANBP2 (each below the significance threshold), though not EDAR itself (Tables S12 and S13), and additionally
MIR548AE2 andLONP2, adjacent to the site of a proposed sweep on earwax texture within ABCC11 (Ohashi et al.
2010), which we recovered as another top candidate. In Figure 7, we highlight for each population one example of a sweep candidate, including its G12 signal profile, with the genomic window of maximum value highlighted, and a visual representation of the MLG diversity within that re-gion. For the CEU population, we present LCT ðP,1026Þ; and additionally highlight the nearby outlying candidates, each of which was within the top 10 outlying G12 signals in the population (Figure 7A, left panel). The distribution of MLGs surroundingLCTin the sample showed a single predominant MLG comprising approximately half of individuals, consistent with a hard sweep (Figure 7A, right panel). Accordingly,LCT
yielded a BF0:1;indicating that a hard sweep is tenfold more likely to yield this signal than a soft sweep (fromk¼5), and an inferredk¼1 supports this result. For the YRI pop-ulation, the top selection signal for all analyses was SYT1
ðp¼1026Þ;previously identified by Voightet al. (2006)
(Figure 7B, left panel). Here, one high-frequency and one intermediate-frequency MLG predominated in the popula-tion (Figure 7B, right panel), but we could not confidently assign the signal as hard or soft, with haplotypes suggesting
k¼1 and MLGs suggestingk¼2:This is because one high-frequency haplotype exists in the population, carried by approximately half of individuals, while another haplotype exists in approximately one-quarter of individuals. In GIH, we foundP4HA1as a selection candidate exceeding the signifi -cance threshold for haplotype dataðP¼1026Þ;but not for MLG data. Although we were unable to confidently assign the putative sweep onP4HA1as hard or soft from BFs, we note that two MLGs, as well as two haplotypes, exist at elevated frequency here, and that all methods yielded BF .1 and
k.1;suggesting thatP4HA1is likely the site of a soft sweep, but on fewer thank¼5 haplotypes (Figure 7C, right panel). Finally, our scan in CHB returned the undocumented
FMNL3 gene as a top candidate from the G12 analysis (P¼531026; Figure 7D, left panel). A single high-fre-quency MLG predominated at this site, and this yielded a BF from MLG data of 0.147, and inferredk¼1 from all data, indicating a hard sweep (Figure 7D, right panel).
Through the application of G123 and G2/G1, we have identified and classified a number of interesting sweep can-didates. We further explored the existence of a more gen-eral relationship between top sweep candidates and the
prevalence and length of runs of homozygosity. Previous research has indicated that short-to-intermediate runs of homozygosity spanning tens to hundreds of kilobases are characteristic of recent sweeps (Pemberton et al. 2012; Blantet al.2017), and we sought to examine whether there was a correlation of G123 or sweep softness [using log10ðBFÞ
as proxy] with the proportion of individuals falling in a run of homozygosity of specific length. To this end, we intersected our top candidates lists with the inferred coordinates of short to intermediate runs of homozygosity from Blant et al.
(2017). We found that the proportion of individuals with runs of homozygosity of intermediate length (class 4) is
Figure 7 Outlying G12 signals in human genomic data. For each population, we show a top selec-tion candidate and display its sampled MLGs within the geno-mic window of maximum signal. Red and black sites are homozy-gous genotypes at a SNP within the MLG, while gray are hetero-zygous. Green lines separate MLG classes in the sample. (A) CEU chromosome 2, centered aroundLCT, including other outly-ing loci (labeled).LOC100507600
positively correlated (correlation coefficient = 0.32,P-value = 3:6631025) with G123 (Table S2), likely due to stronger and more recent sweeps generating larger G123. Moreover, the proportion of individuals with runs of homozygosity of intermediate length is negatively correlated (correlation co-efficient = 20.26, P-value = 1:0231023) with log
10ðBFÞ (Table S2), likely due to the narrower genomic signature left behind by soft sweeps relative to hard sweeps. In contrast, we observe no significant correlation for smaller runs of homo-zygosity (classes 2 and 3), which have also been proposed to potentially be affected by selective sweeps (Pembertonet al.
2012; Blantet al.2017).
Discussion
Selective sweeps represent an important outcome of adapta-tion in natural populaadapta-tions, and detecting these signatures is key to understanding the history of adaptation in a population. We have extended the existing statistics H12 and H2/H1 (Garud et al. 2015) from phased haplotypes to unphased MLGs as G12, G123, and G2/G1, and demonstrated that the ability to detect and classify selective sweeps as hard or soft remains. Across simulated selective sweep scenarios cov-ering multiple selection start times and strengths, as well as sweep types and demographic models, we found that both G12 and G123 maintain comparable power to H12. The most immediate implication of these results is that signatures of selective sweeps can be identified and classified in organisms for which genotype data are available, without the need to generate phased haplotypes. Because phasing may be diffi -cult or impossible given the resources available to a study system, while also not being error-free (Browning and Browning 2011; O’Connell et al. 2014; Castelet al. 2016; Laveret al.2016; Zhanget al.2017), the importance of our MLG-based approach is apparent. Although phased haplo-types tend to be the preferable data type for detecting selec-tive sweeps based on ourfindings, we nonetheless observe a high degree of congruence in practice between the lists of selection candidates for human empirical data emerging from analyses on haplotypes and MLGs (Tables S3–S14).
Performance of G12 and G123 for simulated data
G12 and G123, similarly to H12 and H123, are best suited to the detection of recent and strong selective sweeps in which the beneficial allele has risen to appreciable frequency. This is as expected because haplotype (and therefore MLG) diversity decreases under sweeps, which results in a distinct signature from which to infer the sweep. This extended tract of sequence identity within the population erodes over time and returns to neutral levels due to the effects of recombination and muta-tion. The strength of selection and range of time over which the haplotype- and MLG-based methods can detect selection are inversely correlated. Our approach detects weaker selec-tive events only if they started far enough back in time, and has a narrower time interval of detection than do stronger events (compare panels A and B across Figure 3, Figure 4, and
Fig-ures S2 and S3). This is because alleles under weaker selec-tion increase in frequency towardfixation more slowly than those under stronger selection, and so more time is required to generate a detectable signal. In the process, the size of the genomic tract that hitchhikes with the beneficial allele de-creases due to recombination and is smaller than under a hard sweep. Panels C and D from Figure 3, Figure 4, and Figures S2 and S3 motivate this point. Across all simulation scenarios, stronger selection produces on average a wider and larger signature surrounding the site of selection, while weaker sweeps are more difficult to detect and classify. For empirical analyses, this means we are more likely to detect stronger sweeps, as reductions in diversity from strong selec-tion persist for hundreds of generaselec-tions and can leave foot-prints on the order of hundreds of kilobases (Gillespie 2004; Garudet al.2015; Hermisson and Pennings 2017).
Expectedly, the signatures of sweeps, and the power of the haplotype- and MLG-based methods to detect them, vary across selective sweep scenarios, with nearly identical trends in haplotype and MLG data. Strongðs¼0:1Þhard sweeps to high sweep frequency fare easiest to detect, as the single, large tract of sequence identity generated under a strong hard sweep remains distinct from neutrality for the longest time interval relative to other scenarios (Figure 3, A and C and Figure S2, A and C). Nonetheless, power to distinguish soft sweeps is large for the most recent simulated sweeps. Indeed, a soft sweep yields a smaller tract of sequence iden-tity that requires a shorter time to break apart, but for strong selection on up tok¼16 different haplotypic backgrounds (1.6% of the total population), both the MLG and haplotype methods have perfect or near-perfect power (Figure 4A and Figure S3A). While this power rapidly fades for selection within 1000 generations of sampling fork.4;our strong-sweep results illustrate that the selection coefficients, more than the partial sweep frequencyfor the number of initially selected haplotypesk, influences the power of our methods, and that pooling can allow for similar detection of hard and soft sweeps. Our moderate-selectionðs¼0:01Þ results fur-ther highlight this. Once again, we see a distinct concordance in power trends between hard (Figure 3, B and D and Figure S2, B and D) and soft (Figure 4, B and D and Figure S3, B and D) sweeps that depends primarily on the value ofsand sec-ondarily onfork.
Because genomic scans using G12, G123, H12, and H123 are window-based, the choice of window size is an impor-tant determinant of the methods’ sensitivity. As do Garud
et al. (2015), we recommend a choice of window size that minimizes the influence of background LD on window diversity, while maximizing the proportion of sites in the win-dow affected by the sweep. Winwin-dows that are too small may contain extended homozygous tracts not resulting from a sweep, while windows that are too large will contain an ex-cess of neutral diversity leading to a weaker signal, while overlooking weaker selective events (Gillespie 2004; Garud