DOI: 10.1534/genetics.110.121780
Temporal and Spatial Regulation of Gene Expression During Asexual
Development of
Neurospora crassa
Charles J. Greenwald,* Takao Kasuga,
†,1N. Louise Glass,
†Brian D. Shaw,* Daniel J. Ebbole*
and Heather H. Wilkinson*
,2*Department of Plant Pathology and Microbiology, Texas A&M University, College Station, Texas 77843-2132 and†Department of Plant and Microbial Biology, University of California, Berkeley, California 94720-3102
Manuscript received August 3, 2010 Accepted for publication September 18, 2010
ABSTRACT
In this study we profiled spatial and temporal transcriptional changes during asexual sporulation in the filamentous fungusNeurospora crassa. Aerial tissue was separated from the mycelium to allow detection of genes specific to each tissue. We identified 2641 genes that were differentially expressed during development, which represents25% of the predicted genes in the genome of this model fungus. On the basis of the distribution of functional annotations of 1102 of these genes, we identified gene expression patterns that define key physiological events during conidial development. Not surprisingly, genes encoding transcription factors, cell wall remodeling proteins, and proteins involved in signal transduction were differentially regulated during asexual development. Among the genes differentially expressed in aerial tissues the majority were unclassified and tended to be unique to ascomycete genomes. This finding is consistent with the view that these genes evolved for asexual development in the Pezizomycotina. Strains containing deletions of several differentially expressed genes encoding transcription factors exhibited asexual development-associated phenotypes. Gene expression patterns during asexual development suggested that cAMP signaling plays a critical role in the transition from aerial growth to proconidial chain formation. This observation prompted us to characterize a deletion of the gene encoding a high-affinity cAMP phosphodiesterase (NCU00478). NCU00478 was determined to be allelic to aconidiate-2, a previously identified genetic locus controlling conidiation.
I
N the filamentous fungusNeurospora crassa, there are two forms of asexual sporulation: macroconidiation, which produces multinucleate conidia that are 5–10mm in diameter and microconidiation, which produces mononucleate conidia that are 1 mm in diameter. In this study, we assessed expression profiles inN. crassaduring macroconidiation (hereafter conidiation). The sequence of events during asexual development inN. crassa is well documented (Springer and Yanofsky 1989). Briefy, macroconidiophores grow by apical bud-ding from aerial hyphae. In initial budbud-ding growth the septum that forms the junction between cells has a diameter that is nearly as wide as the cell and produces a chain of barrel-shaped cells termed minor constric-tion chains. As the chain continues to grow at the tip, the septum between newly budded cells is of smaller diameter, producing chains of cells that resemble beads
on a string called major constriction chains. Approx-imately 12 hr postinduction, growth ceases and nuclei migrate into the chains. Subsequently, cross-walls are laid down at each conidial junction, they undergo thicken-ing, and starting at 14 hr the cross-walls are cleaved so that conidia (barrel to spherical in shape) can separate as individual spores (Springer and Yanofsky 1989) (Figure 1).
Previous investigations to identify differentially ex-pressed genes include both subtractive hybridiza-tion (Berlin and Yanofsky 1985a) and microarrays (Rerngsamranet al. 2005; Kasugaand Glass2008). Specifically, Berlin and Yanofsky (1985a) identified several conidiation-specific genes, termed ‘‘con’’ genes. Rerngsamranet al.(2005) investigated the conidiation mutant fluffy, using a cDNA microarray with partial coverage of the genome. Kasuga and Glass (2008) tracked gene expression across defined sections from a growing colony that also exhibited asexual development using the same full genome microarray used in this study. No matter what the approach, the con genes remain among the most highly expressed genes in all analyses, including the present study.
Conidiation inN. crassais induced by exposure of the mycelium to an air interface (Berlin and Yanofsky
Supporting information is available online athttp://www.genetics.org/ cgi/content/full/genetics.110.121780/DC1.
Microarray data are available at the Neurospora Functional Genomics Website (experiment ID 64;http://bioinfo.townsend.yale.edu/browse.jsp).
1Present address:USDA–ARS, Department of Plant Pathology, University
of California, Davis, California 95616.
2Corresponding author: Texas A&M University, Department of Plant
Pathology and Microbiology, MS 2132, College Station, TX 77843-2132. E-mail: [email protected]
1985a). The current hypothesis is that exposure of the mycelium to air induces a hyperoxidant state, which leads to the activation of cAMP and MAP kinase signal transduction pathways that trigger formation of aerial hyphae, which grow perpendicular to the substrate mycelium (Aguirre et al. 1989, 2006; Michan et al. 2003). Aerial hyphae are thought to be physiologically different from the vegetative mycelium, and aerial hyphae-specific genes have been identified, which are not expressed in the substrate mycelium or in conidio-phores (Li et al. 2005). Since adenylate cyclase (cr-1, crisp) and protein kinase A (pkac-1) mutants are in-duced for conidiophore development but lack non-conidiogenous aerial hyphae (Rosenberg and Pall 1979; Bannoet al.2005), it is thought that the formation of aerial hyphae is promoted by cAMP signaling. Strains containing mutations in genes encoding Ga subunits (gna-3and to a lesser extentgna-1, guanine nucleotide-a) have a similar phenotype and are known to regulate
cr-1 activity (Rosenberg and Pall 1979; Kays and Borkovich2004; Bannoet al.2005). Likewise, homo-logs of Saccharomyces cerevisiae ras1 (N. crassa smco-7, semicolonial) and ras2 (bd, band) affect vegetative growth rate and conidial development (Garnjobstand Tatum1967; Sargentand Woodward1969) and have been implicated as regulators of conidiation, possibly through effects on cAMP signaling (Hasunuma and Shinohara 1985; Belden et al.2007).N. crassa strains containing a mutation inmak-2(mitogen-activated pro-tein kinase) display a colony and conidiation phenotype similar to cAMP pathway mutants (Liet al.2005). Thus, the activities of these signaling pathways are likely to be regulated during conidiation.
Tissue-specific gene expression has been demon-strated for several genes expressed during conidiation (Berlinand Yanofsky1985a; Springerand Yanofsky 1992; Lee and Ebbole 1998; Bailey-Shrode and Ebbole 2004). However, a global analysis of tissue-specific (aerial hyphae and conidiophoresvs.substrate
mycelium) has not been reported. For example, the role of the substrate mycelium during conidial morphogen-esis is poorly understood. One possibility is that the substrate mycelium is metabolically inactive and is simply digested to provide material for aerial development. Alternatively, it is possible that the mycelial mat remains viable and contributes metabolic products required for aerial hyphae formation.
In this study, we used 70-mer oligonucleotide micro-arrays to examine N. crassa gene expression during synchronous development of conidia across nine time points. A unique aspect of this study was the separate profiling of aerial and mycelial tissue. Thus, we exam-ined tissue specificity as well as temporal control of gene expression during development. Gene expression dif-ferences were most striking at the time in development when major constriction chains were beginning to mature.
MATERIALS AND METHODS
Time course:N. crassacultures at discrete stages during the development of conidia were prepared as previously described (Berlin and Yanofsky 1985b). Briefly, an 8-liter carboy containing 4 liters of Vogel’s medium (2% sucrose) was inoculated with conidia to make a suspension with a final concentration of 106conidia/ml. Filter sterilized air was vig-orously bubbled through the suspension to ensure aeration and agitation for 20 hr at room temperature, resulting in a logarithmic phase suspension of mycelial growth.
Subsequently, 200 ml aliquots of the mycelial culture were harvested by vacuum filtration onto 9-cm Whatman no. 1 filter paper discs. One sample, time point ‘‘0,’’ was immediately frozen in liquid nitrogen. The remaining 18 mycelial mats on Whatman paper discs were placed onto the surface of 40 ml of Vogel’s agar (2.0% sucrose, 0.75% agar) in 9-cm glass Petri plates. Plates were numbered and placed in randomized positions under constant fluorescent light in a biosafety cabinet with a lowered glass sash and no airflow.
easily separated from the more firmly adhered substrate mycelium by peeling the surface with a razor blade (Toledo et al.1986). This was done to generate a ‘‘top’’ and ‘‘bottom’’ sample for the 12-hr time point (12T and 12B), and top samples for 14- and 18-hr time points (14T and 18T) for RNA isolation. For these 4 time points, each tissue type (aerial and mycelial) was flash frozen and stored separately. Simultaneous to the harvesting of tissue, microscopic analysis was performed using designated parallel cultures to assess the developmental stage at each time point. On the basis of the morphological characteristics monitored, 9 of the 14 time points were selected for microarray analysis. Both the aerial and mycelial tissues of 1 time point (12 hr) were used in our analysis, and only the aerial tissue was used for 14 and 18 hr.
Transcriptional profiling:Each tissue sample was ground in a mortar and pestle with liquid nitrogen, generating a fine powder. RNA was isolated using TRIzol reagent (Invitrogen) following the manufacturer’s protocol. The RNA was purified using an RNAeasy kit (Qiagen) following the manufacturer’s protocol.
Synthesis of cDNA, labeling, hybridization, and image ac-quisition were performed as described in Dunlapet al.(2007). For cDNA synthesis and labeling, the ChipShot indirect labeling and clean-up system (Promega) was used. Briefly, 10
mg of total RNA was used for cDNA synthesis using the oligo(dT) primer according to the manufacturer’s suggested protocol. The cDNA was purified using a ChipShot membrane column. The Cy3 or Cy5 cyanine dyes were incorporated into cDNA by adding Cy3 or Cy5 mono-n-hydroxysuccinimide ester dye (Amersham) to the cDNA solution for 1 hr at 25°. The cDNA was then cleaned using a ChipShot membrane column, vacuum dried, and subsequently used for hybridization.
Experimental design and statistical analysis: A ‘‘cross circuit’’ design was used to compare samples across different time points (Figure 2). Cross circuit designs increase the robustness of comparisons on spotted microarrays (Townsend 2003). Hybridized spots with one or more mean fluorescence intensities of Cy3 or Cy5, that were higher than mean back-ground intensity plus three standard deviations and with.2% of the pixels saturated, were used for further analysis (Yangand Speed 2002). Bayesian analysis of gene expression levels (BAGEL) software was used to generate an expression profile and confidence intervals for each gene (Meiklejohn and Townsend 2005). We recognized that during asexual de-velopment, certain genes might be expressed at low levels at the early or late time points. Since there might be missing hybridizations associated with these genes, we reasoned that these data could be excluded during analysis of the entire circuit. To recover additional information about these genes whose expression was not detected in all samples, we con-ducted separate circuit analyses of the ‘‘early’’ and ‘‘late’’ subsets of the data using BAGEL (Figure 2, striped and dappled areas, respectively). Following BAGEL analysis, we classified genes as ‘‘significantly’’ regulated if they contained nonoverlapping 95% confidence intervals. These genes were then used for subsequent analyses.
Gene accession numbers were annotated according to version 7 of theN. crassagenome assembly (http://www.broadinstitute.
org/annotation/genome/neurospora/). Genes showing
signifi-cantly different relative expression levels were classified accord-ing to their major annotation in the MIPS Functional Catalogue (FUNCAT; FUNCAT annotations obtained fromN. crassa Func-tional Genomics Databasehttp://www.yale.edu/townsend; gene list updated March 2006) (Ruepp et al. 2004). To determine whether there were differences in the functional categories in each cluster, the distribution within each cluster was compared to the total distribution of all the annotated genes using inde-pendentx2tests. We used JMP 8.01 for cluster analysis
(hierar-chical, Ward’s minimum variance method) and to produce the heat map. In graphs, relative expression levels are ratios of a given time point relative to the zero time point for that gene. Where indicated, these data have been log2 transformed.
In tables, data are expression levels relative to the time point with the lowest expression for that gene. Microarray data are available at the Neurospora Functional Genomics Web-site (experiment ID 64; http://bioinfo.townsend.yale.edu/ browse.jsp).
Analysis of NCU00478 andacon-2loci:A cross between the temperature-sensitive acon-2mutant [Fungal Genetics Stock Center (FGSC) 3262] and the NCU00478 deletion strain (FGSC 11431) was performed on synthetic cross-medium (Davis and De Serres 1970). FGSC 11431 served as the female parent with theacon-2 mutant overlaid as the male. Progeny were grown for 6 days at 34°in constant light and scored for conidiation phenotype.
Sequencing of the NCU00478.4 locus in theacon-2strain (FGSC 3262) was performed at the Gene Technologies Laboratory (GTL) at Texas A&M University. Briefly, the coding region for the NCU00478.4 locus ofacon-2was amplified using primers ACON2for2 and NCU00477Rev from the acon-2 strain (supporting information,Table S1) using Phusion Flash DNA polymerase (New England Biolabs, Ipswich, MA). The PCR product was inserted into pCR8 TOPO vector using the manufacturer’s protocol (Invitrogen, Carlsbad, CA) and trans-formed into chemically competentEscherichia coli.The result-ing transformants were screened for the presence of the insert viaEcoRI digestion. The vector and insert DNA was purified using a QiaPrep Spin miniprep kit (Qiagen, no. 27104). Similarly, the NCU00478.4 locus of N. crassa was amplified from wild-type N. crassa using primers ACON2for1 and ACON2rev1 and cloned into pCR8 TOPO. The 3791-bp EcoRI-digested fragment was gel purified and ligated into vector pCB1004 (Carrollet al.1994) to produce pCG2. In both cases, the inserts were sequenced using the primers listed inTable S1.
days at 25° in constant light. The resulting conidia were harvested with 50 ml sterile 1msorbitol and filtered through sterile miracloth (Calbiochem, 475855). The conidia were quantified using a hemocytometer and suspended at 83108 conidia/ml in 1msorbitol. Lysing enzyme (Sigma L-1412) was added at a concentration of 20 mg/ml and the solution was allowed to incubate for 1 hr at 28°with shaking at 200 rpm. All subsequent manipulations of these partially digested conidia were performed on ice with solutions also maintained on ice. The conidial suspension was centrifuged for 5 min at 5003g and 4°. The conidia were washed twice using 1msorbitol and resuspended to a concentration of 108 conidia/ml in 1 m electroporation buffer (1msorbitol, 1% PEG 4000). A 400-ml aliquot of conidia in electroporation buffer was mixed with 2 mg pCG2. This mixture was transferred to a prechilled electroporation cuvette (0.2-cm gap, Bio-Rad, 165-2086). Electroporation was performed using three pulses in rapid succession (1 sec) (750 V, 600 ohms, 25mF). The cuvette was incubated on ice for 10 min. Outgrowth medium (13Vogel’s salts, 1msorbitol, 2% sorbose, 2% sucrose) was added to the reaction and incubated at 30°for 1 hr. A total of 50 ml of top agar (outgrowth media with 0.7% SeaPlaque LMP agarose; Lonza, 50101) maintained at 40°was mixed with the electro-poration reaction and overlaid on FGS bottom agar (Davis and DeSerres1970) containing 250mg/mL hygromycin B (Calbiochem, 400052). The resulting transformants were screened for presence or absence of conidia after growth at 34°
for 3–5 days. Homokaryons of the conidiating cultures were generated by three rounds of streaking for single colonies on FGS plates (Ebboleand Sachs1990).
RESULTS AND DISCUSSION
Developmental time course analysis of well-characterized conidiation-specific genes:The develop-ment of conidiophores and conidia from mycelial tissue proceeded as observed in previous studies (Springer 1993). At 2-hr postinduction aerial hyphae emerged from the substrate mycelium and by 6 hr a uniform layer was observed. Rare minor constrictions were visible at 4 hr and common from 6 to 10 hr of development. Major constriction chains were first observed at 10 hr and uniformly distributed by 12 hr. Free conidia were observed starting at 14 hr (Figure 1).
Of the 9348 features on the microarray representing predicted protein coding genes in N. crassa, 5393 yielded mRNA profiles with the statistical support necessary for the inference of relative expression levels by BAGEL. In the initial comparison of all 10 samples, 2263 genes were developmentally regulated, exhibiting significant differences (nonoverlapping confidence in-tervals) across time points or tissue types. For some genes, data were only available for early time points (0–8 hr) or late time points (12–24 hr). Analysis of subsets of data for the early and late time points identified an addi-tional 378 genes with nonoverlapping confidence inter-vals within these time points. This 2641-gene total is 25% of the predicted genes in theN. crassagenome exhibiting developmental regulation.
The expression of previously characterized conidiation-specific genes (Figure 3) was consistent with established patterns (Berlin and Yanofsky 1985a). Expression of
con-3 was induced at 8 hr, consistent with previous Northern blot data showing weak induction as early as 2 hr with increasing expression peaking at 8 and 12 hr. In our microarray analysis, the induction ofcon-3 occurred at 8 hr and reached a maximum at 10 and 12 hr. Thecon-6
gene is typically induced at 8–10 hr, slightly earlier than
con-10and con-8 (Berlinand Yanofsky1985a). In our time course,con-6did not pass filtering prior to the 12-hr time point, likely due to a lack of detectable expression in the early time points. Similarly, mRNA from fl, a tran-scription factor required for conidiation (Bailey and Ebbole1998), was only reliably detected at the 12-hr and later time points (Figure 3). On the basis of the data available for many of the known conidiation genes, our experiment represents a typical developmental time course of conidiation.
Classification of gene expression patterns:A cluster analysis was performed on the 2263 differentially ex-pressed genes whose expression was detected at all time points (Figure S1). From these data, we observed differential gene expression for many genes in the 12-hr top (12T) and 12-hr bottom (12B) samples within the major clusters. These observations prompted us to reanalyze the full data set by dividing the genes into three subgroups: genes with lower relative expression levels in 12B compared to 12T (12B,12T;N¼1086), genes with greater relative expression at 12B vs. 12T (12B. 12T;N¼548), and genes with similar relative expression levels at 12B and 12T (12Bffi12T;N¼629); cluster analysis was then performed on each group independently (Figure 4A). For example, in the 12B, 12T group (Figure 4A, left), genes in the 12B sample displayed an expression pattern most similar to the 2-and 4-hr time points. In contrast, the pattern of gene expression in the 12T sample was most similar to the 14T, 18T, and 24-hr samples. The 8-hr sample and the 10-hr sample had a hybrid pattern (similar to what one might expect for a combined 12B and 12T sample) of gene expression, with 8 hr more similar to 12B and 10 hr more similar to 12T. Thus, in the 12B,12T gene set, the greater the mass of aerial tissue relative to mycelial mass the more the expression pattern resembles the patterns exhibited by isolated aerial hyphae.
genes are needed for vegetative growth upon conidial germination. For example, genes involved in glycolysis and ribosomal biogenesis are in this gene set (see below). The 12Bffi12T genes (Figure 4A, right) are differentially expressed during conidiation but do not show tissue specificity (aerial hyphaevs.mycelial mat) at the 12-hr time point. The gene lists corresponding to each of the gene sets in Figure 4A are indicated inFile S1.
Of the 2263 significantly regulated genes, 1102 had a FUNCAT annotation other than ‘‘unclassified proteins’’ or ‘‘classification not yet clear-cut.’’ Figure 4B shows the distributions of classified FUNCAT annotations for the total gene set and each of the 12B relative to 12T gene sets defined in Figure 4A. We used independent x2 analyses to compare the distribution of annotations in each group to the distribution of annotations in the total. In all cases, the groups were significantly different from the entire group of FUNCAT annotated genes (P,0.05). The 12B,12T gene set had 415 genes with classified FUNCAT annotations. This group was rela-tively reduced for ‘‘protein synthesis’’ and ‘‘energy’’ and elevated for genes involved in ‘‘transcription.’’ It is interesting to note that the majority of the genes in the 12B , 12T set is composed of genes for unclassified proteins (566 of the 986 annotated for FUNCAT). Homologs of the majority of genes for unclassified proteins in the N. crassa genome can be found only within the subphylum Pezizomycotina (filamentous ascomycetes) (Kasugaet al.2009) and thus are hypoth-esized to have functions characteristic to the phylum, such as conidiogenesis (Kasuga and Glass 2008). Specifically, among the 566 unclassified genes differen-tially expressed in aerial hyphae in this study, 45.9%
are Pezizomycotina specific and 34.4% are N. crassa
specific (File S1). The 12B.12T gene set had 375 genes with classified FUNCAT annotation. In contrast, this set was relatively enriched for genes in protein synthesis and energy and reduced for transcription. The 12Bffi 12T gene set has 318 genes with classified FUNCAT annotations. In this set protein synthesis was reduced and energy was elevated. Genes classified as having metabolic functions are found evenly distributed across the three groups. To further elucidate the processes occurring in the aerial and mycelial tissue, we queried genes and gene networks with biological functions rel-evant to conidiation (Figure 5; see below).
Carbon metabolism: Previous studies suggested a potential relationship between physiological status with respect to carbon and the induction of asexual de-velopment in N. crassa. Nutrient conditions that pro-mote glycolysis (liquid media with high glucose plus ammonia) repress conidiation, whereas, conditions that promote gluconeogenesis (liquid media with low glu-cose plus nitrate) are inductive (Turianand Bianchi 1972). Clearly nutrient status, in and of itself, influences induction of development. Thus, to tease apart the different factors contributing to induction of develop-ment in our experidevelop-ment, we were interested in examining transcriptional profiles of genes for carbon metabolism. The median expression ratios of genes involved in glycolysis (Figure 5, glycolysis) remained relatively constant in samples up to 10 hr. At the 12-hr time point, the mycelial mat (12B) resembles the earlier time points, whereas, the aerial hyphae (12T) displayed reduced expression of these genes. The 12-hr time point appears to have captured a critical point in
development, since recovery of a mycelial-like expres-sion pattern for these genes was apparent in the 14- and 18-hr aerial hyphae. Both the gene for PEP carboxyki-nase (NCU09873), a rate-limiting step in gluconeogen-esis, and 3-ketoacyl-CoA thiolase (NCU04796), a key enzyme in fatty acid degradation (Figure 5, gluconeo-genesis and lipid metabolism), showed elevated expres-sion levels in the aerial tissue relative to the mycelial mat. The increase in expression for these genes began at 4–8 hr and reached a maximum at10–12 hr. These data suggest that fatty acid degradation in aerial tissue may supply substrates for gluconeogenesis. The reduc-tion in glycolytic gene expression exhibited in 12T, combined with elevated expression of genes for gluco-neogenesis, resembles the response of N. crassa to glucose starvation (Xie et al. 2004). Therefore, it appears that aerial tissue is limited for glucose. This starvation condition may serve as a signal for asexual morphogenesis; alternatively, signaling pathways associ-ated with the developmental program may induce this pattern of carbon metabolism gene expression.
Surprisingly, the transcription pattern in the mycelial mat suggests that glycolysis (pyruvate kinase) and gluconeogenesis (PEP carboxykinase) were both active.
This indicates tissue specificity within the mycelial mat to avoid the futile cycle of PEP synthesis by PEP carbox-ykinase and PEP degradation by pyruvate kinase. This suggestion is consistent with the finding of subspecial-ization of the layers of mycelial mat (Toledoet al.1986). The hyphae of the upper layer of the mycelium are adhered to one another and give rise to aerial hyphae. The hyphae within the lower layer are not adhered to one another. In addition, enzymes for nitrogen metab-olism were found to be differentially present in upper and lower layers (see below).
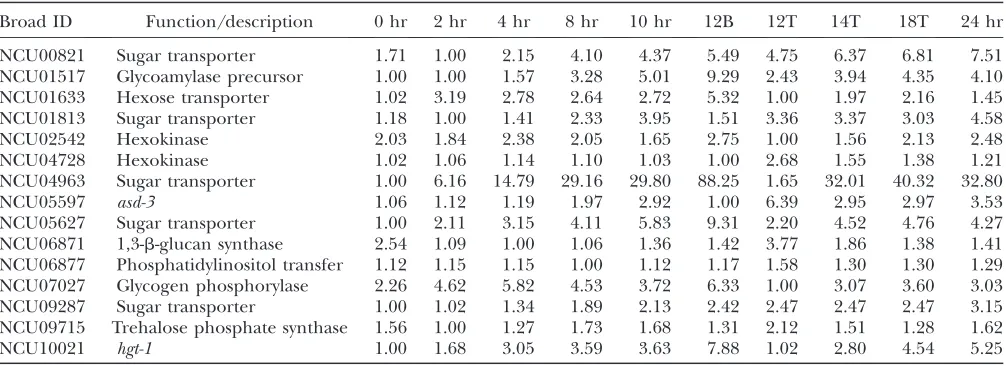
Genes involved in breakdown of starch (NCU01517, NCU07027, and NCU06877) were expressed more highly in the substrate mycelium, whereas genes for 1,3-b-glucan (NCU06871) and trehalose-6-P synthesis (NCU09715) were more abundantly expressed in aerial tissue at 12 hr (Table 1). Furthermore, two hexokinase homologs are expressed. NCU02542, was expressed at a relatively constant level across time and in different tissues, whereas, NCU04728 showed elevated expres-sion levels in the 12-hr aerial hyphae (Table 1), and its role in development is unclear. NCU02542 is likely involved in phosphorylation of glucose produced from the breakdown of glycogen. Taken together, we propose
Figure4.—Expression profiles for significantly regulated genes and corresponding classified FUNCAT category distributions. The number of genes in each cat-egory (N) is indicated. (A) The 2263 genes identified as signifi-cantly regulated, on the basis of nonoverlapping 95% confidence intervals in a BAGEL analysis. Genes were grouped according to their tissue-specific relative ex-pression at 12 hr. Heat maps rep-resenting cluster analyses are shown for each 12Bvs. 12T cate-gory. The expression values are relative to 0 hr and log2
trans-formed. Thus, all data represent either an increase or decrease of gene expression relative to 0 hr for that gene. (B) Distribution of 1102 genes on the basis of their major FUNCAT annotation (not including categories ‘‘un-classified proteins’’ or ‘‘classifica-tion not yet clear-cut’’). The bar labeled ‘‘total’’ shows the distribu-tion of all 1102 BAGEL significant genes with FUNCAT annotations. The 12B vs. 12T bars (12B ,
that sugar is being mobilized in the mycelium and consumed for cell wall synthesis and carbohydrate storage in the aerial hyphae.
Several sugar transporter homologs were regulated during development (Table 1). Transcripts for the low-affinity glucose transporter homolog (NCU01633) (Formentet al.2006) and two other sugar transporter homologs NCU00821 and NCU09287 were elevated in
both the mycelium and the aerial tissue at 12 hr. Expression of the high-affinity glucose transporter, NCU10021, and one other sugar transporter homolog (NCU04963) was elevated in the mycelium at 12 hr relative to time 0; however, expression did not increase in the aerial tissue. Transcripts for sugar transporter homologs NCU05627, NCU01813, and NCU05597 were elevated in the aerial tissue but not in the substrate
Figure5.—Expression levels of genes for metabolism and cell fate.Y-axis represents expression levels (log
2) relative to time 0 h.
mycelium at 12 hr. The role of the induced sugar transporter genes and the NCU04728 hexokinase gene in aerial hyphae is unclear since we expect glucose and other sugars to be transported intracellularly, or synthe-sized via gluconeogenesis. Clearly, aerial hyphae extend beyond the substrate and thus are not exposed to extracellular glucose. Thus, aerial hyphae may either experience derepression of glucose repressed genes, such as sugar transporters, or another possible inter-pretation is that these transcripts were produced to prepare the nascent conidia for sugar uptake upon germination.
Nitrogen metabolism:Nitrogen starvation is a strong inducer of conidiation (Plesofsky-Vig et al. 1983), thus, genes for nitrogen metabolism may also be regu-lated during development. Ca´ rdenasand Hansberg (1984) suggested that glutamine is the main compound used to transfer nitrogen from the mycelial mat to the aerial tissues. Furthermore, glutamine synthetase ac-tivity and protein levels have been measured in the mycelial mat and aerial hyphae during a time course of development similar to ours (Ca´ rdenasand Hansberg 1984) allowing us to compare mRNA and protein levels.
N. crassais known to possess two glutamine synthetase polypeptides that are encoded by different genes (Lara
et al.1982). NCU06724 isgln-1(glutamine-1), encoding theb-glutamine synthetase polypeptide that forms an octameric enzyme required for growth in the absence of glutamine. NCU04856 encodes a close paralog togln-1
(81% identical at the amino acid level) and thus likely is
gln-2, encoding thea-glutamine synthetase polypeptide. The purifieda-glutamine synthetase polypeptide forms a homotetramer with lower activity than the homoocta-mericb-glutamine synthetase. When both proteins are present they form a heteromeric enzyme and the overall activity of the enzyme is thought to be determined by the ratio of the polypeptides (Ca´ rdenas and Hansberg
1984; Aguirre and Hansberg 1986). Under general conditions of nitrogen deficiency mRNA and protein levels of theb-glutamine synthetase are low, whereas the levels for thea-glutamine synthetase are high.
The expression level of gln-1(NCU06724) declined 2.4-fold at 2 hr (Table 2) and remained relatively constant after that time in all tissues. Glutamine synthetase activity was found to decline 8-fold in the upper layer of the mycelial mat, but increase 2-fold in the lower layer over the 12-hr time course (Ca´ rdenas and Hansberg1984). In our case, the 2.4-fold decrease in transcript is consistent with combined changes in enzyme activity in the two layers. In 12-hr aerial hyphae, glutamine synthetase activity was half of the level of the preharvested culture. The transcript level for NCU04856 was similar in the mycelium during the 12-hr time course, but showed a 14-fold reduction in expression level specifically in the 12-hr aerial hyphae. This is consistent with the finding that the relative proportion of a-polypeptide was lower in the aerial hyphae than in the mycelial mat (Ca´ rdenas and Hansberg 1984). Thus, the relative amount and ratio of a- and b-polypeptide appears to parallel their transcript levels. Furthermore, the near absence of NCU04856 (a-polypeptide) transcript suggests that nitrogen levels in aerial hyphae may be sufficiently high to repress transcription of NCU04856. Thus, although we concluded that carbon source was limiting in aerial hyphae on the basis of the observed induction of gluconeogenesis, we conclude that nitrogen transport into the aerial tissue is sufficient to repress nitrogen-regulated genes.
Ribosome biogenesis, proteasome components, and autophagy: During conidiation, a decline in ribosomal protein synthesis has been observed for Aspergillus fumigatus (Twumasi-Boateng et al. 2009). In our analysis, transcripts expressed at a higher level in the
TABLE 1
Relative gene expression of carbohydrate metabolism and sugar transporter genes
Broad ID Function/description 0 hr 2 hr 4 hr 8 hr 10 hr 12B 12T 14T 18T 24 hr
NCU00821 Sugar transporter 1.71 1.00 2.15 4.10 4.37 5.49 4.75 6.37 6.81 7.51
NCU01517 Glycoamylase precursor 1.00 1.00 1.57 3.28 5.01 9.29 2.43 3.94 4.35 4.10
NCU01633 Hexose transporter 1.02 3.19 2.78 2.64 2.72 5.32 1.00 1.97 2.16 1.45
NCU01813 Sugar transporter 1.18 1.00 1.41 2.33 3.95 1.51 3.36 3.37 3.03 4.58
NCU02542 Hexokinase 2.03 1.84 2.38 2.05 1.65 2.75 1.00 1.56 2.13 2.48
NCU04728 Hexokinase 1.02 1.06 1.14 1.10 1.03 1.00 2.68 1.55 1.38 1.21
NCU04963 Sugar transporter 1.00 6.16 14.79 29.16 29.80 88.25 1.65 32.01 40.32 32.80
NCU05597 asd-3 1.06 1.12 1.19 1.97 2.92 1.00 6.39 2.95 2.97 3.53
NCU05627 Sugar transporter 1.00 2.11 3.15 4.11 5.83 9.31 2.20 4.52 4.76 4.27
NCU06871 1,3-b-glucan synthase 2.54 1.09 1.00 1.06 1.36 1.42 3.77 1.86 1.38 1.41
NCU06877 Phosphatidylinositol transfer 1.12 1.15 1.15 1.00 1.12 1.17 1.58 1.30 1.30 1.29
NCU07027 Glycogen phosphorylase 2.26 4.62 5.82 4.53 3.72 6.33 1.00 3.07 3.60 3.03
NCU09287 Sugar transporter 1.00 1.02 1.34 1.89 2.13 2.42 2.47 2.47 2.47 3.15
NCU09715 Trehalose phosphate synthase 1.56 1.00 1.27 1.73 1.68 1.31 2.12 1.51 1.28 1.62
mycelium vs. the aerial hyphae at 12 hr (Figure 4A, middle) were enriched for genes encoding ribosome components. These data are consistent with the hypoth-esis that the mycelium is active during morphogenhypoth-esis and provides needed substrates for aerial hyphae formation. It is important to note that the ribosomal protein synthesis genes were downregulated in the aerial tissue at 12 hr. Transcription of ribosomal protein genes declines during carbon starvation in fungi (Klein and Struhl 1994; Yin et al. 2003). This is consistent with our findings for carbon metabolism genes discus-sed above, suggesting that aerial hyphae ofN. crassaare subject to carbon starvation. A decline in ribosomal protein synthesis during carbon- or nitrogen starvation-induced conidiation is known forA. fumigatus(Twumasi -Boatenget al.2009). Interestingly, the key regulator of conidiation in A. fumigatus, brlA, is required for the reduction in ribosomal protein synthesis under nitrogen starvation but not carbon starvation. Thus, in these two fungi there seems to be a complex interplay of de-velopment and physiology.
In eukaryotes, the proteasome is important in the recycling of proteins (Couxet al.1996). One model for development is that protein recycling occurs in the mycelial mat and that protein turnover provides sub-strates for transport into aerial hyphae to support growth. However, we did not observe an induction of genes for proteasome synthesis in the mycelium; rather, expression levels for some proteasome components were higher in the aerial tissue (Figure 5, proteasome components). Also, we did not find evidence for in-duction of genes involved in autophagy in the mycelium (Figure 5, autophagy genes). While we recognize that transcript levels may not reflect the activity of the proteasome or autophagy processes, Toledo et al. (1986) observed that the hyphae in both the upper and lower layers of the mycelial mat maintained viability over the time course of development.
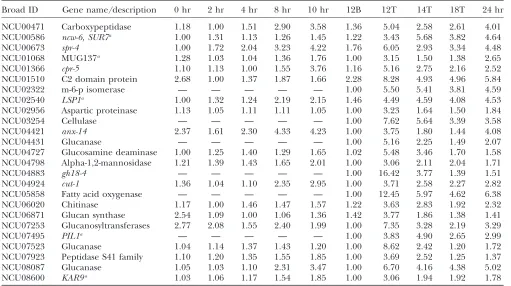
Cell wall synthesis and membrane modification: As expected for growing aerial hyphae and developing conidiophores, the expression of glucan synthase (NCU06871) along with several glucanases, glucosi-dases, glucanosyltransferases, chitinases, and proteases were elevated in aerial tissue (Table 3). These genes are likely involved in direct synthesis and modification of cell wall and polysaccharides.
Similarly the expression level ofcut-1(NCU04924) was induced in aerial tissue. The cut-1 gene encodes a
member of the haloacid dehalogenase family and re-sembles members of the NagD subfamily (COG0647) of sugar phosphatases. It is induced by osmotic stress or heat shock (Youssar et al. 2005). The N. crassa cut-1 mutant is osmotically sensitive, has altered aerial hyphae development, and does not properly release conidia (Youssar et al. 2005). We hypothesize that cut-1 is involved in membrane structure or cell wall biosynthesis, since many members of this gene family are involved in phosphatidyl or carbohydrate metabolism.
Several orthologs to yeast genes involved in mor-phogenesis were regulated during N. crassa asexual sporulation (Table 3). In yeast, Sur7p, Lsp1p and Pil1p physically interact with each other at the bud tip to regulate cellular morphogenesis ( Young et al. 2002; Zhanget al.2004; Waltheret al.2006). The orthologs to yeast SUR7 (NCU00586), LSP1 (NCU02540), and
PIL1 (NCU07495) showed increased expression levels in the aerial hyphae tissue. NCU00586 is a member of the Sur7p/Pal1p family, which is involved in signal transduction with roles in pH sensing, endocytosis, sporulation, and plasma membrane organization. NCU08600 has sequence similarity to the yeast KAR9
gene and is coregulated with the Sur7p/Pal1p homolog NCU00586. This finding is interesting because in S. cerevisiae, Kar9p is required for karyogamy, positioning of the mitotic spindle, and organization of cytoplasmic microtubules. Kar9p has been shown to localize to the tip of the shmoo projection, the cortical dot in mitotic cells, and to the tip of growing buds (Millerand Rose 1998). In conidiation, nuclei migrate into proconida chains prior to septation (Springer and Yanofsky 1989). Thus we hypothesize these orthologs to yeast morphogenesis genes are essential to conidia forma-tion. A gene encoding a BAR domain containing pro-tein NCU01068 also showed increased expression levels in aerial tissue. BAR domains are found in protein families that are membrane binding and are involved in membrane curvature sensing (Peter et al. 2004). NCU01068 is most similar to S. pombe meiotically upregulated gene 137 protein (Mug137). Mug137 contains a predicted N-terminal BAR domain and a C-terminal SH3 domain, similar to endophilins. A further connection to the cytoskeleton was found in the in-duction of NCU04421, an annexin (anx-14). Annexins are a family of calcium-dependent phospholipid-binding proteins. The annexin family has been linked with many intracellular and extracellular activities
TABLE 2
Relative gene expression of glutamine synthetases
Broad ID Gene name/description 0 hr 2 hr 4 hr 8 hr 10 hr 12B 12T 14T 18T 24 hr
NCU04856 gln-2 15.28 12.59 9.38 9.27 8.28 14.28 1.00 9.32 9.48 6.99
including membrane scaffolding, organization and trafficking of vesicles, endocytosis, exocytosis, signal transduction, inhibition of phospholipase activity, re-sistance to oxygen species, DNA replication, and cal-cium ion channel formation (Vishwanatha and Kumble 1993; Mira et al.1997; Gerkeet al. 2005). In addition, NCU01510, a gene encoding a protein that contains C2 domains was induced. C2 domains are Ca21
-dependent membrane targeting modules that bind to a wide variety of substances including phopho-lipids, inositol polyphosphates, and intracellular pro-teins (Davletovand Su¨ dhof1993). Since NCU01510 contains two C2 domains, it is likely to function as a membrane trafficking protein, similar to the role of the calcium sensor synaptotagmin 1, which controls exo-cytosis (Tanget al.2006). Overall, there was a striking tissue-specific induction of genes involved in cell wall and membrane modification and signaling.
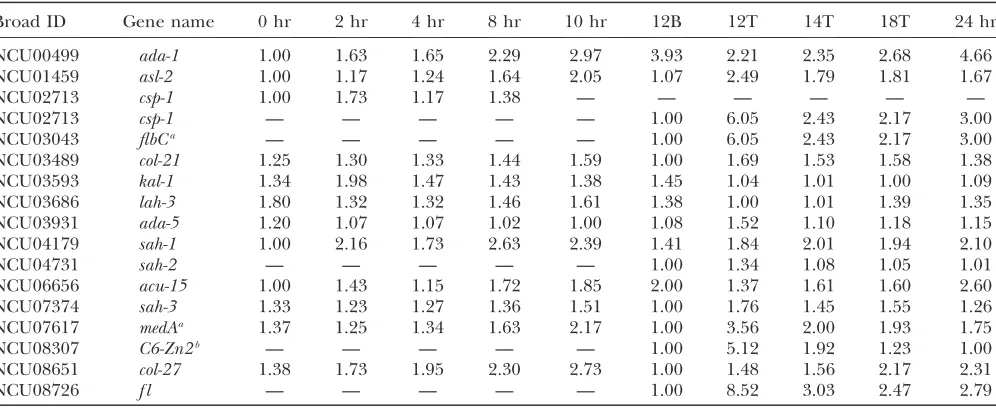
Signal transduction: Many, but not all, of the genes encoding transcription factors of N. crassa have been deleted (Colot et al. 2006). Of the regulated genes encoding transcription factors with phenotypic charac-terizations, eight exhibited asexual development-specific phenotypes, two exhibited sexual development pheno-types, two exhibited colony growth phenopheno-types, one exhibited colony growth and asexual phenotypes, one exhibited asexual and sexual phenotypes, and three
exhibited all development-altered phenotypes (Colot
et al. 2006) (Table 4). Many of the genes encoding transcription factors were only moderately regulated, indicating that either a small change in expression is sufficient, or post-translational modifications of these factors may also be important for their activity. Of these characterized transcription factor mutants, we found that orthologs of asexual developmental regulators in A. nidulanscorresponding to flbC(NCU03043) and medA
(NCU07617) were differentially expressed during asex-ual development inN. crassa(Table 4). The NCU03043 and NCU07617 deletion mutants are defective in con-idiation (Colotet al.2006), suggesting that they play a central role in regulating this developmental process.
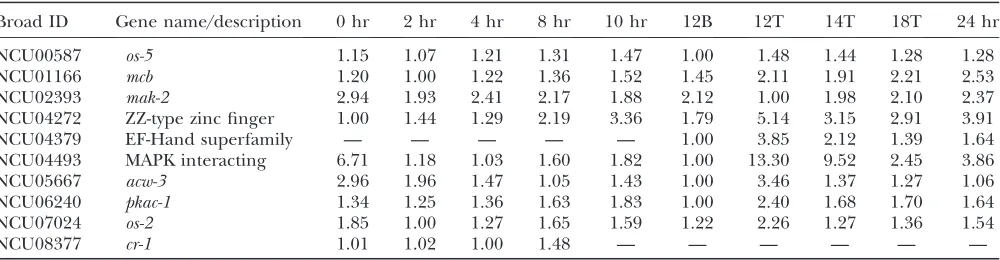
Other genes with aerial hyphae-specific induction included NCU04272, NCU04379, NCU04493, and NCU05667 (Table 5). NCU04272 encodes a protein containing four ZZ-type zinc finger domains. ZZ zinc finger proteins are known to bind DNA, RNA, protein, and lipid substrates (Klug 1999; Legge et al. 2004; Brown 2005; Hall 2005; Gamsjaeger et al. 2007). NCU04379 encodes a protein with similarity to Ca21
-binding proteins (EF-Hand superfamily). These pro-teins are involved in signal transduction mechanisms related to cell division and chromosome partitioning (Dayet al.2002). NCU04493 and its paralog NCU05667 (acw-3) encode predicted secreted proteins with
simi-TABLE 3
Relative gene expression of cell wall and membrane modification genes
Broad ID Gene name/description 0 hr 2 hr 4 hr 8 hr 10 hr 12B 12T 14T 18T 24 hr
NCU00471 Carboxypeptidase 1.18 1.00 1.51 2.90 3.58 1.36 5.04 2.58 2.61 4.01
NCU00586 ncw-6, SUR7a 1.00 1.31 1.13 1.26 1.45 1.22 3.43 5.68 3.82 4.64
NCU00673 spr-4 1.00 1.72 2.04 3.23 4.22 1.76 6.05 2.93 3.34 4.48
NCU01068 MUG137a 1.28 1.03 1.04 1.36 1.76 1.00 3.15 1.50 1.38 2.65
NCU01366 cpr-5 1.10 1.13 1.00 1.55 3.76 1.16 5.16 2.75 2.16 2.52
NCU01510 C2 domain protein 2.68 1.00 1.37 1.87 1.66 2.28 8.28 4.93 4.96 5.84
NCU02322 m-6-p isomerase — — — — — 1.00 5.50 5.41 3.81 4.59
NCU02540 LSP1a 1.00 1.32 1.24 2.19 2.15 1.46 4.49 4.59 4.08 4.53
NCU02956 Aspartic proteinase 1.13 1.05 1.11 1.11 1.05 1.00 3.23 1.64 1.50 1.84
NCU03254 Cellulase — — — — — 1.00 7.62 5.64 3.39 3.58
NCU04421 anx-14 2.37 1.61 2.30 4.33 4.23 1.00 3.75 1.80 1.44 4.08
NCU04431 Glucanase — — — — — 1.00 5.16 2.25 1.49 2.07
NCU04727 Glucosamine deaminase 1.00 1.25 1.40 1.29 1.65 1.02 5.48 3.46 1.70 1.58
NCU04798 Alpha-1,2-mannosidase 1.21 1.39 1.43 1.65 2.01 1.00 3.06 2.11 2.04 1.71
NCU04883 gh18-4 — — — — — 1.00 16.42 3.77 1.39 1.51
NCU04924 cut-1 1.36 1.04 1.10 2.35 2.95 1.00 3.71 2.58 2.27 2.82
NCU05858 Fatty acid oxygenase — — — — — 1.00 12.45 5.97 4.62 6.38
NCU06020 Chitinase 1.17 1.00 1.46 1.47 1.57 1.22 3.63 2.83 1.92 2.32
NCU06871 Glucan synthase 2.54 1.09 1.00 1.06 1.36 1.42 3.77 1.86 1.38 1.41
NCU07253 Glucanosyltransferases 2.77 2.08 1.55 2.40 1.99 1.00 7.35 3.28 2.19 3.29
NCU07495 PIL1a — — — — — 1.00 3.83 4.90 2.65 2.99
NCU07523 Glucanase 1.04 1.14 1.37 1.43 1.20 1.00 8.62 2.42 1.20 1.72
NCU07923 Peptidase S41 family 1.10 1.20 1.35 1.55 1.85 1.00 3.69 2.52 1.25 1.37
NCU08087 Glucanase 1.05 1.03 1.10 2.31 3.47 1.00 6.70 4.16 4.38 5.02
NCU08600 KAR9a 1.03 1.06 1.17 1.54 1.85 1.00 3.06 1.94 1.92 1.78
—, no data. a
larity to fungal proteins that are anchored in the cell wall (GPI anchors). The functions of these proteins in the Ascomycota are unclear, but in some Basidiomycota, they appear to be involved in both fruiting body formation and infection cell development (Link and Voegele 2008). One member of this family from the Shitake mushroom interacts with a fruiting body formation-induced MAP kinase in the yeast two-hybrid system (Szetoet al. 2007). Conceivably these proteins could interact to link information about cell wall sur-face architecture to calcium or MAP kinase signaling pathways.
At 12 hr, expression of mak-2 (sexual development MAP kinase; NCU02393) was significantly lower in the aerial tissue as compared to the mycelial mat, andos-2
(osmolarity MAP kinase; NCU07024) exhibited an opposite pattern in the 12B vs. 12T comparison. The MAPKKs from the MAK-2 (NCU02393) and the OS-2 (NCU00587) pathways were coregulated with their respective MAPK partners (Figure 5, MAP kinases, Table 5). Strains with mutations inmak-2 lack aerial hyphae and are activated for conidiation similar tocr-1(Liet al. 2005). Therefore a decline in activity of the mak-2
pathway is expected in aerial tissue and a decline in the
mak-2 transcript levels is consistent with this view (Pandeyet al.2004). Once aerial hyphae are produced, a decline inmak-2transcript levels may correspond to a decrease in the activity of the pathway, which would promote conidial morphogenesis at the expense of con-tinued growth of the aerial hyphae. On the basis of the phenotypes of thecr-1 and pkac-1mutants (Rosenberg and Pall1979; Bannoet al.2005), we expect the cAMP
signaling pathway to be upregulated until the elongation of aerial hyphae ceases and then downregulated at the onset of conidiogenesis (12 hr in the aerial tissue). A decline in cAMP synthesis would be consistent with the decline in expression of the genes for glycolysis and ribosomal proteins observed in the 12T tissue. However, we did not detect a decrease in expression of genes associated with the cAMP pathway (NCU06240, NCU01166, and NCU08377; Table 5). Rather for pkac-1, we observed a twofold increase in expression levels in the aerial hyphae at 12 hr. Thus, we speculate that transcriptionof pkac-1is subject to feedback activation when cAMP levels are low.
In S. cerevisiae, the high-affinity phosphodiesterase (Pde2p) is responsible for the breakdown of cAMP (Sass et al. 1986). Expression for the N. crassa PDE2 ortholog (NCU00478) was constitutive. The NCU00478 deletion mutant was preliminarily characterized as aconidial (Colot et al. 2006). We obtained the NCU00478 deletion mutant and confirmed that it was aconidial, blocked prior to minor constriction chain formation. Therefore, in absence of cAMP turnover, the transition from aerial hyphae formation to proconidial chain formation is blocked. We noted the morpholog-ical defect of NCU00478 was similar to the phenotype of a previously identified aconidial temperature-sensitive mutant (acon-2) (Matsuyamaet al.1974). Furthermore, NCU00478 is located on linkage group IIIR, close to the map location ofacon-2(Perkinset al.2001). Therefore, we performed the crosses and direct sequencing neces-sary to determine whether NCU00478 andacon-2were allelic.
TABLE 4
Relative expression ofN. crassatranscription factors with developmental phenotypes in deletion mutants
Broad ID Gene name 0 hr 2 hr 4 hr 8 hr 10 hr 12B 12T 14T 18T 24 hr
NCU00499 ada-1 1.00 1.63 1.65 2.29 2.97 3.93 2.21 2.35 2.68 4.66
NCU01459 asl-2 1.00 1.17 1.24 1.64 2.05 1.07 2.49 1.79 1.81 1.67
NCU02713 csp-1 1.00 1.73 1.17 1.38 — — — — — —
NCU02713 csp-1 — — — — — 1.00 6.05 2.43 2.17 3.00
NCU03043 flbCa — — — — — 1.00 6.05 2.43 2.17 3.00
NCU03489 col-21 1.25 1.30 1.33 1.44 1.59 1.00 1.69 1.53 1.58 1.38
NCU03593 kal-1 1.34 1.98 1.47 1.43 1.38 1.45 1.04 1.01 1.00 1.09
NCU03686 lah-3 1.80 1.32 1.32 1.46 1.61 1.38 1.00 1.01 1.39 1.35
NCU03931 ada-5 1.20 1.07 1.07 1.02 1.00 1.08 1.52 1.10 1.18 1.15
NCU04179 sah-1 1.00 2.16 1.73 2.63 2.39 1.41 1.84 2.01 1.94 2.10
NCU04731 sah-2 — — — — — 1.00 1.34 1.08 1.05 1.01
NCU06656 acu-15 1.00 1.43 1.15 1.72 1.85 2.00 1.37 1.61 1.60 2.60
NCU07374 sah-3 1.33 1.23 1.27 1.36 1.51 1.00 1.76 1.45 1.55 1.26
NCU07617 medAa 1.37 1.25 1.34 1.63 2.17 1.00 3.56 2.00 1.93 1.75
NCU08307 C6-Zn2b — — — — — 1.00 5.12 1.92 1.23 1.00
NCU08651 col-27 1.38 1.73 1.95 2.30 2.73 1.00 1.48 1.56 2.17 2.31
NCU08726 f l — — — — — 1.00 8.52 3.03 2.47 2.79
—, no data. aOrtholog in
Aspergillus nidulans.
Crosses between acon-2and the NCU00478 deletion strain were fertile. We scored 316 progeny for conidia-tion at 34°, and all were aconidial, suggestingacon-2and NCU00478 are allelic. Amplification of the NCU00478 region from theacon-2mutant generated a PCR product that was 1693 bp smaller than expected. DNA sequenc-ing revealed that 757 bp of the C terminus of NCU00478 were deleted in theacon-2mutant. This deletion creates a loss of 252 amino acids in the predicted C terminus and shifts the stop codon to within the intergenic region with the addition of 23 amino acids. Transformation of theacon-2mutant strain with a plasmid containing the wild-type version of NCU00478 (pCG2) restored con-idiation at 34°, thus, confirming thatacon-2 is an allele of NCU00478.
Iveyet al. (2002) showed that the GNA1 Gaprotein activates adenlyate cyclase and that thegna-1 mutant is derepressed for conidiation. Interestingly, the cr-1; gna-1 double mutant is synergistic in the degree of derepression of conidiation and addition of exogenous cAMP restores repression of conidiation in the cr-1
mutant, but does not fully restore repression of con-idiation in thecr-1; gna-1double mutant. This suggests thatgna-1regulates conidiation by its effect on cAMP signaling and by a cAMP-independent pathway (Ivey
et al.2002). Liet al. (2005) showed that a MAP kinase (encoded bymak-2) is derepressed for conidiation and that repression of conidiation is not restored by addi-tion of exogenous cAMP (Li et al.2005). Thus, gna-1 may be involved in regulating both the MAP kinase and cAMP signaling pathways. We hypothesize that the
acon-2; mak-2double mutant may display some partial restoration of conidiation compared to the acon-2
mutant.
In conclusion, this microarray analysis captured an important time point (12 hr) in asexual development, which corresponded to the transition from aerial hy-phae formation to proconidial chain development. In particular, by separating the mycelial and aerial tissue we were able to observe spatial differentiation of gene expression, including genes involved in transcriptional
regulation, signal transduction, carbon and nitrogen metabolism, ribosomal protein synthesis, cytoskeleton structure, and cell wall differentiation. Further analysis of transcription factors identified in this study and which, when deleted give aconidial phenotypes (Colot
et al.2006), will serve to further elucidate the molecu-lar genetic control of N. crassa asexual development. Finally, transcriptional downregulation of the mak-2
MAP kinase pathway in aerial hyphae is consistent with our model of MAK2 function (Liet al.2005). Themak-2 mutant is induced for conidiation and has reduced aerial hyphae. Thus, we expect MAK2 to be active during the growth of aerial hyphae. MAK2 activity is expected to decline at the onset of conidial morpho-genesis and transcriptional downregulation of mak-2
and NCU04612 the MAPKK of the MAK2 pathway may be the means of reducing the activity of this MAP kinase pathway. As with themak-2pathway, a block in the cAMP pathway causes induction of conidiation at the expense of aerial hyphae growth (Li et al.2005). However, no transcriptional downregulation of components of the cAMP pathway was observed, and indeed an increase in transcripts for the cAMP-dependent protein kinase catalytic subunit, pkac-1, was found. We reasoned that the pathway may be regulated by cAMP levels during conidiation, rather than transcriptional regulation of genes encoding components of the cAMP pathway. Since mutations that block the cAMP pathway induce conidiation, we characterized a mutant in the high-affinity phosphodiesterase that should lead to elevated cAMP levels. As expected, we found that this mutant was blocked in conidial morphogenesis. Furthermore, we showed that this gene corresponds to the previously identified temperature-sensitive conidiation gene,acon-2.
We thank the Gene Technology Lab at Texas A&M and the Fungal Genetic Stock Center. This research was funded by National Science Foundation IOS-0716894 (to B.D.S., H.H.W., and D.J.E.) and a National Institutes of Health multi-institutional program project grant (GM068087) (to N.L.G.).
TABLE 5
Relative gene expression of signal transduction genes
Broad ID Gene name/description 0 hr 2 hr 4 hr 8 hr 10 hr 12B 12T 14T 18T 24 hr
NCU00587 os-5 1.15 1.07 1.21 1.31 1.47 1.00 1.48 1.44 1.28 1.28
NCU01166 mcb 1.20 1.00 1.22 1.36 1.52 1.45 2.11 1.91 2.21 2.53
NCU02393 mak-2 2.94 1.93 2.41 2.17 1.88 2.12 1.00 1.98 2.10 2.37
NCU04272 ZZ-type zinc finger 1.00 1.44 1.29 2.19 3.36 1.79 5.14 3.15 2.91 3.91
NCU04379 EF-Hand superfamily — — — — — 1.00 3.85 2.12 1.39 1.64
NCU04493 MAPK interacting 6.71 1.18 1.03 1.60 1.82 1.00 13.30 9.52 2.45 3.86
NCU05667 acw-3 2.96 1.96 1.47 1.05 1.43 1.00 3.46 1.37 1.27 1.06
NCU06240 pkac-1 1.34 1.25 1.36 1.63 1.83 1.00 2.40 1.68 1.70 1.64
NCU07024 os-2 1.85 1.00 1.27 1.65 1.59 1.22 2.26 1.27 1.36 1.54
LITERATURE CITED
Aguirre, J., and W. Hansberg, 1986 Oxidation ofNeurospora crassa
glutamine synthetase. J. Bacteriol.166:1040–1045.
Aguirre, J., R. Rodriguezand W. Hansberg, 1989 Oxidation of Neurospora crassaNADP-specific glutamate dehydrogenase by ac-tivated oxygen species. J. Bacteriol.171:6243–6250.
Aguirre, J., W. Hansbergand R. Navarro, 2006 Fungal responses
to reactive oxygen species. Med. Mycol.44:101–107.
Bailey, L. A., and D. J. Ebbole, 1998 Thefluffygene ofNeurospora crassaencodes a Gal4p-Type C6 zinc cluster protein required for conidial development. Genetics148:1813–1820.
Bailey-Shrode, L., and D. J. Ebbole, 2004 Thefluffygene of Neu-rospora crassais necessary and sufficient to induce conidiophore development. Genetics166:1741–1749.
Banno, S., N. Ochiai, R. Noguchi, M. Kimura, I. Yamaguchiet al.,
2005 A catalytic subunit of cyclic AMP-dependent protein kinase, PKAC-1, regulates asexual differentiation inNeurospora crassa.Genes Genet. Syst.80:25–34.
Belden, W. J., L. F. Larrondo, A. C. Froehlich, M. Shi, C.-H. Chen et al., 2007 The band mutation inNeurospora crassais a domi-nant allele ofras-1implicating RAS signaling in circadian output. Genes Dev.21:1494–1505.
Berlin, V., and C. Yanofsky, 1985a Isolation and characterization
of genes differentially expressed during conidiation ofNeurospora crassa.Mol. Cell. Biol.5:849–855.
Berlin, V., and C. Yanofsky, 1985b Protein changes during the
asexual cycle ofNeurospora crassa.Mol. Cell. Biol.5:839–848. Brown, R. S., 2005 Zinc finger proteins: getting a grip on RNA.
Curr. Opin. Struct. Biol.15:94–98.
Ca´ rdenas, M. E., and W. Hansberg, 1984 Glutamine metabolism
during aerial mycelium growth ofNeurospora crassa.J. Gen. Micro-biol.130:1733–1741.
Carroll, A. M., J. A. Sweigardand B. S. Valent, 1994 Improved
vectors for selecting resistance to hygromycin. Fung. Genet. Newslett.41:20–21.
Colot, H. V., G. Park, G. E. Turner, C. Ringelberg, C. M. Crew et al., 2006 A high-throughput gene knockout procedure for
Neurosporareveals functions for multiple transcription factors. Proc. Natl. Acad. Sci. USA103:10352–10357.
Coux, O., K. Tanakaand A. L. Goldberg, 1996 Structure and
func-tions of the 20S and 26S proteasomes. Annu. Rev. Biochem.65:
801–847.
Davis, R. H., and F. J.deSerres, 1970 Genetic and microbiological
research techniques forNeurospora crassa.Meth. Enzymol.17A:
79–143.
Davletov, B. A., and T. C. Su¨ dhof, 1993 A single C2 domain from
synaptotagmin I is sufficient for high affinity Ca21/phospholipid
binding. J. Biol. Chem.268:26386–26390.
Day, I., V. Reddy, G. ShadAliand A. Reddy, 2002 Analysis of
EF-hand-containing proteins inArabidopsis.Genome Biol.3:56.51–56.24. Dunlap, J. C., K. A. Borkovich, M. R. Henn, G. E. Turner, M. S.
Sachset al., 2007 Enabling a community to dissect an
organ-ism: overview of the Neurospora functional genomics project. Adv. Genet.57:49–96.
Ebbole, D. J., and M. S. Sachs, 1990 A rapid and simple method for
isolation ofNeurospora crassahomokaryons using microconidia. Fung. Genet. Newslett.37:17–18.
Forment, J. V., M. Flipphi, D. Ramon, L. Ventura and A. P.
MacCabe, 2006 Identification of themstE gene encoding a
glucose-inducible, low affinity glucose transporter inAspergillus nidulans.J. Biol. Chem.281:8339–8346.
Gamsjaeger, R., C. K. Liew, F. E. Loughlin, M. Crossleyand J. P.
Mackay, 2007 Sticky fingers: zinc-fingers as protein-recognition
motifs. Trends Biochem. Sci.32:63–70.
Garnjobst, L., and E. L. Tatum, 1967 A survey of new
morpholog-ical mutants inNeurospora crassa.Genetics57:579–604. Gerke, V., C. E. Creutz and S. E. Moss, 2005 Annexins: linking
Ca21signalling to membrane dynamics. Nat. Rev. Mol. Cell Biol.
6:449–461.
Hall, T. M. T., 2005 Multiple modes of RNA recognition by zinc
finger proteins. Curr. Opin. Struct. Biol.15:367–373.
Hasunuma, K., and Y. Shinohara, 1985 Characterization ofcpd-1
andcpd-2mutants which affect the activity of orthophosphate regulated cyclic phosphodiesterase inNeurospora. Curr. Genet.
10:197–203.
Ivey, F. D., A. M. Kaysand K. A. Borkovich, 2002 Shared and
in-dependent roles for a Gaiprotein and adenylyl cyclase in
regu-lating development and stress responses in Neurospora crassa.
Eukaryotic Cell1:634–642.
Kasuga, T., and N. L. Glass, 2008 Dissecting colony development
ofNeurospora crassausing mRNA profiling and comparative ge-nomics approaches. Eukaryot. Cell7:1549–1564.
Kasuga, T., G. Mannhauptand N. L. Glass, 2009 Relationship
be-tween phylogenetic distribution and genomic features in Neuros-pora crassa.PLoS ONE4:e5286.
Kays, A. M., and K. A. Borkovich, 2004 Severe impairment of
growth and differentiation in aNeurospora crassamutant lacking all geterotrimeric Gaproteins. Genetics166:1229–1240. Klein, C., and K. Struhl, 1994 Protein kinase A mediates
growth-regulated expression of yeast ribosomal protein genes by modulat-ing RAP1 transcriptional activity. Mol. Cell. Biol.14:1920–1928. Klug, A., 1999 Zinc finger peptides for the regulation of gene
ex-pression. J. Mol. Biol.293:215–218.
Lara, M., L. Blanco, M. Campomanes, E. Calva, R. Palacioset al.,
1982 Physiology of ammonium assimilation inNeurospora crassa.
J. Bacteriol.150:105–112.
Lee, K., and D. J. Ebbole, 1998 Tissue-specific repression of
starva-tion and stress responses of theNeurospora crassa con-10gene is mediated by RCO1. Fungal Genet. Biol.23:269–278.
Legge, G. B., M. A. Martinez-Yamout, D. M. Hambly, T. Trinh, B. M.
Leeet al., 2004 ZZ domain of CBP: an unusual zinc finger fold in
a protein interaction module. J. Mol. Biol.343:1081–1093. Li, D., P. Bobrowicz, H. H. Wilkinsonand D. J. Ebbole, 2005 A
mitogen-activated protein kinase pathway essential for mating and contributing to vegetative growth inNeurospora crassa. Genet-ics170:1091–1104.
Link, T. I., and R. T. Voegele, 2008 Secreted proteins ofUromyces fabae: similarities and stage specificity. Mol. Plant Pathol.9:59–66. Matsuyama, S. S., R. E. Nelsonand R. W. Siegel, 1974 Mutations
specifically blocking differentiation of macroconidia in Neuros-pora crassa.Dev. Biol.41:278–287.
Meiklejohn, C. D., and J. P. Townsend, 2005 A Bayesian method for
analysing spotted microarray data. Brief. Bioinformatics6:318–330. Michan, S., F. Llediasand W. Hansberg, 2003 Asexual
develop-ment is increased in Neurospora crassacat-3- null mutant strains. Eukaryot. Cell2:798–808.
Miller, R. K., and M. D. Rose, 1998 Kar9p Is a novel cortical
pro-tein required for cytoplasmic microtubule orientation in yeast. J. Cell Biol.140:377–390.
Mira, J.-P., T. Dubois, J.-P. Oudinet, S. Lukowski, F.o. Russo-Marie et al., 1997 Inhibition of cytosolic phospholipase A2 by annexin V in differentiated permeabilized HL-60 cells. J. Biol. Chem.272:
10474–10482.
Pandey, A., M. G. Roca, N. D. Readand N. L. Glass, 2004 Role of a
mitogen-activated protein kinase pathway during conidial germi-nation and hyphal fusion inNeurospora crassa.Eukaryot. Cell3:
348–358.
Perkins, D. D., A. Radfordand M. S. Sachs, 2001 The Neurospora Compendium: Chromosomal Loci.Academic Press, San Diego, CA. Peter, B. J., H. M. Kent, I. G. Mills, Y. Vallis, P. J. G. Butleret al.,
2004 BAR domains as sensors of membrane curvature: the am-phiphysin BAR structure. Science303:495–499.
Plesofsky-Vig, N., D. Lightand R. Brambl, 1983 Paedogenetic
conidiation inNeurospora crassa.Exp. Mycol.7:283–286. Rerngsamran, P., M. B. Murphy, S. A. Doyleand D. J. Ebbole,
2005 Fluffy, the major regulator of conidiation in Neurospora crassa, directly activates a developmentally regulated hydropho-bin gene. Mol. Microbiol.56:282–297.
Rosenberg, G., and M. L. Pall, 1979 Properties of two cyclic
nucleotide-deficient mutants ofNeurospora crassa.J. Bacteriol.137:1140– 1144.
Ruepp, A., A. Zollner, D. Maier, K. Albermann, J. Hani et al.,
2004 The FunCat, a functional annotation scheme for system-atic classification of proteins from whole genomes. Nucleic Acids Res.32:5539–5545.
Sargent, M. L., and D. O. Woodward, 1969 Genetic determinants
of circadian rhythmicity inNeurospora.J. Bacteriol.97:861–866. Sass, P., J. Field, J. Nikawa, T. Todaand M. Wigler, 1986 Cloning
Springer, M. L., 1993 Genetic control of fungal differentiation: the
three sporulation pathways of Neurospora crassa. BioEssays15:
365–374.
Springer, M. L., and C. Yanofsky, 1989 A morphological and
ge-netic analysis of conidiophore development inNeurospora crassa.
Genes Dev.3:559–571.
Springer, M. L., and C. Yanofsky, 1992 Expression ofcongenes
along the three sporulation pathways ofNeurospora crassa.Genes Dev.6:1052–1057.
Szeto, C. Y., G. S. Leungand H. S. Kwan, 2007 Le.MAPK and its
interacting partner, Le.DRMIP, in fruiting body development inLentinula edodes.Gene393:87–93.
Tang, J., A. Maximov, O.-H. Shin, H. Dai, J. Rizoet al., 2006 A
complexin/synaptotagmin 1 switch controls fast synaptic vesicle exocytosis. Cell126:1175–1187.
Toledo, I., J. Aguirreand W. Hansberg, 1986 Aerial growth in Neurospora crassa: characterization of an experimental model sys-tem. Exp. Mycol.10:114–125.
Townsend, J., 2003 Multifactorial experimental design and the
transitivity of ratios with spotted DNA microarrays. BMC Genomics4:41.
Turian, G., and D. E. Bianchi, 1972 Conidiation in Neurospora.
Bot. Rev.38:119.
Twumasi-Boateng, K., Y. Yu, D. Chen, F. N. Gravelat, W. C. Nierman et al., 2009 Transcriptional profiling identifies a role for BrlA in the response to nitrogen depletion and for StuA in the Regulation of Secondary Metabolite Clusters inAspergillus fumigatus.Eukaryot. Cell8:104–115.
Vishwanatha, J., and S. Kumble, 1993 Involvement of annexin II
in DNA replication: evidence from cell-free extracts ofXenopus
eggs. J. Cell. Sci.105:533–540.
Walther, T. C., J. H. Brickner, P. S. Aguilar, S. Bernales, C.
Pantojaet al., 2006 Eisosomes mark static sites of endocytosis.
Nature439:998–1003.
Xie, X., H. H. Wilkinson, A. Correa, Z. A. Lewis, D. Bell-Pedersen et al., 2004 Transcriptional response to glucose starvation and functional analysis of a glucose transporter ofNeurospora crassa.
Fungal Genet. Biol.41:1104–1119.
Yang, Y. H., and T. Speed, 2002 Design issues for cDNA microarray
experiments. Nat. Rev. Genet.3:579–588.
Yin, Z., S. Wilson, N. C. Hauser, H. Tournu, J. D. Hoheiselet al.,
2003 Glucose triggers different global responses in yeast, depending on the strength of the signal, and transiently sta-bilizes ribosomal protein mRNAs. Mol. Microbiol.48: 713– 724.
Young, M. E., T. S. Karpova, B. Brugger, D. M. Moschenross, G. K.
Wanget al., 2002 The Sur7p family defines novel cortical
do-mains inSaccharomyces cerevisiae, affects sphingolipid metabolism, and is involved in sporulation. Mol. Cell. Biol.22:927–934. Youssar, L., T. J. Schmidhauserand J. Avalos, 2005 The
Neuros-pora crassagene responsible for thecutandovcphenotypes enc-odes a protein of the haloacid dehalogenase family. Mol. Microbiol.55:828–838.
Zhang, X., R. L. Lesterand R. C. Dickson, 2004 Pil1p and Lsp1p
negatively regulate the 3-phosphoinositide-dependent protein pinase-like kinase Pkh1p and downstream signaling pathways Pkc1p and Ypk1p. J. Biol. Chem.279:22030–22038.
GENETICS
Supporting Information
http://www.genetics.org/cgi/content/full/genetics.110.121780/DC1
Temporal and Spatial Regulation of Gene Expression During Asexual
Development of
Neurospora crassa
Charles J. Greenwald, Takao Kasuga, N. Louise Glass, Brian D. Shaw, Daniel J. Ebbole
and Heather H. Wilkinson
Copyright
Ó
2010 by the Genetics Society of America
C. J. Greenwald et al. 2 SI
C. J. Greenwald et al. 3 SI
FILE S1
Features of the Neurospora crassa microarray that exhibited significant regulation during asexual
development
C. J. Greenwald et al. 4 SI
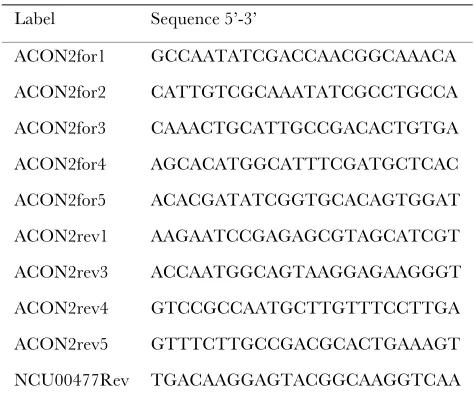
TABLE S1
List of primers used in this study
Label Sequence 5’-3’
ACON2for1 GCCAATATCGACCAACGGCAAACA
ACON2for2 CATTGTCGCAAATATCGCCTGCCA
ACON2for3 CAAACTGCATTGCCGACACTGTGA
ACON2for4 AGCACATGGCATTTCGATGCTCAC
ACON2for5 ACACGATATCGGTGCACAGTGGAT
ACON2rev1 AAGAATCCGAGAGCGTAGCATCGT
ACON2rev3 ACCAATGGCAGTAAGGAGAAGGGT
ACON2rev4 GTCCGCCAATGCTTGTTTCCTTGA
ACON2rev5 GTTTCTTGCCGACGCACTGAAAGT