Research Development Cell, Government College of Engineering, Jalagon (M. S), India
A Stratified Methodology for Selection of
Distributed Generation Systems for Policy
Makers in Tamil Nadu
M.Manigandan, Dr.B.Basavaraja
Research Scholar, Department of E.E.E, Acharaya Nagarjuna University, India.
Professor & Chairman, Department of E.E.E, University BDT College of Engineering, India
ABSTRACT: The sketch of the massive rise in demand as compared to generation was enforced on the system; electric services have been restructured so that operators will plan to implement alternative energy resources as we have varying environmental conditions and resource possibility. By enforcing, the environmental banks have been reduced in addition to the improvement of quality and reliability in the supply. As the contribution of distributed energy increases, it is essential to estimate the impact on the grid and consistently it becomes problematic in the division of authorities to report a correct decision on electing the type of distributed energy for a distinct region. The main motive is to determine various distributed energy options in TamilNadu with consideration of absolute attributes mainly environmental. Analytic hierarchy process (AHP) and Vlse Kriterijumska Optimizacija Kompromisno Resenje (VIKOR) are being used to analyze the corresponding priority of the chosen attributes and suitable distributed energy source options are decided which will useful for policy maker. This study would be effective to estimate the subsequent impacts of rising distributed power proportions and increase in policy makers.
KEYWORDS: Distributed Energy (DE) technologies, MADM, AHP, VIKOR, Environment, Priority
I. INTRODUCTION
The essential purpose of distribution energy system is to fit the customer’s demand after acquiring the quality electrical energy and closeness to the extreme consumer and huge cost to provide capital are the sense that make the important part of the utility, which endeavor to increment the accuracy of a regular power system. Sustainable energy systems are reasonable to have an elevated contribution of renewable energy with final expanding greenhouse gas discharge is crucial to search alternative disinfectant sources of energy and consolidate them into the current system before the overall resources are drained and damaged beyond recovery. With the integration of alternative sources, the productiveness is funded by operating in an economical and predictable way. The energy technologies considered as appraisal includes Solar PV, Wind turbine, Fuel cell, Diesel engine, Gas turbine, Biomass and Micro-Turbine.
Research Development Cell, Government College of Engineering, Jalagon (M. S), India
II. PROPOSED STRATEGIC FRAMEWORK
In this paper, an approach to Distributed energy sources are planned based on Operation and Technical, Economic, Environmental and social attributes are presented. Operation and Technical Attributes is a major attribute in conditions of system performance and Economical attributes are very essential for concluding cost of energy formed by certain technology where various aspects of sub-attributes are being associated with main attributes. To obtain the relevant choice of sources in different districts of Tamil Nadu, pairwise observations are made among sources, considering each sub attribute and pairwise observations are built between sub attributes in regard to the main attribute. During pairwise observation, weights are assigned for the interest, the privilege attributes or the sub attributes.
In the process of decision making, it is rather challenging to provide perfect numeral values for Operation and Technical, Economical, Environmental and social attributes. Thus, for these types of task, the AHP method is considered which is having both quantitative and qualitative criteria and VIKOR method are used for process of decision making . The decision making framework subsists of three attributes as presented in Fig. 1.
Figure.1 Flow diagram for DG planning in different districts of Andhra Pradesh
III. EVALUATION ATTRIBUTES
A. Operation and Technical attributes
Distributed energy has prominent in generating capacity in order to develop the scope in the current power system and various factors to be considered for integration of new distribution energy installations among them Operation and Technical should be analyzed and they will represent the specific applicability of various distribution systems confide in different considerations. Installation time is also major factors that are defined as the overall time required for installing the technology which includes setup and run time. However, all distribution systems have the skill in operating and controlling.
B. Economical attributes
It plays a major role in any investment and it depends on many factors like basic investments, fuel tariff etc. Investment cost covers the primary and installation costs for integrating and the extent of fuel utilization of renewable sources will be less when compared to existing energy systems. While analyzing distribution system of a particular zone all the three constituents have to be considered.
C. Environmental attributes
Research Development Cell, Government College of Engineering, Jalagon (M. S), India
D. Social attributes
The Social aspects are very important in dealing the distributed energy sources for a long period between them acceptability of sources at regional, area and work establishment plays a major role in having hiked in energy sources. State Tamil Nadu like having different Operation and Technical, Economic and Environmental attributes should also have a social aspect which will lead to have a good selection and increase in distributed energy sources
IV. ENERGY TECHNOLOGIES
A. Solar PV (SPV)
Solar energy is the incandescent light and heat from the sun and the sun strap using a range of ever emerging technologies [4]. Solar farms are already installed at potential area like Sivagangai District (5 MW grid) and total installed capacity in the State by July, 2014 is 109.26 MW are running efficiently as per the distributed loads. B. Wind Turbine (WT)
Wind energy depends on the potentials of wind present in places among them Muppandal wind farm as the total capacity of 1500MW, which is the largest in India. The total installed capacity is 7253MW as per Tamil Nadu Energy Development Agency (TEDA).
C. Fuel Cell (FC)
Tamil Nadu seeks prominent providers and strong that have the core ability in power generation and many Research and development of metal hydride storage is ongoing strengthen to set up and have many valuable aspects of power production, including huge potential efficiencies, no losses in performance when it is operating at any load.
D. Diesel engine (DE)
Among non-renewable choice, diesel engines have high potential, prevailing and preferred due to their excellent propelled and higher thermal efficiency in TamilNadu.
E. Gas Turbine (GT)
Gas turbines are at a gallop enhancing popular worldwide as it is mechanized by natural gas with many units which can meet the power demand. Natural gas bids the favor of hike in global efficiency of generation. The state has installed capacity of 3,925 MW and is producing just about 500 MW.
F. Biomass (BM)
Biomass mainly generates by the process of gasification, steam turbines and are generally listed as solid biomass, liquid biofuels and biogas among them biogas being the largely used for limited and off-grid applications, rural and bulk of gasifiers are provided for individual households.
G. Micro-Turbines (MT)
Micro-turbine units have a rated output that may vary between 30 kW to 400 kW. The most common configuration for a micro-turbine is a single-shaft machine having high rotational speeds that may vary between 50’000 and 120’000 RPM, depending on the specific capacity of the micro-turbine. This high-frequency output must first be rectified and then converted to the nominal 50 Hz.
V.ANALYTICHIERARCHYPROCESS(AHP)
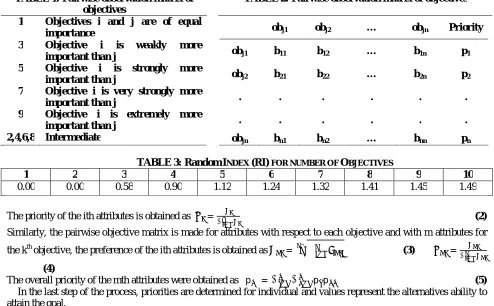
The Multi-attribute decision making (MADM) way is one among the well enough technical aids for critical planning and it electable the finest resource approach with a view to the chosen attributes [8, 9]. Identifying the principle and the alternatives and arranged in order form the pairwise estimation matrix. It is required for valuation of weights for reasoning principle and a similarity of target/option i and j handle a rate bij, explained in Table 1. Further, if bij = k, then bji = 1/k [10, 11].
Considering a problem to compute m option with n attributes, the pairwise observation of various targets has been shown in Table 2.
The corresponding weights can be figured out as normalized analytical means of the rows and geometrical mean is
Research Development Cell, Government College of Engineering, Jalagon (M. S), India
TABLE 1: Pairwise observation matrix of objectives
TABLE 2: Pairwise observation matrix of objectives
1 Objectives i and j are of equal
importance obj1 obj2 … objn Priority
3 Objective i is weakly more
important than j obj1 b11 b12 … b1n p1 5 Objective i is strongly more
important than j obj2 b21 b22 … b2n p2 7 Objective i is very strongly more
important than j . . . . . .
9 Objective i is extremely more
important than j . . . . . .
2,4,6,8 Intermediate objn bn1 bn2 … bnn pn
TABLE 3: RandomINDEX (RI) FOR NUMBER OF OBJECTIVES
1 2 3 4 5 6 7 8 9 10
0.00 0.00 0.58 0.90 1.12 1.24 1.32 1.41 1.45 1.49
The priority of the ith attributes is obtained as =
∑ (2)
Similarly, the pairwise objective matrix is made for attributes with respect to each objective and with m attributes for
the kth objective, the preference of the ith attributes is obtained as = ∏ (3) =
∑
(4)
The overall priority of the mth attributes were obtained as p =∑ ∑ p p (5) In the last step of the process, priorities are determined for individual and values represent the alternatives ability to attain the goal.
V. VLSE KRITERIJUMSKA OPTIMIZACIJA KOMPROMISNO RESENJE (VIKOR)
VIKOR is a feasible in order to have the optimal solution and faculty of adjustment is consent attain by mutual benefits. For the estimation of VIKOR attributes, following steps have to be done:
Step 1: Determine objective and analyze the aspect values for individual alternative.
Step 2: Development of matrix pattern, the row of the matrix is set aside to single alternative and individual column to unit aspect and decision matrix is expressed as:
=
⎣ ⎢ ⎢ ⎢ ⎢
⎡ ……
.. .
.. .
.. .
… .. . …
.. .
⎦ ⎥ ⎥ ⎥ ⎥ ⎤
(6)
Step 3: Develop the normalized matrix for decision using equation (6) with formula ∗ = ∑ (7)
Step 4: Confide in the corresponding attention of different attribute attains weight for every aspect using equation (8) which should be below and sum must be 1 and the variance (Vj )of individual aspect is determined using =
∑ & ∑ = (8) = ( )∑ ∗ − ∗ (9)
Research Development Cell, Government College of Engineering, Jalagon (M. S), India
Step 6: Collect the maximum norm ∗and the minimum norm
∗= = = , , … ]
(10a)
= = = , , … ] (10b)
Step 7: Calculate utility and regret for all alternatives using equations (11a) & (11b):
(a) Utility =∑
∗
∗
(11a)
(b) Regret = [ ( ∗− )/( ∗− )]
(11b)
Step 8: Calculate the equivalent of VIKOR ratio for individual using = ∗∗+ ( − )( ∗∗) (12)
∗= = [( )| = , , … ] = = [( )| = , , … ] (13 a), (13b)
∗= = [( )| = , , … ] = = [( )| = , , … ] (14 a), (14b)
v & 1-v are the weight for maximum value of all utility generally set to 0.5 and weight of the specific regret. Step 9: Rank of the alternative is made using equation (12) in which less value demonstrates a superior quality
VI. CASE STUDY:TAMILNADU
Tamil Nadu, the 11th Largest state in India covers 130058 sq.km(50,216 sq miles) and has a coastline of about 910 km (600 miles).It is 7th most populous state With a population of about 74,319,357 million, nearly 6 % of India‘s population. It is divided into 32 districts and climate ranges from dry sub-humid to semi-arid, but the state has the distribution of two monsoon seasons south-west monsoon from June to September and north east monsoon from October to December. This particular feature has helped Tamil Nadu to become a favored wind power destination because of monsoon winds contributes a bulk amount of annual wind power generation. The State of TamilNadu is rich in renewable energy sources, especially wind and solar. Currently, approximately one-fourth of renewable energy sources exist in TamilNadu only. The cost of Renewable Energy Source based generation is increasing with time because of price deviations and supply constraints. Different government agencies such as the energy department, TNEB, TEDA, State planning commission and TamilNadu electricity regulatory (TNERC) will develop technical, administrative and communication capacities. The capital required for increasing renewable sources capability advances, rise in funds.
Distribution energy system is a vast perception which consists of discrete technologies, although diesel/gas retaliate machines enclose most capacity installed and technologies include its different attributes such as operational and technical, economical, environmental, etc. Multi-attribute decision making approach is one of the perfect technical aids of electric utilities the objective is to present a comparative assessment designed at a certain interest for different technologies. Each criteria are split into several sub-criteria, and decision process is applied in order to represent a sensitive case is implemented to determine the importance of state regulations on final decisions which help decision makers and private investors in the development of distributed generation. In the current task, adequate way for decision of the perfect energy technologies according to operational and technical, economical, and environmental attributes, initially it involves the priority by consideration of different attributes using the AHP method and method of making a decision for every attribute using Topics simultaneously. This method is executed to determine the priority of individual attributes in order to make a final decision over various zones in Tamil Nadu.
Research Development Cell, Government College of Engineering, Jalagon (M. S), India
Figure.2 DistrictsFlow diagram for DG planning in different districts of Andhra Pradesh
Table 4: Districts with Potential of Distribution Energy Sources
S.No District Name No. on Map SPV WT FC DE GT BM MT
1 Coimbatore 3 E I I I I I I
2 Cuddalore 4 I G I I I I G
3 Dindigul 6 I I G I I G I
4 Kanchipuram 8 E I I G I I I
5 kanyakumari 9 I G I I I I G
6 kanur 10 I I I I I G I
7 madhuri 12 I G I I I G G
8 Nagapattinam 13 I E I I G I G
9 Namakkal 14 I I I I I G I
10 pudukkottai 17 I I G G G E I
11 Rammanathapuram 18 I I I I G E G
12 Sivaganga 20 I I G G I G I
13 Thanjavur 21 I I I I G E G
14 Thoothukudi 23 I G I I I E I
15 Thirunelveli 25 I E I I I I G
16 Thiruvallur 27 I G I I I I I
17 Tiruvannamalai 28 G I I I I I I
18 Thiruvarur 29 I I G I E E I
19 Villupuram 31 I I I G I I I
20 Virudhunagar 32 I G I I I G I
SPV=Solar PV, WT=Wind Turbine, FC=Fuel Cell, DE=Diesel Engine, GT=Gas Turbine, BM=Biomass, MT=Micro-Turbine,
Research Development Cell, Government College of Engineering, Jalagon (M. S), India
Figure 2 represents districts present in Tamil Nadu state; Table 4 represents various potential districts with distribution energy sources. From Table 4 districts are combined by considering potential distributed sources and done with different zones as shown in Table 5 which are represented in Figure 3
Figure 3: Geographical representation of different zones of electricity generation from DES
in Tamil Nadu State
Table 5: Potential Zones of Combined Distribution Energy Sources Zones No. on Map SPV WT FC DE GT BM MT Zone 1 13, 17, 21, 29 I E I G E E G Zone 2 12, 18, 20 I G I G G E G Zone 3 9,23,25,32 I E I I I E G Zone 4 4,28,31 G G I G I I I Zone 5 6,10,14 I I I I I I I Zone 6 8,27 E G I G I I I
SPV=Solar PV, WT=Wind Turbine, FC=Fuel Cell, DE=Diesel Engine, GT=Gas Turbine, BM=Biomass, MT=Micro-Turbine,
E= Excellent, G= Good, I= Intermediate
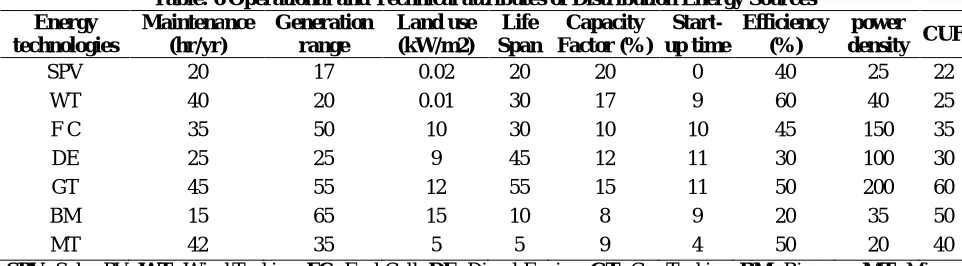
Table 6 presents various Operational and technical attributes related to distributed energy sources. Similarly, the Economic and Environmental attributes of the distributed energy sources are presented in Tables 7 and 8 respectively. Table 9 presents various Social attributes of distribution Energy Sources which are considered as per the Operational and technical, Economic and Environmental attributes at different zones of the state. The data from these tables have been utilized to perform pairwise comparisons and determine right preferences among various distributed energy sources in which it is illustrated by states of High, Medium and Low. High is used for the regions those have enormous and sufficient amount of resources but not enormous. Medium state is used for regions in which the resources are available in medium quantity. Low state is used for regions lacking the amount of a particular resource.
Table: 6 Operational and Technical attributes of Distribution Energy Sources Energy
technologies
Maintenance (hr/yr)
Generation range
Land use (kW/m2)
Life Span
Capacity Factor (%)
Start-up time
Efficiency (%)
power density CUF
SPV 20 17 0.02 20 20 0 40 25 22
WT 40 20 0.01 30 17 9 60 40 25
F C 35 50 10 30 10 10 45 150 35
DE 25 25 9 45 12 11 30 100 30
GT 45 55 12 55 15 11 50 200 60
BM 15 65 15 10 8 9 20 35 50
MT 42 35 5 5 9 4 50 20 40
Research Development Cell, Government College of Engineering, Jalagon (M. S), India
Table: 7 Economical attributes of Distribution Energy Sources
Energy
technologies IC
O &
M EC FCT SPV 6000 0.02 0.3 0
WT 2500 0.033 0.08 0 FC 3500 0.01 0.09 0.2 DE 300 0.01 0.12 0.06 GT 750 0.015 0.15 0.05 BM 1500 0.017 0.11 0.03 MT 3500 0.04 0.09 0.15
SPV=Solar PV, WT=Wind Turbine, FC=Fuel Cell, DE=Diesel Engine, GT=Gas Turbine, BM=Biomass, MT=Micro-Turbine,
IC=Investment Cost, O&M=Operational & Maintenance Cost, EC=Electricity Cost, FCT=Fuel Cost
Table: 8 Environmental attributes of Distribution Energy Sources
Energy
technologies SO2 NOX CO2 CO HC PM Noise
SPV 0 0 0 0 0 0 0
WT 0 0 0 0 0 0 60
FC 0.026 0.03 650 0.014 0.35 0 45 DE 15 12 670 5.7 1.7 0.4 70 GT 0.7 1 435 0.12 0.5 0.01 80 BM 0.5 0.85 40 0.08 0.2 0.02 35 MT 0.3 0.04 15 0.15 0.35 0 40
Table: 9 Social attributes of Distribution Energy Sources
Energy
technologies SA RE WE SPV High High High WT Low Medium Medium
FC High Medium High DE Low High Medium GT Low Medium Medium BM Medium High Low MT Low Medium Low
SC=Social Acceptability, RE=Resource availability, WE=Work establishment
Research Development Cell, Government College of Engineering, Jalagon (M. S), India
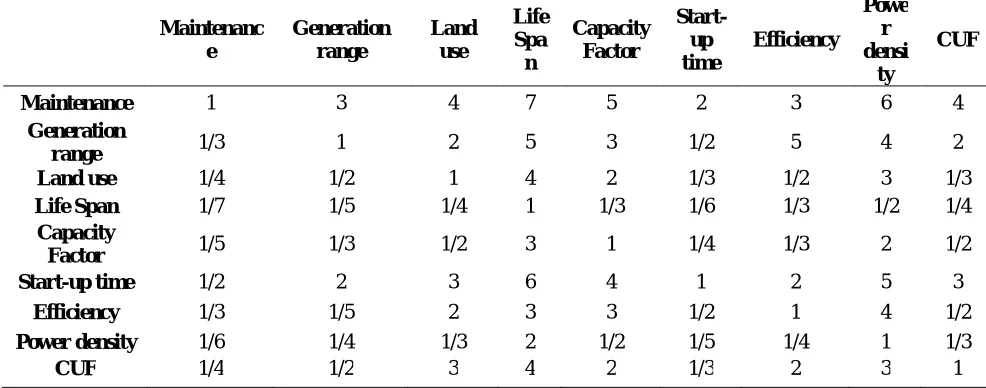
TABLE 10 Pairwise comparison of sub-attributes with respect to Operational and technical attributes
Maintenanc e Generation range Land use Life Spa n Capacity Factor Start-up time Efficiency Powe r densi ty CUF
Maintenance 1 3 4 7 5 2 3 6 4
Generation
range 1/3 1 2 5 3 1/2 5 4 2
Land use 1/4 1/2 1 4 2 1/3 1/2 3 1/3
Life Span 1/7 1/5 1/4 1 1/3 1/6 1/3 1/2 1/4 Capacity
Factor 1/5 1/3 1/2 3 1 1/4 1/3 2 1/2
Start-up time 1/2 2 3 6 4 1 2 5 3
Efficiency 1/3 1/5 2 3 3 1/2 1 4 1/2
Power density 1/6 1/4 1/3 2 1/2 1/5 1/4 1 1/3
CUF 1/4 1/2 3 4 2 1/3 2 3 1
TABLE 12: Pairwise relation of sub-attributes with respect to the economical attributes IC O & M EC FCT
IC 1 2 5 4
O&M 1/2 1 3 6
EC 1/5 1/3 1 2
FCT 1/4 1/6 1/2 1
IC=Investment Cost, O&M=Operational & Maintenance Cost, EC=Electricity Cost, FCT=Fuel Cost TABLE 11 Pairwise comparison of sub-attributes with respect to Maintenance attributes
Maintenanc e Generation range Land use Life Spa n Capacity Factor Start-up time Efficiency Powe r densi ty CUF
Maintenance 1 3 4 7 5 2 3 6 4
Generation
range 1/3 1 2 5 3 1/2 5 4 2
Land use 1/4 1/2 1 4 2 1/3 1/2 3 1/3
Life Span 1/7 1/5 1/4 1 1/3 1/6 1/3 1/2 1/4 Capacity
Factor 1/5 1/3 1/2 3 1 1/4 1/3 2 1/2
Start-up time 1/2 2 3 6 4 1 2 5 3
Efficiency 1/3 1/5 2 3 3 1/2 1 4 1/2
Power density 1/6 1/4 1/3 2 1/2 1/5 1/4 1 1/3
Research Development Cell, Government College of Engineering, Jalagon (M. S), India
TABLE 13: Pairwise relation of sub-attributes with respect to Investment Cost IC O & M EC FCT
IC 1 2 5 4
O&M 1/2 1 3 6
EC 1/5 1/3 1 2
FCT 1/4 1/6 1/2 1
Similarly, Table 14 &15 presents the pairwise relation of sub-attributes with respect to the environmental and social attributes based on the collected information; weights are selected to different sources on subject to discrete sub-attributes related to above mentioned sub-attributes from the AHP method are given to TOPSIS method and the priority to various energy technologies with respect to different kinds of sub-attributes obtained.
TABLE 14: Pairwise comparison of sub-attributes with respect to the environmental attributes SO2 NOX CO2 CO HC PM Noise
SO2 1 2 1/3 1/2 1/4 1/5 3 NOX 1/2 1 1/2 1/3 1/5 1/6 2 CO2 3 2 1 2 1/2 1/3 5 CO 2 3 1/2 1 1/3 1/4 4 HC 4 5 2 3 1 1/2 6 PM 5 6 3 4 2 1 7 Noise 1/3 1/2 1/5 1/4 1/6 1/7 1
TABLE 15: Pairwise relation of sub-attributes with respect to the Social attributes
SA RE WE
SA 1 2 5
RE 1/2 1 3
WE 1/5 1/3 1
SC=Social Acceptability, RE=Resource availability, WE=Work establishment
About tables
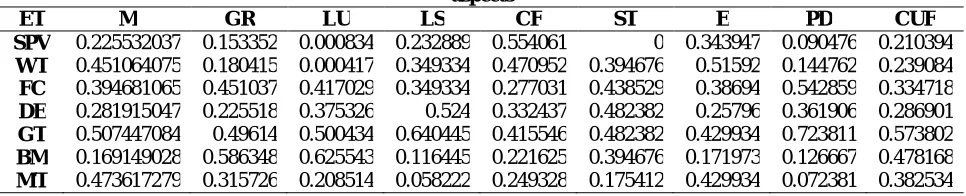
TABLE 12 Priority of various DG technologies and sub-attributes with respect to operational and technical aspects
ET M GR LU LS CF ST E PD CUF
SPV 0.225532037 0.153352 0.000834 0.232889 0.554061 0 0.343947 0.090476 0.210394 WT 0.451064075 0.180415 0.000417 0.349334 0.470952 0.394676 0.51592 0.144762 0.239084 FC 0.394681065 0.451037 0.417029 0.349334 0.277031 0.438529 0.38694 0.542859 0.334718 DE 0.281915047 0.225518 0.375326 0.524 0.332437 0.482382 0.25796 0.361906 0.286901 GT 0.507447084 0.49614 0.500434 0.640445 0.415546 0.482382 0.429934 0.723811 0.573802 BM 0.169149028 0.586348 0.625543 0.116445 0.221625 0.394676 0.171973 0.126667 0.478168 MT 0.473617279 0.315726 0.208514 0.058222 0.249328 0.175412 0.429934 0.072381 0.382534
ET=Energy Technologies, SPV=Solar PV, WT=Wind Turbine, FC=Fuel Cell, DE=Diesel Engine, GT=Gas Turbine, BM=Biomass, MT=Micro-Turbine, M=Maintenance (hr/yr), GR=Generation range, LU=Land Use (kW/m2), LS=Life
Research Development Cell, Government College of Engineering, Jalagon (M. S), India
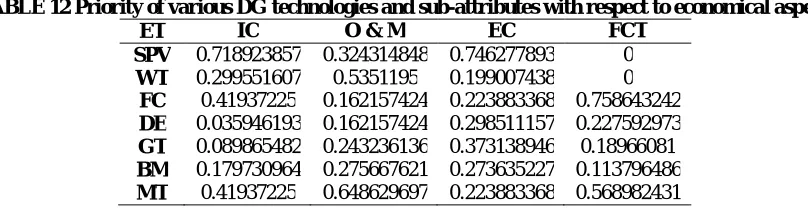
TABLE 12 Priority of various DG technologies and sub-attributes with respect to economical aspects ET IC O & M EC FCT
SPV 0.718923857 0.324314848 0.746277893 0 WT 0.299551607 0.5351195 0.199007438 0
FC 0.41937225 0.162157424 0.223883368 0.758643242 DE 0.035946193 0.162157424 0.298511157 0.227592973 GT 0.089865482 0.243236136 0.373138946 0.18966081 BM 0.179730964 0.275667621 0.273635227 0.113796486 MT 0.41937225 0.648629697 0.223883368 0.568982431
ET=Energy Technologies, SPV=Solar PV, WT=Wind Turbine, FC=Fuel Cell, DE=Diesel Engine, GT=Gas Turbine, BM=Biomass, MT=Micro-Turbine, IC=Investment Cost, O&M=Operational & Maintenance Cost, EC=Electricity
Cost, FCT=Fuel Cost, P=Priority
About Zones
Land usage contributes various socioeconomic benefits, but usually appears at significant cost for the environment. Despite major economic costs will be estimated into decisions with land use, maximum environmental levels are not. These environmental level matters diversities among different costs for a few land uses which are prominent to an ineffective land allocation. For example, Planners may not take all the infrastructural and environmental payment generated by their projects. Province yields the pair of open area and agricultural commodities. Although labors will be rewarded for the assets they produce and are not allowed to be refunded for the free zone. Private dependence and nonprofit systems will have more important preference in land conservation.
The Operation of locally based, long-term maintenance and management suggestions has been promoted as a demanding aspect in attaining smart growth. The enticement based way has discrete choice in the explicit land usage control. In the position where the human and natural procedures collaborate in a complex manner, brink and nonlinear act are feasible to continue and the environmental expenditures will have hike and tricky to further development of zoning would be favorable. The administration challenge is to recognize when the scheme among neighborhood of alike brink. A few regional authorities have made rules and other done with outlining and regulation of new distributed energy sources. All regulation is an antagonistic problem in more associations, specifically which are facing more particularly those facing expeditious urbanization and many proponents argue are made to increase in planning protests and the increment of property expenses. Conversely, undisciplined development will wipe out the essential environment, social attributes and long term economic growth. Critics of new distributed energy sources, supervision command those anxieties disproportionate . They disagree that development of urban is a formal market case that apportions new distributed energy sources, and authority favour to up the regulation because they hardly take the regulation cost. A few policy quotas that desires at control of development in urban areas will ultimately changes the basic aspect of the Tamil Nadu. Policymakers must prevent the appealing for aspects for all irregular distributed energy sources, arrangements to market decline and appoint demanding settlements that may block the activities function of market strengths. Policymakers should crack to determine the energy sources for market decline that cause the desirable development and location complication at their background. A new distributed energy sources, management must drive equity between public private activity and worth.
VII. CONCLUSION
Research Development Cell, Government College of Engineering, Jalagon (M. S), India
technologies in each of the regions of Tamil Nadu. The model developed is stretched to hold the changes in the weight as per the needs and circumstances of attributes.
REFERENCES
[1] Mardani, A.; Jusoh, A.; Zavadskas, E.K.; Cavallaro, F.; Khalifah, Z. Sustainable and Renewable Energy: An Overview of the Application of Multiple Criteria Decision Making Techniques and Approaches. Sustainability 2015, 7, 13947–13984.
[2] Quijano, H.R.; Botero, B.S.; Domínguez, B.J. MODERGIS application: Integrated simulation platform to promote and develop renewable sustainable energy plans, Colombian case study. Renew. Sustain. Energy Rev. 2012, 16, 5176–5187.
[3] Tzeng, G.-H.; Tsaur, S.-H.; Laiw, Y.-D.; Opricovic, S. Multicriteria analysis of environmental quality in Taipei: Public preferences and improvement strategies. J. Environ. Manag. 2002, 65, 109–120.
[4] Martin-Utrillas, M.; Juan-Garcia, F.; Canto-Perello, J.; Curiel-Esparza, J. Optimal infrastructure selection to boost regional sustainable economy. Int. J. Sustain. Dev. World Ecol. 2015, 22, 30–38.
[5] Yazdani-Chamzini, A.; Fouladgar, M.M.; Zavadskas, E.K.; Moini, S.H.H. Selecting the optimal renewable energy using multi criteria decision
making. J. Bus. Econ. Manag. 2013, 14, 957–978.
[6] Ren, J.; Manzardo, A.; Mazzi, A.; Zuliani, F.; Scipioni, A. Prioritization of bioethanol production pathways in China based on life cycle sustainability assessment and multicriteria decision-making. Int. J. Life Cycle Assess. 2015, 20, 842–853.
[7] Civic, A.; Vucijak, B. Multi-criteria Optimization of Insulation Options for Warmth of Buildings to Increase Energy Efficiency. Procedia Eng. 2014, 69, 911–920.
[8] Kim, Y.; Chung, E.-S. Fuzzy VIKOR approach for assessing the vulnerability of the water supply to climate change and variability in South Korea. Appl. Math. Model. 2013, 37, 9419–9430.
[9] Zavadskas, E.K.; Turskis, Z.; Kildiene, S. State of art surveys of overviews on MCDM/MADM methods. ˙ Technol. Econ. Dev. Econ. 2014, 20, 165–179.
[10] Kahraman, C.; Çebi, S. A new multi-attribute decision making method: Hierarchical fuzzy axiomatic design. Expert Syst. Appl. 2009, 36 (Part 1), 4848–4861.
[11] Wiecek, M.M.; Ehrgott, M.; Fadel, G.; Rui Figueira, J. Multiple criteria decision making for engineering. Omega 2008, 36, 337–339
[12] Mardani, A.; Jusoh, A.; Zavadskas, E.K. Fuzzy multiple criteria decision-making techniques and applications—Two decades review from 1994
to 2014. Expert Syst. Appl. 2015, 42, 4126–4148.
[13] Mardani, A.; Jusoh, A.; Md Nor, K.; Khalifah, Z.; Zakwan, N.; Valipour, A. Multiple criteria decision-making techniques and their applications—A review of the literature from 2000 to 2014. Econ. Res. Ekon. Istraž. 2015, 28, 516–571.
[14] Keeney, R.L.; Raiffa, H.; Rajala, D.W. Decisions with multiple objectives: Preferences and value trade-offs. IEEE Trans. Syst. Man Cybern. 1979, 9, 403–403.
[15] Hwang, C.-L.; Masud, A.S.M.; Paidy, S.R.; Yoon, K.P. Multiple Objective Decision Making, Methods and Applications: A State-of-the-Art Survey; Springer: Berlin, Germany, 1979; p. 164.
[16] Tzeng, G.-H.; Huang, J.-J. Multiple Attribute Decision Making: Methods and Applications; CRC Press: Boca Raton, FL, USA, 2011.
[17] Mardani, A.; Jusoh, A.; Zavadskas, E.K.; Khalifah, Z.; Nor, K.M. Application of multiple-criteria decision-making techniques and approaches to evaluating of service quality: A systematic review of the literature. J. Bus. Econ. Manag. 2015, 16, 1034–1068.
[18] Saaty, T.L. The Analytic Hierarchy Process: Planning, Priority Setting, Resources Allocation; McGraw-Hill: New York, NY, USA, 1980. 23.
Zeleny, M.; Cochrane, J.L. Multiple Criteria Decision Making; McGraw-Hill: New York, NY, USA, 1982; Volume 25. [19] Hwang, C.-L.; Lin, M.-J. Group Decision Making under Multiple Criteria; Springer: Berlin, Germany, 1987.
[20] Roy, B. Multicriteria Methodology for Decision Aiding; Springer: Berlin, Germany, 1996; p. 12.
[21] Belton, V.; Stewart, T. Multiple Criteria Decision Analysis: An Integrated Approach; Springer: Berlin, Germany, 2002.
[22] Gal, T.; Stewart, T.; Hanne, T. Multicriteria Decision Making: Advances in MCDM Models, Algorithms, Theory, and Applications; Da Capo
Press: Cambridge, MA, USA, 1999; p. 21.
[23] T.L. Saaty : Rank generation, preservation and reversal in the Analytic Hierarchy Process" Decis. SCI. (1987)
[24] F. Zahedi :The Analytic Hierarchy Process—a survey of the method and its applications, Interfaces , 16 (4) (1986), pp. 96–108