HIGHLIGHTED ARTICLE
| INVESTIGATION
Mutational Pleiotropy and the Strength of Stabilizing
Selection Within and Between Functional Modules of
Gene Expression
Julie M. Collet,1,2Katrina McGuigan, Scott L. Allen, Stephen F. Chenoweth, and Mark W. Blows
School of Biological Sciences, The University of Queensland, Brisbane 4072, Queensland, Australia ORCID ID: 0000-0002-6028-5234 (J.M.C.)
ABSTRACTVariational modules, sets of pleiotropically covarying traits, affect phenotypic evolution, and therefore are predicted to
reflect functional modules, such that traits within a variational module also share a common function. Such an alignment of function and pleiotropy is expected to facilitate adaptation by reducing the deleterious effects of mutations, and by allowing coordinated evolution of functionally related sets of traits. Here, we adopt a high-dimensional quantitative genetic approach using a large number of gene expression traits inDrosophila serratato test whether functional grouping, defined by gene ontology (GO terms), predicts variational modules. Mutational or standing genetic covariance was significantly greater than among randomly grouped sets of genes for 38% of our functional groups, indicating that GO terms can predict variational modularity to some extent. We estimated stabilizing selection acting on mutational covariance to test the prediction that functional pleiotropy would result in reduced deleterious effects of mutations within functional modules. Stabilizing selection within functional modules was weaker than that acting on randomly grouped sets of genes in only 23% of functional groups, indicating that functional alignment can reduce deleterious effects of pleiotropic mutation but typically does not. Our analyses also revealed the presence of variational modules that spanned multiple functions.
KEYWORDSmodularity; pleiotropy; genotype–phenotype map;Drosophila serrata; gene expression
P
LEIOTROPY has the potential to generate substantial evolutionary costs that scale with the number of traits affected by each mutation. Assuming a mutation has the same magnitude effect on each trait, the probability that a mutation will be favorable decreases as the number of traits (n) infl u-enced by a mutation increases (Fisher 1930). Under the as-sumption of universal pleiotropy, the rate of adaptation may also decline by a factor of n21(Orr 2000). Modularity hasbeen proposed as a mechanism to reduce such potential costs of organismal complexity (Wagner 1996). Variational mod-ules occur when phenotypic traits share genetic variance through pleiotropy, while displaying lower covariation with
traits belonging to different variational modules (Wagner 1996; Schlosser and Wagner 2004; Wagneret al.2007). In-dependently, functional modularity describes an architecture where traits within a functional module share a common function (Wagneret al.2007), which implies that the effects onfitness of a trait depend on the other traits contained in its functional module. Functional integration is predicted to se-lect for variational modularity because: (i) variational mod-ularity reduces the range of effects of deleterious mutations, as mutations would only affect the traits belonging to the targeted functional module rather than the entire organism; (ii) all traits of a module can respond to natural selection as a unit; and (iii) it preserves the module’s function during evolutionary change (Olson and Miller 1958; Wagner and Altenberg 1996; Wagner and Mezey 2004). Several different approaches to theoretical modeling have determined that co-incidence of functional and variational modules can indeed promote adaptation under some conditions (Welch and Waxman 2003; Griswold 2006; Pavlicev and Hansen 2011; Melo and Marroig 2015).
Copyright © 2018 by the Genetics Society of America doi:https://doi.org/10.1534/genetics.118.300776
Manuscript received March 23, 2017; accepted for publication January 30, 2018; published Early Online January 31, 2018.
Supplemental material is available online atwww.genetics.org/lookup/suppl/doi:10. 1534/genetics.118.300776/-/DC1.
1Corresponding author: E-mail: [email protected]
2Present address: Centre de Biologie pour la Gestion des Populations, INRA, CIRAD,
Despite the intuitive, and theoretically supported, poten-tial evolutionary benefits of variational modules coinciding with functional modules, it is difficult to establish empirically whether functionally related sets of traits correspond to var-iational modules. Macroevolutionary approaches can identify evolutionary modules (sets of traits that can potentially evolve independently of other such sets) as groups of genes with conserved physical proximity, cooccurrence in the genome, or fused genes. If variational modules help preserve functional modules, selection will favor the conservation of those mod-ules and thus evolutionary modmod-ules are also expected to coincide with functional modules (Cheverud 1984). Compar-ative genomic analyses of functional modules have provided some evidence that evolutionary modules are, overall, more stable between genes that interact functionally than between unrelated genes, although there are large discrepancies be-tween modules and some functions are more conserved than others (Snel and Huynen 2004; Spirinet al.2006; Peregrin-Alvarezet al.2009; Moreno-Hagelsieb and Jokic 2012). Evo-lutionary preservation of functional modules may also cause differential rates of gene sequence evolution between func-tional modules. Consistent with this, Chen and Dokholyan (2006) reported that, in yeast, protein sequences and expres-sion levels within functional modules evolve at more similar rates than between modules.
Coordinated selection that operates on functional interre-lationships of traits can preserve functional modules among taxa. By comparing the topologic structure of metabolic net-works among species and the environment where they live, it was found that metabolic network modularity varies with environmental conditions in bacteria (Parter et al. 2007; Kreimeret al.2008), archae (Takemoto and Borjigin 2011), and across archae, bacteria, and eukarya (Mazurie et al. 2010), consistent with the role of natural selection in shaping variational relationships between traits belonging to func-tional modules (note that results using metabolic network modularity should be taken with care as the same modularity scores can be obtained with very different metabolic network structures; Zhou and Nakhleh 2012). The preservation of interactions between traits belonging to functional modules might also reflect a bias in the variation generated by muta-tion. However, potential biases in mutation rates within mod-ules, and how mutation can contribute to maintaining the organization of functional modules, remain little explored.
Microevolutionary studies within species offer the oppor-tunity to directly determine the distribution of phenotypic effects of new mutations and selection on these mutations. Identifying variational modules requires the study of many traits belonging to diverse functional modules. Morphological studies, for example, have limited use for testing the key hypothesis: statistical tests for lower covariance outside the module are relatively weak because only relationships among similar types of traits (morphology) are considered, and co-variance between morphological and behavioral or physio-logical traits, which might contribute to a common function, are not considered. Systems biology, which involves a shift in
focus from the function of individual genes in isolation to the interaction among gene products to achieve a biological func-tion (Ideker et al. 2001; Kitano 2002; Civelek and Lusis 2014), has provided the tools to study modularity across di-verse functional modules. Work in model organisms has em-pirically revealed the function and functional interactions of thousands of genes, valuable information that can be applied to nonmodel taxa through tools such as the database of The Gene Ontology (GO) Consortium (Ashburneret al.2000) and the Kyoto Encyclopedia of Genes and Genomes (KEGG) path-way resources (Kanehisaet al.2006).
Gene expression data allow questions about the distribu-tion of variadistribu-tional and funcdistribu-tional modules to be asked while considering a diverse range of biological functions. The de-velopment of high-throughput methods for the simultaneous measurement of the expression of thousands of genes has led to statistical developments allowing the identification of clus-ters of coexpressed genes (e.g., Eisenet al.1998; D’haeseleer et al.2000; Tanay et al.2002). When gene expression has been measured within a quantitative genetic breeding de-sign, high levels of covariance among expression traits have been found, which imply the existence of variational modules (Denveret al.2005; Rifkinet al.2005; Ayroleset al.2009; Blowset al.2015). Many studies have subsequently applied enrichment analyses to determine whether coexpressed genes were associated with the same GO terms more often than expected by chance (e.g., Ayroleset al.2009; Blowset al. 2015; Roseet al.2015; Storzet al.2015). Although it appears from these studies that variational modules can predict func-tional group membership to some extent, it is unknown what proportion of pleiotropic covariance resides within
prede-fined functional groups, and whether pleiotropic covariance among functional groups is of a similar magnitude to that found within functional groups. Further, the role of selection in generating these variation modules remains relatively unexplored.
pleiotropic mutations that spanned a larger array of func-tions. In addition to directly testing whether pleiotropic effects were stronger within functional modules, our experi-mental design (specifically the matched estimates of muta-tional and standing genetic variance) allowed us to directly estimate the strength of stabilizing selection acting against function-specific mutational pleiotropy and compare it to selection against mutational pleiotropy spanning multiple functions.
Materials and Methods
Experimental populations and data collection
We used two sets of highly inbred lines ofD. serrata, which were established, maintained, and assayed in a similar way (McGuigan et al. 2014a), to measure the mutational and standing genetic covariance in sets of gene expression traits assigned to functional groups. Briefly, thefirst set of lines consisted of 45 M lines derived from a single inbred ancestral population. Each M line was maintained during 27 genera-tions through full-sib inbreeding. The second set of 42 lines were derived from females collected from a wild outbred population and inbred for 15 generations of full-sib mating (G lines). As M lines were founded from a population depleted of standing genetic variance, the differences among M lines originated from mutations,filtered by relaxed selection, and M lines captured mutational variance. On the other hand, the differences among G lines originated from the natural standing genetic variance captured in the original outbred population; hence, the G lines captured standing ge-netic variance. We neglected the contribution of new muta-tions accumulated in the G lines because, as determined from the M lines, mutational variance is small relative to standing genetic variance (Table 1).
In generation 26 in the M lines and generation 14 in the G lines, we set up four replicate vials per M line and three replicate vials per G line in preparation for RNA extraction in the following generation. From these vials, 40 (M) and 60 (G) virgin male offspring were collected for each line. The use of replicate vials for each line ensured that microenviron-mental variation was not confounded with the among-line (mutational or genetic) variation. Males were held in groups offive until 3 (G lines) or 4 (M lines) days after emergence, when two RNA extractions on a subsample of 20 (M lines) or 30 (G lines) males were conducted. Given the scope of this study (ratio of variance between the two treatments compared between functions and within functions), we do not expect any of these small discrepancies in handling the two sets of lines to have impacted our results. Flies were snap-frozen using liquid nitrogen; total RNA was extracted using TRIzol (Invitrogen, Carlsbad, CA) and purified using RNeasy kits (QIAGEN, Valencia, CA), all according to the manufacturers’ instructions.
As detailed in Allen et al. (2013) and McGuigan et al. (2014b), microarrays designed from aD. serrataexpressed
sequence tag (EST) library (Frentiuet al.2009) were manu-factured by NimbleGen (Roche); cDNA synthesis, labeling, hybridization, and microarray scanning (NimbleScan) were performed by the Centre for Genomics and Bioinformatics, Bloomington, Indiana. Microarrays contained 20K random probes plus 11,604 features from ESTs, targeted by five 60-mer oligonucleotide probes; each probe appeared twice on each array. A single sample was hybridized to each array with a single color (Cy-3). Twelve arrays appeared on each slide, and samples were randomly assigned to a slide. We performed quality control analyses with the oligo package in Bioconductor (Gentlemanet al.2005) and removed data due to poor quality or high background signal. The expres-sion data for the 41 M lines and 30 G lines remaining after this process are analyzed below, and are available through the National Center for Biotechnology Information (NCBI)’s Gene Expression Omnibus (GEO) (Edgaret al.2002; Barrett et al.2011) (M: GSE49815 and G: GSE45801).
To determine which of the 11,604 phenotypes on each microarray were associated with mutational or standing ge-netic variation, and therefore informative for analysis of variational and functional modules, we use linear mixed model analyses to partition the variance in each expression trait. First, a linear mixed model to characterize the muta-tional variance in the standardized (mean = 0 and SD = 1) log10mean expression of each probe (McGuiganet al.2014b)
was implemented within a Restricted Maximum-Likelihood framework using the function lme in R 3.1.2 (library nlme; Pinheiro and Bates 2000):
Yijk¼mþSFþLineiþRepjðiÞþeijk (1)
where SF was afixed effect for a segregating factor observed in the M lines that must have been present in the ancestor and was therefore not a product of mutation during the ex-periment [see supporting information in McGuigan et al. (2014b)]. To prevent this factor from contributing to esti-mates of mutational (among-line) variance, we added afixed effect to remove the mean difference in trait expression be-tween the two groups of lines with the alternative forms of this segregating factor. Line was a random factor representing the among M line variance, Rep was a random factor nested within lines representing the two replicate extractions per line, and the residual error, e, was the variance among the
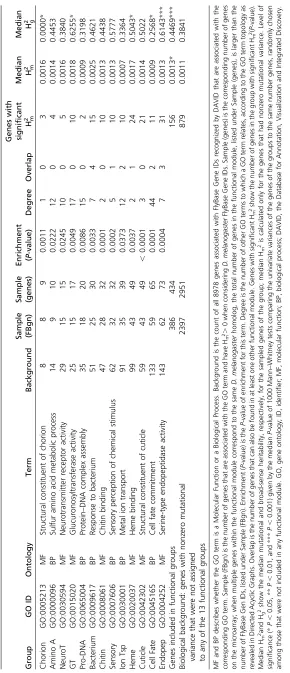
Table 1 Des cription of the 13 selec ted fu nctiona l m o dules Grou p G O ID Ontolo gy Term Bac kground Samp le (FBgn) Sam ple (gene s) Enric hment ( P -va lue) Degre e Overla p G enes with sign i fi ca nt H 2 m Med ian H 2 m Media n H 2 g Chori on GO:0005213 MF Str uctural const ituent of chor ion 8 8 9 0.0011 1 0 3 0.0016 0.0000 * Amino A GO:0000096 BP Sulf ur amino acid metab olic proc ess 14 9 1 0 0.0222 12 0 4 0.0014 0.4453 Neur oT GO:0030594 MF Ne urot ransmitter rec eptor activi ty 29 15 15 0.0245 10 0 5 0.0016 0.3840 GT GO:0015020 MF G lucuron osyltransfera se activi ty 25 15 17 0.0049 17 0 1 0 0.0018 0.6255 * Pro-DNA GO:0065004 BP Pro tein – DNA co mplex assem bly 35 18 20 0.0086 15 0 2 0.0009 0.3198 Bacte rium GO:0009617 BP Res pons e to bacte rium 51 25 30 0.0033 7 4 15 0.0025 0.4621 Chitin GO:0008061 MF Ch itin bindi ng 47 28 32 0.0001 2 0 10 0.0013 0.4438 Sensor y GO:0007606 BP Sen sory per ceptio n o f chem ical stimulus 62 32 32 0.0002 5 1 10 0.0013 0.5777 Ion Tsp GO:0030001 BP Met al ion transpo rt 91 35 39 0.0373 12 2 1 0 0.0007 0.3364 Heme GO:0020037 MF He me binding 99 43 49 0.0037 2 1 24 0.0017 0.5043 * Cuticle GO:0042302 MF Str uctural const ituent of cuticle 59 43 49 , 0.0001 3 0 21 0.0014 0.5022 Cell Fate GO:0045165 BP Ce ll fate comm itment 133 59 65 0.0001 44 2 1 1 0.0009 0.2568 * Endo pep GO:0004252 MF Serin e-typ e endo peptid ase activi ty 143 62 73 0.0004 7 3 31 0.0013 0.6143 *** Gene s inclu ded in func tional groups 386 434 156 0.0013 * 0.4469 *** Biologic al backg round: gen es with nonz ero mutational var iance that wer e n o t assig ned to any of the 13 function al gr oups 2397 29 51 879 0.0011 0.3841 MF and B P describes whether the G O term is a Molecular Function or a B iological Process. Background is the count of all 8978 genes a ssociated w ith FlyBas e G ene IDs recognized b y DAVID that are associated w ith the corresponding G O term. S ample (FBgn) is the number o f g enes that are associated with the G O term and h ave Hm 2. 0 when considering D. melanogaster FlyBase G ene IDs. S ample (genes) is the corresponding number of genes on the m icroarray; when multiple genes within the functional module correspond to the same D. melanogaster homolog, the total number o f genes in the functional module, listed under Sample (genes), is larger than the number o f FlyBase Gen IDs, listed under Sample (FBgn). E nrichment ( P -value) is the P -value o f e nrichment for this term. D egree is the number of other G O terms to which a G O term relates, according to the G O term topology as revealed in Directed Acyclic Graphs. O verlap is the number o f genes that can also be found in at least one o ther functional module. Genes with signi fi cant Hm 2show the number o f g enes in the g roup with signi fi cant Hm 2(P
threshold, particularly in large data sets, is prone to limit the detection of pleiotropy (Hill and Zhang 2012). We did not wish effect size and subsequent type II error to affect the interpretation of our measure of function-specific pleiotropy. Therefore, we selected the entire subsample of 3385 genes showing nonzero mutational variance for further consider-ation. Second, the analysis of the G lines to estimate the standing genetic variance in each of the 3385 expression traits with nonzero mutational variance followed the same model but removed the segregating factor effect. As we de-tected consistent differences in mean signal intensity among thefive replicate probes of each gene in the G lines, we in-cluded afixed effect for probe when analyzing the G lines (McGuiganet al.2014b).
EST annotation
To establish the function of the genes present on our micro-arrays, D. serrata ESTs were first classified as putative D. melanogaster homologs. D. melanogaster was chosen as the reference as it is a relatively well-annotated model organ-ism that has been incorporated into many analysis tools. Ho-molog identifiers (IDs) were assigned following basic local alignment search tool (BLAST) analysis of the D. serrata ESTs against 12Drosophilaspecies’genomes obtained from FlyBase (McQuiltonet al.2012) followed by mapping of the FlyBase gene IDs to homolog IDs from the ortholog database (Waterhouse et al. 2013), which allowed us to identify D. melanogasterhomologs of theD. serratagenes even when they had a BLAST hit to a gene in a taxon other than D. melanogaster. The D. melanogaster gene’s annotations were then assigned to the D. serratagene and used for en-richment analysis. To allow for highly divergent homologs to be identified, tblastx with a liberal e-value threshold of 10 was applied; mediane-value was 1e278. The method
iden-tified 10,843 (93%) genes on the microarray as homologs of 9500D. melanogastergenes. For some genes, severalD. serrata ESTs corresponded to a uniqueD. melanogasterhomolog and we established that thoseD. serratagenes could be consid-ered as independent (see Supplemental Material, Supple-mental Information and Table S1 inFile S1).
Enrichment analyses and identification of functional groups
We restricted our investigation of potential GO functions to those functional groups that were the best candidates to harbor function-specific mutational variance. If a functional group experienced a function-specific pleiotropic mutation, several (or perhaps all) of the genes that are part of that function will each exhibit univariate mutational variance. Therefore, we performed GO term and KEGG pathway enrichment analyses that detected functional groups within the 3385 genes potentially affected by mutations (nonzero mutational variance) compared to all 11,604 genes contained on the microarray. Of the 3385 variable genes, 2783 were identified as unique D. melanogaster homologs, of which 2604 were assigned a gene ID using DAVID 6.7 (Huang
et al.2009). Of the 9500 genes contained on the microarray that were assigned a uniqueD.melanogastergene ID from FlyBase genes, 8978 were recognized and assigned an ID in DAVID. Therefore, we were able to apply the enrichment analysis to 2604 genes of interest (i.e., mutationally variable candidates for functional groups) against the reference back-ground containing 8978 genes.
We did not consider enrichment on Cellular Component GO domain for two reasons. First, our goal in this paper was to identify functional modules for which we had the greatest expectation of correspondence to pleiotropic variational mod-ules, and while both Biological Process and Molecular Func-tion domains are likely to capture multiple funcFunc-tions of a single gene (He and Zhang 2006; Suet al.2010), colocaliza-tion of gene products has a less direct link to definitions of pleiotropy. Second, gene groups identified through the Cellular Component GO domain might be more likely to be affected by Pearson’s rule of neighborhood, where geograph-ically closer elements are more likely to be correlated than distant elements (Whiteley and Pearson 1899), which is a known source of bias in interpretations of coincidence of functional and variational modules at the phenotypic level (Mitteroecker 2009). Therefore, we only looked for enrich-ment in Biological Process and Molecular Function in the GO terms, and analyzed the list for GO terms and KEGG path-ways with the“Functional Annotation Chart.”
processes (three groups), developmental processes (two groups), responses to stimulus (two groups), or binding (two groups) (Table 1). However, one of the 14 identified groups failed a randomization test to determine if the observed mu-tational covariance was above the random expectation when the mutational covariance among traits was destroyed (see Supplemental Information inFile S1). We removed this group from further analysis. We further identified two independent significantly enriched KEGG pathways, but they identified the same putative functional modules as identified by the GO term enrichment analysis, and we only report GO term results here (see Supplemental Information inFile S1).
We tested whether the 434 genes assigned to the 13 func-tional groups were a representative sample of the mutafunc-tional and standing genetic variance found in the entire set of mutationally variable genes. For each functional group, we used Wilcoxon signed-rank tests to compare the mutational and standing genetic variance of the genes contained within that group to 1000 sets of the same number of genes, randomly chosen from the 2951 genes with nonzero mutational variance that were not assigned to any of our 13 studied functional groups.
Mutational and standing genetic covariance within functional groups
We determined the genetic covariance between each pair of expression traits using bivariate models within each func-tional group of genes in both the M and G lines separately. For each pair of genes within a functional group, we imple-mented the bivariate form of the model (1):
Y ¼ mþZldlþZrdrþe (2)
whereZlandZrare design matrices for the line and replicate within-line random effects. We modeled the covariance structure among traits at the line (dl) and replicate (dr) lev-els, using unstructured 232 covariance matrices, andewas a diagonal matrix containing the residual (among-probe) variances for each trait. The segregating factor and a probe-levelfixed effect were included as before for the M line and G line analyses, respectively.
For each functional group, we used the among-Line uni-variate variance component (model 1) and covariance compo-nent (model 2) from the respective M and G lines to construct mutational (M) and genetic (G) variance–covariance matrices. Constructing theMandGmatrices enabled us to test for the presence of shared genetic variance in any multivariate trait combination (not just pairwise combinations) in the most
ef-ficient fashion, by focusing on the presence of mutational or genetic variance in the major axes represented by the domi-nant eigenvectors of the respective matrices of each functional group.
Our goal was to detect whether the levels of mutational and standing genetic covariance found in our candidate functional groups were specific to that function, and exceeded the typical levels of mutational and standing genetic covariance found in
traits that were not identified by the enrichment analysis as sharing the same function. To achieve this, we compared the mutational or genetic variance in the dominant eigenvectors of a matrix (mmaxandm2for mutational variance, andgmax and g2 for standing genetic variance; Table 2) of a given functional group, to the observed eigenvalues of a distribu-tion of eigenvalues that represented biological variadistribu-tion char-acterized by the background level of mutational or genetic covariance among random sets of genes. We first created 150 data sets of 73 genes that were sampled at random from the subset of 2951 genes that showed mutational variance but were not assigned to any of the 13 functional groups under consideration. We did not know the functions of the genes included in these data sets. Thus, some of the genes included in each data set may share a common function, but it was unlikely that they all had the same function. Moreover, none of the genes included in those data sets were assigned to any of the GO terms in Table 1. Sampling was done with replacement, so that some genes were included in several of the 150 data sets. For each of the 150 created data sets, we estimatedMbbandGbbcovariance matrices (Table 2) by applying the univariate (model 1) and bivariate (model 2) mixed models, as described above. To obtain Mbb andGbb covariance matrices of a size that matched each functional group (i.e., the number of genes in each functional group, Table 1), we randomly selected the number of genes required for each functional group from the 73 genes in each data set. Each draw of the appropriate number of genes was sampled from the set of 73 genes with replacement, creating random overlap between biological simulations of the 13 functional groups. The functional groups of the same size (groups Chitin and Sensory, and groups Heme and Cuticle) were compared to the same sample of biological background genes. A small number (seven) of the 23150 = 300MbbandGbb covari-ance matrices estimated in this fashion returned extreme out-lying eigenvalues (. 1010) after diagonalization, and we
removed these data sets, resulting in 143 estimates of the biological background covariance in the M and G lines for each functional group. Because several functional groups had average univariate genetic variances that were signifi -cantly higher than the genes that were not selected in any functional groups (Table 1), we could not directly compare the shared genetic variance contained in those functional groups with the biological controls. Instead, we compared the proportion of variance represented by each eigenvector, calculated by dividing each eigenvalue by the trace of the matrix, to the 95% C.I. of the proportion of variance for each vector obtained from the biological controls. This comparison was used to determine whether the genetic covariance found within functional groups was larger than among background (random) genes, independent of the level of genetic variance displayed by each gene.
Selection on pleiotropic effects within functional groups
deleterious mutation through restricting the extent of their pleiotropic effects. We would therefore predict that selection on the genetic variance within functional groups should be weaker than selection among groups. We tested this predic-tion using two approaches. First, we estimateds, the selection coefficient, from our estimates of the mutational variance and standing genetic variance for gene expression, using: s¼VM=V
G (Barton 1990; Houle et al. 1996). Specifically, we calculatedsfor the multivariate traitsmmaxandm2using:
s ¼ lmn=54
mT
n G mn (3)
where lmnwas the eigenvalue of the nth eigenvector of M divided by twice the number of generations to give the per-generation input of variance (Lynch and Walsh 1998) and
mT
n G mn represents the projection of the normalized mn vector through the standing genetic space ofG. To returns to the original log10scale, we multiplied it by the ratio of
phenotypic variances ofmnin the G and M lines. To do this, we used the linear equation of each of themneigenvectors to generate phenotypic scores in both M and G lines. We kept the probe level of information by applying the linear equation of the eigenvectors five times; each of the five times, we randomly chose one of thefive probes that targeted each trait (without replacement). We analyzed these phenotypic trait scores for themnindex with model (1) to estimate the phe-notypic variance associated with eachmn trait combination in the M and G lines. We repeated the same analyses for
the groups of genes in the biological background. In three (out of 26) estimates for the two vectors in the observed data for the 13 functional groups, the calculation of s returned negative values, asmnfell within the null space of the esti-matedGmatrix. In these three cases, we bentGusing nearPD (library Matrix, R 3.1.2) to obtain the closest positive definite matrix.
To directly estimate the amount of sampling error associ-ated with the estimates of mutational and genetic variance in s, it is necessary to take into account that the estimation ofs can be inflated as a result of restricted maximum likelihood enforcing positive-definite constraints. To account for this upward bias, we applied equation (3) to random pairs of the 50 estimates of Mse andGse for each functional group representing the amount of sampling error generated by our experimental design for a given module size (see Supplemen-tal Information inFile S1and Table 2). We then used these 50 estimates of s representing sampling error to remove the magnitude of the inflating effect in our observed estimate ofsby taking the difference between the observed estimate and the median of these 50 estimates of sampling error (McGuiganet al.2014a).
To estimate the 95% C.I.s of s based on the biological background, we used the difference between the 143 ob-served biological background estimates and the correspond-ing median samplcorrespond-ing error estimate obtained for each function-specific group. Since the univariate estimates of mu-tational and genetic variance in the functional groups were on average higher than in genes included in the biological
Table 2 Definitions of the used mathematical terms
Name Quantifies
Number of data
sets/permutations Description
Terms describing experimental variances
mmaxorgmaxm2or g2 Eigenvectors of most (max) and second most (2) mutational (m) and genetic (g) variance
Estimated by diagonalizing the respectiveMorG
matrix
M26G26 Mutational (M) or standing genetic (G) covariance among functional groups
Phenotypic scores were estimated for individuals for the trait combinations
described by thefirst and second major axes of within-function mutational or standing genetic variance for each of the 13 functional groups (i.e., 26 traits). These scores were then analyzed as per observed traits to estimate the 26 trait variance covariance matrix, which was then diagonalized. Terms used to build distributions used in estimating C.I.s
MseGse Sampling error within the mutational (M) or standing genetic (G) data sets
50 Data shuffled among lines, disrupting the mutational or genetic covariances between traits while retaining the observed levels of variance for each individual gene expression trait
MbbGbb Biological background levels of mutational (M) or standing genetic (G) covariance among genes for which there is noa priori expectation of functional relatedness
143 Uses random sets of genes taken from the list of genes that were not assigned to one of the 14 functional groups. Each of the 117 data sets was then subsampled to the same number of genes as in the respective functional group.
M26seG26se Sampling error within the among functional group mutational (M26) or standing genetic (G26) covariance matrices
background (Table 1), the C.I.s for the biological background could be biased if the observed ratio of tr(M)/tr(G) for a group differs from the set of 143 biological background esti-mates. For two groups (Chorion and Cuticle), the observed tr(M)/tr(G) was higher than the biological background. In both cases, the lower and upper 95% C.I.s for these estimates are therefore likely to be smaller in magnitude than would occur if the traces of the observed matrices matched the traces of the matrices for the biological background (as shown by the negative lower confidence interval obtained in Chorion). Therefore, for those two groups, a lower ob-served estimate of selection than the C.I. would be a conser-vative result.
As described above, estimates ofsare only informative of selection operating on the major axes of mutation, but selec-tion may act instead on other dimensions. We therefore took a second approach to test the hypothesis that mutations act-ing within a functional group were under weaker selection than mutations affecting functionally unrelated sets of traits. We determined the level of overlap betweenM andG ma-trices using Krzanowski’s common subspaces approach (Krzanowski 1979; Aguirreet al.2014):
S ¼ ATB BTA (4)
whereAandBcontain the twofirst eigenvectors ofMandG as columns, respectively. The sum of the eigenvalues of the resultant matrixSthen ranges between 0 (complete orthog-onality of the subspaces) and 2 (coincident subspaces). If selection is weak,Gis not predicted to have diverged from the structure generated by mutation, and a big overlap be-tweenMandGsubspaces, and thus a higherS, is expected. This approach to estimating selection does not assume that it acts directly on the eigenvectors of M, but rather on any combination of expression traits contained within the first two dimensions ofM orG. Note that the upper and lower 95% random values of the sum of the eigenvalues ofS de-crease with the size of the groups. Since we only considered the twofirst axes whatever the size of the group considered, it is expected that the proportion of the common subspace shared between two matrices in those two axes will be lower when those axes represent a smaller proportion of the total subspace.
Data availability
Data are archived at the NCBI’s GEO (N lines: GSE49815 and S lines: GSE54777).
Results
Mutational and standing genetic variance in genes included in functional groups
The enrichment analysis of the 3385 genes showing nonzero mutational variance identified 13 independent candidate GO terms most likely to harbor function-specific mutational co-variance. Enrichment for one term (Cuticle) passed the 5%
FDR threshold. A total of 434 genes were assigned to the 13 functional groups, while the remaining 2951 genes with nonzero mutational variance had functions that did notfit our criteria to belong to candidate functions. Even though the enrichment analyses did not take into account the level of mutational or genetic variance, the median standing genetic variance in 5 of the 13 functional groups was significantly higher than expected from the other genes with nonzero mutational variance that were not assigned to our candidate functional groups (Table 1). Overall, the genes assigned to the 13 functional groups had significantly higher mutational variance (median H2M= 0.0013vs.0.0011, median Wilcoxon W for the 1000 tests = 103,544, medianP = 0.012) and standing genetic variance (median H2G= 0.4469vs.0.3841,
median Wilcoxon W for the 1000 tests = 104,144, median P= 0.006) than the genes not assigned to our functional groups (Table 1).
Mutational and standing genetic covariance within functional groups
We found little support for functionally related genes being universally affected by pleiotropic mutations. The functional group“structural constituents of chorion”was the only one of the 13 functional groups in which all genes assigned to that function had mutational variance above zero (Table 1, all eight genes from the DAVID term had above-zero mutational variance). Our enrichment analysis further showed that the functional group Chorion was the only GO term of the entire DAVID 6.7 repository for which all genes showed above-zero mutational variance.
We next tested whether functional modules were enriched in function-specific mutational covariance by determining if the observed mutational covariance within a functional mod-ule exceeded that of the biological background based on random, size-matched, sets of genes whose functions were not known. Only three functional groups showed levels of mutational covariance above that found among random sets of genes (captured by Mbb) (Pro-DNA, Heme, and Cuticle: Table 3). Furthermore, we found one functional group (NeuroT) that showed lower levels of mutational covariance than random groups of genes of the same size that did not belong to a common function (Table 3). Therefore, it appears that genes within a functional module are not typically af-fected by pleiotropic mutations to a greater extent than func-tionally unrelated sets of genes (Table 3).
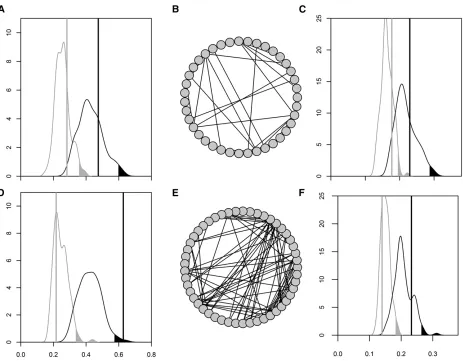
background level for mmax(Figure 1D and Table 3). The difference in mutational covariance between groups Ion Tsp and Cuticle is clearly illustrated by the difference in the fre-quency of pairwise mutational correlations.0.99 within each of these functionally defined modules (Figure 1, B and E).
Function-specific standing genetic covariance was even less common than function-specific mutational covariance. Only functional group Chorion showed higher levels of standing genetic covariance (on two axes) within the func-tional groups than what was seen among random sets of the same number of genes (captured byGbb) (Table 3). In all other groups, the level of function-specific standing genetic covariance matched the typical levels of standing genetic covariance found in the biological background, as illustrated with groups Ion Tsp and Cuticle on Figure 1, C and F.
Stabilizing selection on mutational pleiotropic effects within functional modules
To test whether mutations with pleiotropic effects on func-tionally related sets of traits were less deleterious than mutations with pleiotropic effects on sets of random traits, wefirst estimated the selection coefficients (s) for bothmmax andm2 for each of the 13 functional groups. One of the threesobtained after bendingG(functional group Chorion) was extreme (1.306) as a consequence of the very small genetic variance in the direction ofmmax; without groups with similar estimates of selection, we must consider this value as an outlier. The 25 remainingsvalues formmaxand
m2ranged from 0.010 to 0.062, with a mediansof 0.024 and 0.022, respectively (Table 3). While these selection estimates are slightly stronger than the median reported for random sets offive expression traits (0.016; McGuigan et al.2014a), the within functional moduleswas within the range of what was typically observed for the same number of randomly chosen genes (i.e., estimates fall within the 95% C.I. estimated fromGbbandMbb; Table 3). Only one functional group, Cuticle, showed the predicted weaker within-module selection formmax(Table 3).
Using an alternate measure of selection, which did not restrict selection to occur only along mmax orm2, three groups were revealed that showed a higher common sub-space than expected (Table 3), consistent with weaker selection within these functional groups than among ran-dom sets of genes. Importantly, two of those three groups showed levels of mutational covariance higher than the 95% C.I. interval of the mutational covariance obtained in the biological background (Table 3), and the third group exhibited mutational variance close to the upper C.I. (bac-terium: lmmax0.630, upper C.I. 0.631), indicating that
considerable mutational covariance was generated, which was not subsequently removed by selection.
Stabilizing selection on mutational pleiotropic effects among functional modules
Overall, mutational and genetic covariance was not typi-cally greater than observed in the biological background,
Table 3 Propo rtion of varia nce of the fi rst and second eige nvectors of M and G and me asures of selec tion within fun ctiona l gro ups Grou p l mmax (C.I.) l m2 (C.I.) l gmax (C.I .) l g2 (C.I.) Krzanow ski S (C.I.)
smmax
(C.I.)
sm2
suggesting that much of the mutational covariance was not restricted to functional modules. To investigate this ob-servation further, we estimated among-function covariance contained in the 26 trait combinations with the greatest within-function covariance (i.e.,mmaxandm2, orgmaxandg2, within each of the 13 functional groups). This approach of reducing the within-module complexity to allow us to ex-plore the among-module relationships is analogous to the eigengene network analysis approach developed by Langfelder and Horvath (2007).
We used the linear equations of thefirst two eigenvectors of
M and G of each of the 13 functional groups to generate phenotypic scores for these new index traits. We applied the same univariate (model 1) and bivariate (model 2) mixed models to obtain two 26326 covariance matrices (M26and
G26, Table 2), which contained any mutational or genetic covariance between functional groups that occurred among the major axes of variance within functional groups. We
repeated this procedure on shuffled data to generate 50 M26se and G26se (Table 2) matrices representing sam-pling error to enable an assessment of the significance of the eigenvalues ofM26andG26and the extent of covariance among functional groups (see details on how we obtained randomized distributions in the Supplemental Information inFile S1and McGuiganet al.2014b).
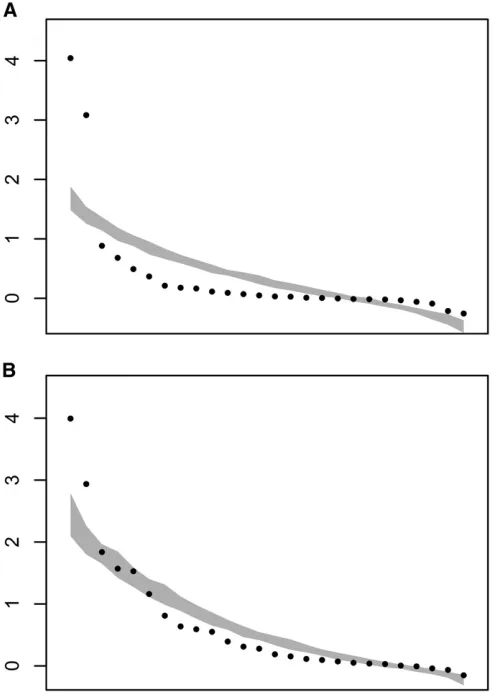
Thefirst two eigenvalues resulting from the diagonaliza-tion of M26 exceeded the magnitude expected solely from sampling error (Figure 2A), indicating that among-functional group covariance was greater than expected from sampling error alone. These first two of the 26 eigenvalues ofM26 represented 72.4% of the total mutational variance con-tained in the 26 traits. Therefore, most of the mutational covariance found within functional groups was also shared among the functional groups; as we explicitly limited the opportunity for the same gene to belong to different func-tional groups, this observation reveals strong mutafunc-tional
Figure 1 Function-specific genetic variance in two groups of similar sizes: Ion Tsp (A–C) and Cuticle (D–F). (A and D) Proportion of the mutational
pleiotropic links among functions. For G26, again only the
first two eigenvectors had eigenvalues larger than expected from sampling error (Figure 2B), but in this case only repre-sented 40.1% of the variance included in G26. Therefore, there appears to be less pleiotropic covariance among func-tional groups in the standing genetic variance than that gen-erated when new mutations first arise in the absence of selection.
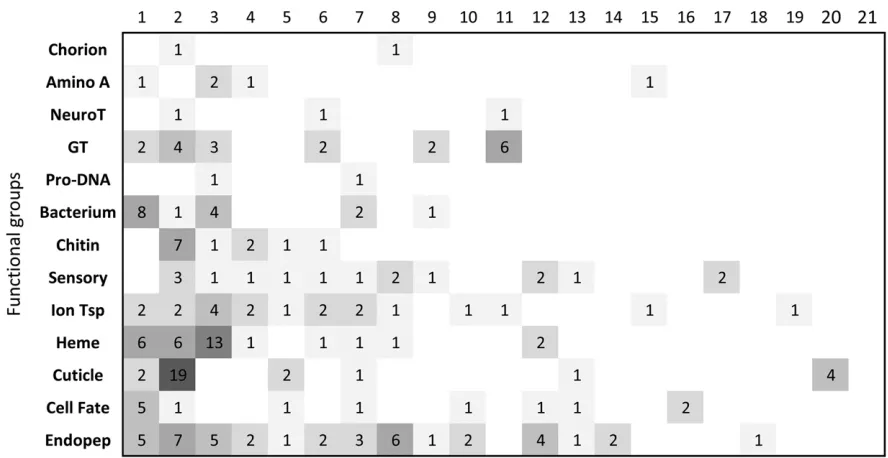
Hineet al.(Emma Hine, Daniel E. Runcie, Katrina McGuigan, and Mark W. Blows, unpublished results) recently applied a high-dimensional Bayesian sparse factor (BSF: Runcie and Mukherjee 2013) analysis to estimate the mutational co-variance across all 3385 genes in our set of 41 M lines and here we compare this broad-scale distribution of variance to our functional groups to gain further insight into the distri-bution of variance across traits. The BSF model identified 21 factors that displayed significant mutational heritability and explained 46% of the total estimated mutational vari-ance. These 21 factors combined had significant contribu-tions from 1263 of the 3385 genes. Figure 3 shows how the genes contained in each functional group analyzed here
contributed significantly (average error rate , 0.005) to each high-dimensional factor. All of the 13 functional groups contained at least one gene that was significantly associated with at least one of the 21 high-dimensional factors; the 21 variational modules identified from the BSF model were typically associated with more than one functional group. This comparison indicates that genes within the functional groups are almost always part of a wider variational module, with much of the mutational variance within functional groups shared across groups within much wider variational modules, as suggested by the analysis ofM26.
As modularity is expected to reduce the strength of selec-tion acting within funcselec-tional groups, the trait combinaselec-tions highlighted as displaying strong covariance among functional groups are expected to be under particularly strong selection. We estimated selection against the first two axes of M26 by estimating the KrzanowskiSsubspace comparison of the two-dimensional subspaces of M26 andM26 in the G lines. Surprisingly, the sum of the eigenvalues of theSmatrix was 1.11, considerably higher than the averageS found within functional modules, suggesting that selection has had little effect on the mutational covariance that is originally wide-spread among functional groups.
Discussion
A genotype–phenotype map in which pleiotropic effects are relatively restricted to groups of functionally integrated traits has been predicted to be evolutionarily beneficial (Wagner 1996). Here, we provide a test of whether variational (pleio-tropic) and functional modules coincide, and whether func-tional relationships among genes influence the strength of stabilizing selection acting on new mutations. Enrichment analyses assigned 434 mutationally variable genes to 13 in-dependent candidate Biological Processes or Molecular Func-tions that also formed variational modules. In general, expressional levels of groups of genes related by function (GO terms) rarely had higher covariance than genes assigned to groups at random. Similarly, mutations jointly affecting functionally related genes were rarely under weaker selec-tion than mutaselec-tions affecting random sets of genes. Our anal-yses revealed widespread pleiotropic effects as we found consistent covariance among functionally unrelated traits (biological background) and we observed that pleiotropic effects spanning functional groups generate much of the mutational variance within functional groups. We now con-sider both the implications of these results and potential caveats on our interpretation.
Pleiotropy and selection on gene expression traits
We found weak evidence that variational modules were re-stricted to functional modules; in only four of 13 functional groups did covariance within functional groups exceed the background level of either mutational or genetic covariance found among random, size-matched sets of genes. Further-more, most (72%) of the mutational covariance established
Figure 2 Spectral distribution of the mutational variance contained in
within functional groups was shared among the functional groups. Again, consistent with previous analyses of these data (McGuigan et al.2014a) and studies in other taxa (Denver et al. 2005; Lemos et al.2005; Rifkinet al. 2005), we ob-served that expression traits were generally under relatively strong stabilizing (purifying) selection that typically matched levels of selection reported for life history traits (Houleet al. 1996). However, the strength of selection on mutations affecting traits within a functional group was not typically statistically distinguishable from mutations affecting random groups of genes not associated with a common function; only three of the 13 functional groups exhibited significant signa-tures of weaker than background stabilizing selection.
To what extent might our results reflect misidentification of functional modules? The lack of support for higher mutational or standing genetic covariance within GO terms might reflect missing or inaccurate information on gene function. GO terms are incomplete descriptions of functional groups (i.e., not all genes involved in that function have necessarily been
identi-fied), allowing the potential for strong covariance among randomly chosen genes to reflect undetected functional mod-ules. Further, as many genes are attributed to functional groups without experimental evidence (for example, in the well-studied Arabidopsis thaliana, only 39% of annotated genes have had their function determined by experimental evidence: Rhee and Mutwil 2014), the potential exists for genes to be incorrectly assigned to functional modules (Clark and Radivojac 2011), which would result in the un-derestimation of covariance within putative functional mod-ules. However, the joint analyses of coexpression and GO
terms have successfully identified gene functions in many studies (e.g., Luo et al. 2007; Nayak et al. 2009; Ayroles et al. 2011; Proost and Mutwil 2017). Although we cannot exclude the possibility that current information on functional groups is so poor that functional and variational modules will not coincide, it seems likely that pleiotropy may generate covariance among functions in an unpredictable manner to a substantial extent.
Functional groups within wider variational modules
While pleiotropy clearly exists within functional groups, it is the widespread and extensive nature of pleiotropy among the GO term-defined functional groups, and among random sets of expression traits in general (McGuiganet al.2014b; Blows et al.2015), that is the overriding feature of the mutational and standing genetic covariance in these expression traits. The 21 variational modules of gene expression uncovered by the high-dimensional BSF model applied by Hine et al. (unpublished results) provided a very useful framework within which to interpret the mutational covariance among functional groups. At one extreme, genes from functional group NeuroT displayed within-group mutational covariance that was lower than in the biological background and only three of its genes were independently part of a wider varia-tional module, indicating that mutations in these genes had highly specific effects. At the other extreme, genes from func-tional group Endopep had genes contributing to 14 of the 21 high-dimensional variational modules. The comparison of our analyses of functional group Cuticle to the 21 BSFs is of particular interest. Functional group“structural constituent
Figure 3 Contribution of the genes contained in the 13 gene ontology terms functional groups to the 19 heritable phenotypic common factors
of cuticle”was the only group to meet all the expectations for correspondence between variational and functional modules: (i) this was the only functional group to show significant en-richment after FDR correction; (ii) mutational variance inmmax was higher than in the biological background; and (iii) there was weaker selection on mutational variance than expected from the biological background. Group Cuticle had 19 (over one-third) genes significantly contributing to the second com-mon factor from the Bayesian analysis. This second factor spanned multiple functions as 11 of our 13 functional groups had genes significantly contributing to it. Thus, what appeared in group Cuticle as aligned functional and variational modular-ity may reflect the contribution of a functional module to a larger variational module.
The sizes of the variational modules in gene expression were considerably larger than the relatively small number of genes contained by the functional groups explored here. A minimum average variational module size to explain the extent of mutational covariance among small random sets of these traits was predicted by McGuiganet al.(2014b) to be 70 genes, but it was also suggested that some variational modules were likely to be much larger than this. Analysis of the transcriptome-wide covariance structure of the standing genetic variation in the G lines indicated the presence of one variation module that affected a very large number of expression traits (Blowset al.2015). Here, the analysis of
M26 was also consistent with the existence of large varia-tional modules.
How biologically specific a functional module is, and whether its function is essential or localized, might also help explain some of our observations. Afirst step toward account-ing for the different roles of our 13 functional groups is to consider the structure of GO. Analyses of GO terms as directed acyclic graphs (DAGs) (or gene or protein interaction net-works more generally) have identified common topological features, and highlighted the functional or evolutionary sig-nificance of certain types of nodes (genes or gene products) or edges (interactions) [reviewed in Huet al.(2016) and Zhang et al. (2016)]. The 13 functional groups (individual GO terms) considered here varied considerably in the topology of their networks (DAGs), including in their degree (the num-ber of other GO terms to which they relate, Table 1). Under the hypothesis that selection on function drives evolution of pleiotropy to match functional groupings, GO terms em-bedded within broader functional networks (i.e., with high degree) might be expected to have reduced within-term co-variance compared to GO terms with more specific functions (low degree). However, the estimated Spearman’s correla-tion between degree and the proporcorrela-tion of variance associ-ated with each of thefirst two axes of mutational or standing genetic variance was mainly not in the predicted direction (mmax:r=20.20;m2:r= 0.04;gmax:r= 0.09; andg2:r= 0.02). These correlations were not statistically supported as distinct from zero (mmax:P= 0.50;m2:P= 0.90;gmax:P= 0.78; andg2:P= 0.94), but it should be noted that we had very low power given a sample size of 13. Thus, whether or not
the studied GO term belonged to a broader functional module might help explain our results, but analysis of more functional modules with a range of degrees will be needed to test this robustly. It is important to remember that the effects of the genes identified in our functional groups are not restricted to this group.
Indirect evidence for the embedding of a number of func-tional groups within larger variafunc-tional modules comes from several published studies. In humans, Pickrellet al.(2016) combined genome-wide association studies on 42 traits or diseases and identified 341 loci that associated with multiple functionally unrelated traits, highlighting that pleiotropy spanned multiple functions. When considering clusters of coexpressed genes, Alloccoet al.(2004) found that in yeast, pairs of coregulated genes belong to significantly closer GO terms than randomly chosen pairs of genes. However, many coexpressed and coregulated genes belonged to very distant GO terms. Thus, although clusters of coexpression between unstudied genes and genes of known biological function have proven a powerful tool for the identification of putative func-tion of unknown genes and of candidate genes for biological traits or functions of interest (e.g., Luoet al.2007; Nayaket al. 2009; Ayroleset al.2011; Proost and Mutwil 2017), there is nonetheless considerable evidence that pleiotropic variation is not strongly restricted to occur only within functional groups.
Selection on pleiotropic mutations
in no case were we able to support a significant relationship between selection and degree. Surprisingly, our results even suggested that selection against pleiotropic mutations affect-ing many functions may be lower than the selection observed within functional modules. The greater similarity of the mu-tational and genetic subspaces that represented the among functional group covariance, compared to within functional group covariance, is inconsistent with the evolution of mod-ularity in response to deleterious pleiotropic mutation.
Collectively, our results confirm that while focusing on individual GO terms as functional modules can to some extent predict variational modularity, it will miss many important biological connections among functional modules. Considering higher-order interactions generated by broader variational modules spanning various functions will be a necessary part of understanding the evolution of genetic covariance.
Acknowledgments
We thank John Stinchcombe for helpful discussions; J. Thompson, C. Oesch-Lawson, D. Petfield, O. Sissa-Zubiate, F. Frentiu, and Y.H. Ye for help with the MA experiment and data collection; and Gabriel Marroig and an anonymous reviewer for their very helpful comments on the manuscript. This work was funded by the Australian Re-search Council and an Agreenskills + fellowship to J.M.C.
Literature Cited
Aguirre, J. D., E. Hine, K. McGuigan, and M. W. Blows, 2014 Comparing G: multivariate analysis of genetic variation in multiple populations. Heredity 112: 21–29.
Allen, S. L., R. Bonduriansky, and S. F. Chenoweth, 2013 The genomic distribution of sex-biased genes inDrosophila serrata: X chromosome demasculinization, feminization, and hyperex-pression in both sexes. Genome Biol. Evol. 5: 1986–1994. Allocco, D. J., I. S. Kohane, and A. J. Butte, 2004 Quantifying the
relationship between co-expression, co-regulation and gene function. BMC Bioinformatics 5: 18.
Ashburner, M., C. A. Ball, J. A. Blake, D. Botstein, H. Butleret al., 2000 Gene ontology: tool for the unification of biology. Nat. Genet. 25: 25–29.
Ayroles, J. F., M. A. Carbone, E. A. Stone, K. W. Jordan, R. F. Lyman
et al., 2009 Systems genetics of complex traits inDrosophila melanogaster. Nat. Genet. 41: 299–307.
Ayroles, J. F., B. A. Laflamme, E. A. Stone, M. F. Wolfner, and T. F. C. Mackay, 2011 Functional genome annotation of Drosoph-ilaseminalfluid proteins using transcriptional genetic networks. Genet. Res. 93: 387–395.
Barrett, T., D. B. Troup, S. E. Wilhite, P. Ledoux, C. Evangelista
et al., 2011 NCBI GEO: archive for functional genomics data sets-10 years on. Nucleic Acids Res. 39: D1005–D1010. Barton, N. H., 1990 Pleiotropic models of quantitative variation.
Genetics 124: 773–782.
Blows, M. W., S. L. Allen, J. M. Collet, S. F. Chenoweth, and K. McGuigan, 2015 The phenome-wide distribution of genetic variance. Am. Nat. 186: 15–30.
Butland, G., J. M. Peregrin-Alvarez, J. Li, W. Yang, X. Yanget al., 2005 Interaction network containing conserved and essential protein complexes inEscherichia coli. Nature 433: 531–537.
Carter, S. L., C. M. Brechbühler, M. Griffin, and A. T. Bond, 2004 Gene co-expression network topology provides a frame-work for molecular characterization of cellular state. Bioinfor-matics 20: 2242–2250.
Chen, Y. W., and N. V. Dokholyan, 2006 The coordinated evolu-tion of yeast proteins is constrained by funcevolu-tional modularity. Trends Genet. 22: 416–419.
Cheverud, J. M., 1984 Quantitative genetics and developmental constraints on evolution by selection. J. Theor. Biol. 110: 155– 171.
Civelek, M., and A. J. Lusis, 2014 Systems genetics approaches to understand complex traits. Nat. Rev. Genet. 15: 34–48. Clark, W. T., and P. Radivojac, 2011 Analysis of protein function
and its prediction from amino acid sequence. Proteins 79: 2086– 2096.
Denver, D. R., K. Morris, J. T. Streelman, S. K. Kim, M. Lynchet al., 2005 The transcriptional consequences of mutation and nat-ural selection inCaenorhabditis elegans. Nat. Genet. 37: 544– 548.
D’haeseleer, P., S. Liang, and R. Somogyi, 2000 Genetic network inference: from co-expression clustering to reverse engineering. Bioinformatics 16: 707–726.
Edgar, R., M. Domrachev, and A. E. Lash, 2002 Gene Expression Omnibus: NCBI gene expression and hybridization array data repository. Nucleic Acids Res. 30: 207–210.
Eisen, M. B., P. T. Spellman, P. O. Brown, and D. Botstein, 1998 Cluster analysis and display of genome-wide expression patterns. Proc. Natl. Acad. Sci. USA 95: 14863–14868. Fisher, R. A., 1930 The Genetical Theory of Natural Selection. Oxford
University Press, Oxford.
Fraser, H. B., A. E. Hirsh, L. M. Steinmetz, C. Scharfe, and M. W. Feldman, 2002 Evolutionary rate in the protein interaction network. Science 296: 750–752.
Frentiu, F. D., M. Adamski, E. A. McGraw, M. W. Blows, and S. F. Chenoweth, 2009 An expressed sequence tag (EST) library forDrosophila serrata, a model system for sexual selection and climatic adaptation studies. BMC Genomics 10: 40.
Gentleman, R., V. J. Carey, W. Huber, R. A. Irizarry, and S. Dudoit (Editors), 2005 Bioinformatics and Computational Biology So-lutions Using R and Bioconductor. Springer-Verlag, New York. Griswold, C. K., 2006 Pleiotropic mutation, modularity and
evolv-ability. Evol. Dev. 8: 81–93.
Hahn, M. W., G. C. Conant, and A. Wagner, 2004 Molecular evo-lution in large genetic networks: does connectivity equal con-straint? J. Mol. Evol. 58: 203–211.
Han, J. D. J., N. Bertin, T. Hao, D. S. Goldberg, G. F. Berrizet al., 2004 Evidence for dynamically organized modularity in the yeast protein-protein interaction network. Nature 430: 88–93.
Harispe, S., D. Sánchez, S. Ranwez, S. Janaqi, and J. Montmain, 2014 A framework for unifying ontology-based semantic sim-ilarity measures: a study in the biomedical domain. J. Biomed. Inform. 48: 38–53.
He, X. L., and J. Z. Zhang, 2006 Toward a molecular understand-ing of pleiotropy. Genetics 173: 1885–1891.
Hill, W. G., and X. S. Zhang, 2012 Assessing pleiotropy and its evolutionary consequences: pleiotropy is not necessarily limited, nor need it hinder the evolution of complexity. Nat. Rev. Genet. 13: 296.
Houle, D., B. Morikawa, and M. Lynch, 1996 Comparing muta-tional variabilities. Genetics 143: 1467–1483.
Hu, J. X., C. E. Thomas, and S. Brunak, 2016 Network biology concepts in complex disease comorbidities. Nat. Rev. Genet. 17: 615–629.
Ideker, T., T. Galitski, and L. Hood, 2001 A new approach to decoding life: systems biology. Annu. Rev. Genomics Hum. Genet. 2: 343–372.
Jeong, H., S. P. Mason, A. L. Barabasi, and Z. N. Oltvai, 2001 Lethality and centrality in protein networks. Nature 411: 41–42.
Jovelin, R., and P. C. Phillips, 2009 Evolutionary rates and cen-trality in the yeast gene regulatory network. Genome Biol. 10: R35.
Kanehisa, M., S. Goto, M. Hattori, K. F. Aoki-Kinoshita, M. Itoh
et al., 2006 From genomics to chemical genomics: new devel-opments in KEGG. Nucleic Acids Res. 34: D354–D357. Kitano, H., 2002 Systems biology: a brief overview. Science 295:
1662–1664.
Kopp, A., and L. M. McIntyre, 2012 Transcriptional network struc-ture has little effect on the rate of regulatory evolution in yeast. Mol. Biol. Evol. 29: 1899–1905.
Kreimer, A., E. Borenstein, U. Gophna, and E. Ruppin, 2008 The evolution of modularity in bacterial metabolic networks. Proc. Natl. Acad. Sci. USA 105: 6976–6981.
Krylov, D. M., Y. I. Wolf, I. B. Rogozin, and E. V. Koonin, 2003 Gene loss, protein sequence divergence, gene dispens-ability, expression level, and interactivity are correlated in eu-karyotic evolution. Genome Res. 13: 2229–2235.
Krzanowski, W. J., 1979 Between-groups comparison of principal components. J. Am. Stat. Assoc. 74: 703–707.
Langfelder, P., and S. Horvath, 2007 Eigengene networks for studying the relationships between co-expression modules. BMC Syst. Biol. 1: 54.
Lemos, B., B. R. Bettencourt, C. D. Meiklejohn, and D. L. Hartl, 2005 Evolution of proteins and gene expression levels are coupled in Drosophila and are independently associated with mRNA abundance, protein length, and number of protein-protein interactions. Mol. Biol. Evol. 22: 1345–1354.
Lin, C. Y., T. L. Lee, Y. Y. Chiu, Y. W. Lin, Y. S. Lo et al., 2015 Module organization and variance in proteprotein in-teraction networks. Sci. Rep. 5: 9386.
Luo, F., Y. Yang, J. Zhong, H. Gao, L. Khanet al., 2007 Constructing gene co-expression networks and predicting functions of un-known genes by random matrix theory. BMC Bioinformatics 8: 299.
Lynch, M., and B. Walsh, 1998 Genetics and Analysis of Quantita-tive Traits. Sinauer Associates, Sunderland, MA.
Mazurie, A., D. Bonchev, B. Schwikowski, and G. A. Buck, 2010 Evolution of metabolic network organization. BMC Syst. Biol. 4: 59.
McGuigan, K., J. M. Collet, S. L. Allen, S. F. Chenoweth, and M. W. Blows, 2014a Pleiotropic mutations are subject to strong sta-bilizing selection. Genetics 197: 1051–1062.
McGuigan, K., J. M. Collet, E. A. McGraw, Y. H. Ye, S. L. Allenet al., 2014b The nature and extent of mutational pleiotropy in gene expression of maleDrosophila serrata. Genetics 196: 911–921. McQuilton, P., S. E. St Pierre, and J. Thurmond FlyBase
Consor-tium, 2012 FlyBase 101–the basics of navigating FlyBase. Nucleic Acids Res. 40: D706–D714.
Melo, D., and G. Marroig, 2015 Directional selection can drive the evolution of modularity in complex traits. Proc. Natl. Acad. Sci. USA 112: 470–475.
Mitteroecker, P., 2009 The developmental basis of variational modularity: insights from quantitative genetics, morphometrics, and developmental biology. Evol. Biol. 36: 377–385.
Moreno-Hagelsieb, G., and P. Jokic, 2012 The evolutionary dy-namics of functional modules and the extraordinary plasticity of regulons: theEscherichia coliperspective. Nucleic Acids Res. 40: 7104–7112.
Nayak, R. R., M. Kearns, R. S. Spielman, and V. G. Cheung, 2009 Coexpression network based on natural variation in
human gene expression reveals gene interactions and func-tions. Genome Res. 19: 1953–1962.
Olson, E. C., and R. L. Miller, 1958 Morphological Integration. University of Chicago Press, Chicago.
Orr, H. A., 2000 Adaptation and the cost of complexity. Evolution 54: 13–20.
Pál, C., and L. D. Hurst, 2003 Evidence for co-evolution of gene order and recombination rate. Nat. Genet. 33: 392–395. Parter, M., N. Kashtan, and U. Alon, 2007 Environmental
variabil-ity and modularvariabil-ity of bacterial metabolic networks. BMC Evol. Biol. 7: 169.
Pavlicev, M., and T. Hansen, 2011 Genotype-phenotype maps maximizing evolvability: modularity revisited. Evol. Biol. 38: 371–389.
Peregrín-Alvarez, J. M., C. Sanford, and J. Parkinson, 2009 The conservation and evolutionary modularity of metabolism. Ge-nome Biol. 10: R63.
Pickrell, J. K., T. Berisa, J. Z. Liu, L. Segurel, J. Y. Tung et al., 2016 Detection and interpretation of shared genetic influences on 42 human traits. Nat. Genet. 48: 709–717.
Pinheiro, J. C., and D. M. Bates, 2000 Mixed-Effects Models in S and S-PLUS. Springer, New York.
Pritykin, Y., D. Ghersi, and M. Singh, 2015 Genome-wide detec-tion and analysis of multifuncdetec-tional genes. PLoS Comput. Biol. 11: e1004467.
Proost, S., and M. Mutwil, 2017 PlaNet: comparative co-expression network analyses for plants, pp. 213–227 in Plant Genomics Databases: Methods and Protocols, edited by A. D. J. van Dijk. Springer, New York.
Rhee, S. Y., and M. Mutwil, 2014 Towards revealing the functions of all genes in plants. Trends Plant Sci. 19: 212–221.
Rifkin, S. A., D. Houle, J. Kim, and K. P. White, 2005 A mutation accumulation assay reveals a broad capacity for rapid evolution of gene expression. Nature 438: 220–223.
Rose, N. H., F. O. Seneca, and S. R. Palumbi, 2015 Gene networks in the wild: identifying transcriptional modules that mediate coral resistance to experimental heat stress. Genome Biol. Evol. 8: 243–252.
Runcie, D. E., and S. Mukherjee, 2013 Dissecting high-dimensional phenotypes with Bayesian sparse factor analysis of genetic covari-ance matrices. Genetics 194: 753–767.
Salathé, M., M. Ackermann, and S. Bonhoeffer, 2006 The effect of multifunctionality on the rate of evolution in yeast. Mol. Biol. Evol. 23: 721–722.
Schlosser, G., and G. P. Wagner, 2004 Modularity in Development and Evolution. The University of Chicago Press, Chicago, London.
Snel, B., and M. A. Huynen, 2004 Quantifying modularity in the evolution of biomolecular systems. Genome Res. 14: 391– 397.
Spirin, V., M. S. Gelfand, A. A. Mironov, and L. A. Mirny, 2006 A metabolic network in the evolutionary context: multiscale struc-ture and modularity. Proc. Natl. Acad. Sci. USA 103: 8774– 8779.
Storz, J. F., J. T. Bridgham, S. A. Kelly, and T. Garland, 2015 Genetic approaches in comparative and evolutionary physiology. Am. J. Physiol. Regul. Integr. Comp. Physiol. 309: R197–R214.
Su, Z. X., Y. W. Zeng, and X. Gu, 2010 A preliminary analysis of gene pleiotropy estimated from protein sequences. J. Exp. Zoolog. B Mol. Dev. Evol. 314B: 115–122.
Takemoto, K., and S. Borjigin, 2011 Metabolic network modular-ity in archaea depends on growth conditions. PLoS One 6: e25874.
Wagner, G. P., 1996 Homologues, natural kinds and the evolution of modularity. Am. Zool. 36: 36–43.
Wagner, G. P., and L. Altenberg, 1996 Perspective: complex ad-aptations and the evolution of evolvability. Evolution 50: 967– 976.
Wagner, G. P., and J. G. Mezey, 2004 The role of genetic archi-tecture constraints in the origin of variational modularity, pp. 338–358 inModularity in Development and Evolution, edited by G. Schlosser, and G. P. Wagner. The University of Chicago Press, Chicago, London.
Wagner, G. P., M. Pavlicev, and J. M. Cheverud, 2007 The road to modularity. Nat. Rev. Genet. 8: 921–931.
Waterhouse, R. M., F. Tegenfeldt, J. Li, E. M. Zdobnov, and E. V. Kriventseva, 2013 OrthoDB: a hierarchical catalog of animal, fungal and bacterial orthologs. Nucleic Acids Res. 41: D358– D365.
Welch, J. J., and D. Waxman, 2003 Modularity and the cost of complexity. Evolution 57: 1723–1734.
Whiteley, M. A., and K. Pearson, 1899 Data for the problem of evolution in man. I. Afirst study of the variability and correla-tion of the hand. Proc. R. Soc. Lond. 65: 126–151.
Zhang, X., M. L. Acencio, and N. Lemke, 2016 Predicting essential genes and proteins based on machine learning and network topological features: a comprehensive review. Front. Physiol. 7: 75.
Zhao, J., G.-H. Ding, L. Tao, H. Yu, Z.-H. Yuet al., 2007 Modular co-evolution of metabolic networks. BMC Bioinformatics 8: 311. Zhou, W., and L. Nakhleh, 2012 Convergent evolution of modu-larity in metabolic networks through different community struc-tures. BMC Evol. Biol. 12: 181.