Celestial Phenomena and Earth's Water
Lev N. Ptatnitsky
RAS Joint Institute for High Temperatyres, Dept. 2.2, Moscow, Russia
Chief researcher-adviser, D.Sc., Moscow, Russia
ABSTRACT: The cause of the dependence of the tides in the ocean on the Moon phases is well known, whereas the Moon phase influence on the human self-feeling has no explanation. Water makes up about 70% of the human body's mass. The water structure could provide an explanation, but it is still under investigation. Hence we studied the structure change which implies an answer the question whether the influence effect exists. The light scattering indicatrix served as a tool for the information obtaining. The scattering indicatrix is a spatial Fourier transform of the structure distribution function by size, and gives reliable information about the structure changes. The Solar eclipse, Moon phases, magnetic storm were chosen as the phenomena to be studied as the source of the influence. The results confirmed the water structure dependence on these phenomena, which manifests itself in increase of some structure component sizes. The increase can change the blood flow through the capillaries of living beings, and thereby affect a human self-feeling. This unusual effect puts many questions that require serious research. One of them is the dependence of biological reactions on the water structure.
KEYWORDS: water structure, Solar eclipse, New Moon, magnetic storm, light scattering indicatrix, chaotic dynamics, human self-feeling .
I. INTRODUCTION
Some celestial phenomena is long known to influence on the man’s self-feeling, though the effect mechanism is unknown. Water makes up more than 70% of a human mass. And there occurred the idea that the water might be that agent through which this influence is realized. Chemical reactions were eliminated, since they require high energy and reagents. Therefore, it was the water structure that should be considered as the object of the influence.. It is not a secret that the water structure varies depending on the conditions of its stay. Hence, it is the structure that could perceive the celestial phenomena influence, if any.
Unfortunately, there is still no generally accepted concept of the water structure. Though it is known that the hydrogen bonds of water molecules, and the surface electric dipoles form clusters of various sizes and stability. The aggregate of these processes creates a spatio-temporal structure that continuously changes as a result of Brownian motion and permanent modifications of the clusters. So, the task before us implies obtaining reliable evidence that the water structure changes under the influence of some celestial phenomena, despite the lack of correct data on the structure.
The structure evolution can be traced by means of recording of the light scattering indicatrix. The indicatrix is in fact Fourier transform of the distribution function of the water clusters by size. The scattering indicatrix folloes the water structure, and its evolution gives reliable information about the structure changes. To measure such subtle processes with good reliability and accuracy, a number of conditions should be strictly implemented.
The first point and the key to reliable result was the pure water. The criterion of the quality was the indicatrix repeatability. According to the tests, the water from many sources was , examined, and the preference was given to Moscow tap water. The water was filtered and kept under predetermined conditions for two days before experiment. Next are these conditions.
ISSN(Online): 2319-8753 ISSN (Print): 2347-6710
International Journal of Innovative Research in Science,
Engineering and Technology
(A High Impact Factor, Monthly, Peer Reviewed Journal) Visit: www.ijirset.com
Vol. 7, Issue 8, August 2018
requires some necessary level of the signal/noise ratio, provided the intensity does not affect the water the temperature and structure. The temperature, magnetic and electric fields in the vicinity of the measurement area, stability of the setup parameters, and the absence of vibrations are monitored. If these conditions are violated, the computer erases all the monitoring data. All the experimental procedures were performed under the the computer control without human participation.
The forecast of the celestial phenomenon often does not correspond to the data of the monitoring. In addition, geophysical perturbations created by other phenomena can occur during the experiment, and in this way interfere the measurement result. The reliable dats about the phenomenon become known only after its completion. Therefore, the conditions of the planned experiment should be carefully checked. after it has been held. We used to do this checking by means of the data obtained from the RAS Institutes of geophysical profile such as IZMIRAN, as well as from GOES satellites.
The Solar eclipse, Moon phases, magnetic storms have been investigated to determine whether there exidts their influence on the water structure. The measurements showed scattering intensification and the indicatrix deformation during the named phenomena. It means that the water structural elements increase in size. It is natural to assume that the blood flow through the capillaries of living being, as well as the metabolism depend on the sizes of structure elements of the water. the main component of the blood. This increase explains the influence of celestial phenomena on the human self-feeling. Also, this result initiates the search for other celestial phenomena with a similar effect. In addition, questions arise regarding the role of water structure in various biological processes and reactions of organic chemistry.
II.METHOD
According to the above listed reqirments, the water structure evolution is investigated by means of the indicatrix of laser radiation scattering, The wavelength of the radiation is determined by the characteristic scale of the structure. The sounding efficiency depends on the scattering cross section through the water extinction coefficient which is a function of the. wavelength. The pure water extinction coefficient has the minimum at wavelength ƛ≈0.5μm. The
scattering prevails in the short-wavelength region of the spectrum, ƛ<0.5 μm. On the contrary, the absorption
progressively increases in the long-wavelength region, ƛ>0.5 μm.
For greater reliability of the experiment data, measurements were made simultaneously by means of two setups which had somewhat different designs, placed in different rooms. Setup 1. The water volume 150ml was probed by the laser pulse with wavelength ƛ=0.53μm, the pulse duration 2 ns, repetition frequency 200 Hz. Setup 2. The water volume 4.5 liters was probed by the continuous laser, wavelength ƛ=0.44 μm.
The indicatrix is the scattering intensity dependence on the observation angle θ, J(θ). Тhе vector of scattered wave s is the sum of the incident wave vector k , and the vector q arising in the scattering medium, s=k+q. The indicatrix shape
J(θ) depends on the plane of its observation. The simplest and therefore convenient form to use is in the plane normal
to the electric vector E of the incident wave [1, 2]. Its configuration in this plane is determined only by product of two factors, |q|•L, whereL is the characteristic scale of the structure inhomogeneity:
qL=4π(L/λ)sin(θ/2),
The indicatrix in water corresponds to Mie scattering at the determining parameter value qL~1. Traditionally, the indicatrix is determined by measuring the scattered light intensity for a set of angles θ. However, Brownian motion,
fluctuation the cluster mixture composition, and the noise variation of the detectors for different angles θ and different
time cause distortions of the indicatrix. The device [3] is used to avoid the indicatrix distortions during recording and averaging of a sequence of the indicatrix
The device converts the real spatial indicatrix into its flat image on the CCD-manrixsurface . This procedure is realized due to replacement of the spherical focusing lens byi the inner reflecting surface of the cone (axicon).ring. The height of the ring and the angle at the cone base set the scattering volume length. The annular diaphragm selects a range of
angles θ for study. Тhe indicatrix image and its representation in Cartesian coordinates are displayed on the computer
III.SOLARECLIPSE
Consider water structure behavior on the day of t partial Solar eclipse on October 12, 1996. This day, other phenomena thaьпреcreate noticeable geophysical disturbances were not observed, except for the New Moon, which always accompanies the Solar eclipse. The Moon shadow on the Earth surface corresponded to overlap 70% of the Solar disk.[4]. The eclipse lasted from 1500 to 1905, the maximum 1703 (Moscow time) in point 71.7° N and 32.1° E. Consider water structure behavier on the day of the partial Solar eclipse on October 12, 1996.
On this day, phenomena that create noticeable geophysical disturbances were not observed, except for the New Moon, which always accompanies the Solar eclipse. The Moon shadow on the Earth surface corresponded to overlap 70% of the Solar disk. [4]. The eclipse lasted from 1500 to 1905, the maximum 1703 (Moscow time) in point 71.7° N and 32.1° E.
SENUP 1
.On the eclipse day from 1100 to 2115, 18432 scattering indicatrices (ƛ = 0.53 μm) were obtained within the angle
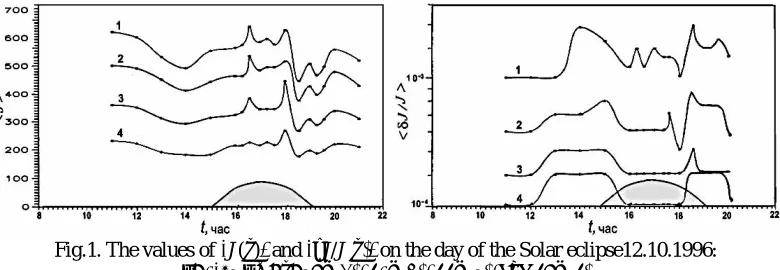
θº[34,160] with angular resolution of Δθ = 2°. The indicaticies were averaged over cycles of the measurement. Each cycle included 1024 indicatrices with 64 significant points. The full cycle recording lasted 5 seconds.. Figure 1 represens the mean intensities J(θ)k and their relative fluctuations δJ/J(θ) k as functions of time for the followinng set of the
angles, θ={38, 40, 44, 46}. These angles were chosen for the analysis because of the greatest effect. This angle zone corresponds to the size of the water structure inhomogeneity of the order 0.1 μm. The eclipse development is marked in
Fig. 1 by the shaded area.
Fig.1. The values of J(θ) and δJ/J(θ) on the day of the Solar eclipse12.10.1996:
λ=0.53 μm; θ=38° (1), 40° (2), 44° (3), and 46° (4)
According to Fig. 1, both shown functions begin to change in a few days before the eclipse. High-frequency
oscillations for the angle θ=38° arise in the region of the apogee, At other angles, these oscillations are smoothed. All of them disappear after the eclipse. The scattering intensity decreases with the angle growth. The fluctuations δJ/J(θ)
decrease as well. As function δJ/J(θ) constitute everywhere a small fraction of the intensity itself, the intensity J(θ)
change cannot be attributed to a random process. So we may say with certainty the water structure is transformed during the eclipse.
ISSN(Online): 2319-8753 ISSN (Print): 2347-6710
International Journal of Innovative Research in Science,
Engineering and Technology
(A High Impact Factor, Monthly, Peer Reviewed Journal) Visit: www.ijirset.com
Vol. 7, Issue 8, August 2018
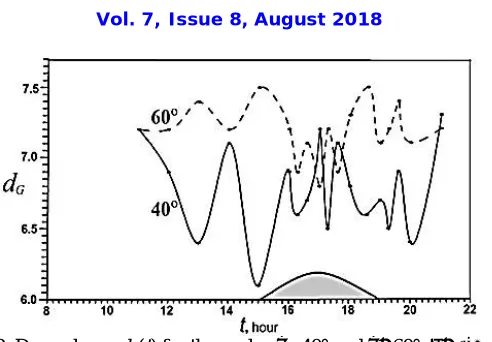
.Fig. 2. Dependence dG(t) for the angles θ= 40° and θ =60°, λ= 0.53 μm,
October 12, from 1130 to2130
It is of interest to trace the mutual location of the dependences dG(t) for these angles. As we have seen in Fig. 1, the
scattering intensity J(θ), the level of fluctuations δJ/J(θ), and the scale of the structure Ldetermined by the formula
(1) decrease with angle θ growth, P(40°)>P(60°). P denotes these functions.In case of correlation dimension dG(θ, t),
Fig. 2, we observe quite a different picture: there appears relationship dG(40°)<dG(60°). This inequality is valid for the
whole eclipse area, except for the apogee zone, at 1703, and its nearest vicinity. Inequality dG(40°)>dG(60°).ariseswithin
this zone.
We also note some other changes in the correlation dimension during eclipse. Before the eclipse apogee, the minima of dG(40°) correspond to the maxima of dG(60°) , as if the change of one occurs by the expense of the other. However,
while approaching to the apogee, the curves get closer to each other and even intersect while the apogee. In addition, a tendency develops soon after the apogee, 1815: both curves of the correlation dimension tend to the stable in-phase oscillations
Thus, the experiments with stand 1 demonstrates significant changes in the water structure..
SETUP 2
The experiments with setup 2 lasted from 1025, October 11 to 2155, October 14. The indicatrix was being recorded within the scattering angle range θº [35,155] with angular resolution Δθ=2°, total 61 angles. The water was probed by a continuous laser radiation λ=0.44 μm. Accordingly, the measurement procedure was slightly modified. There were
selected four (n=1-4) cycles of the measurement for the analysis.
1. 1025 -1040, October 11-long before the eclipse. 2. 1600 -1615, October 12 - at the beginning of the eclipse. 3. 1800 -1815, October 12 - immediately after the full phase; 4. 2100 -2115; October 12 - 3 hours after the eclipse.
4000 indicatrices (2.44×10⁵significant points) contained the obtained information . One cycle (n,i) included 1000 indicatrices Jn(θi) represented by the intensity for .61 angles θi. The record of each indicatrix took τ= 0.9 s, and the whole
cycle lasted 15 minutes. Record of each indicatrix took τ=0.9 s, and the whole cycle lasted 15 minutes.
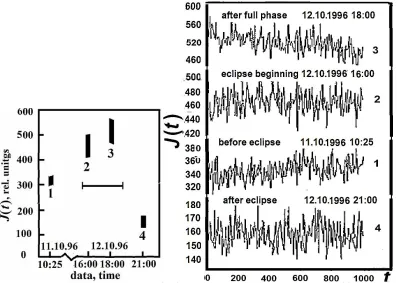
The greatest effect had been occurred at angle θ=38°. The chronograms of scattering intensity Jθ(t) for this angle was simultaneously recorded during all the cycles. The indicatrix alteration process is convincingly demonstrated by the
example of the scattering for angle θ=38°, Jn(t, θ=38°). Figure 3 represents these chronograms along with the sequence of the cycles (on the left).The greatest effect had been occurred at angle θ=38°. The chronograms of scattering intensity Jθ(t)
for this angle was simultaneously recorded during each of the cycles. The indicatrix alteration process is convincingly demonstrated in Fig. 3by the example of the scattering for angle θ=38°, Jn(t, θ=38°)./Figure 3 represents these
Fig. 3. Measurement schedule (left) and scattering intensity chronograms Jn(t):
1-4 mean cycle numbesr,t is a thousandth part of the indicatrix recordi time in 0.9 s units,
J(t) is ratio of current intensity to the largest one observed in experiment, taken as 1000 units
As the indicatrix alteration process proved, the scattering iintensification begins a few days before the eclipse. Further intensity increased, and growth continues during cycle 1-3.. The effect reachs maximum immediately after the apogee (cycle 3), when scattering became much higher than in the cycle 1. After that the intensity decreases, and its average value in the cycle 4 fell to the level of the indicatrix of unperturbed water.
According to Fig. 3, the scattering amplitude in cycle 1 (30 hours before the eclipse) is at the level of 340 units. After the eclipse starts,, cycle 2, the level rises up to 470, and reaches maximum 540 immediately after the highest eclipse phase in cycle 3. Three hours after the eclipse, cycle 4, the amplitude drops down to 165 units. This level is usually observed in absence of geophysical perturbations Thus, on the eve of the eclipse, cycle 1, the indicatrix amplitude exceeded the normal level (cycle 4) more than twice. It proves that the water structure changes during the day of the Solar eclipse, and the first signs of the effect appears a few days before the eclipse.
IV. PHASES OF THE MOON
So the water structure undergoes significant changes during the Solar eclipse. However, the Moon can also affect the water structure. These simultaneous events do not allow us to highlight the Moon impact. Therefore, the Moon impact should be investigated separately, in the unperturbed geophysical environment. The New Moon phase at 500 on June 9, 1994 corresponded to this condition. The New Moon effect was estimated from the changes in the fluctuation spectra of the chronograms.
Figure 4 demonstrates the spectra during the Moon transition into the New Moon phase (May 30, June 3, June 6 and 14) for the scattering angle θ=35° in 25Hz range. The spectra presented in the level scale of the fluctuations observed
ISSN(Online): 2319-8753 ISSN (Print): 2347-6710
International Journal of Innovative Research in Science,
Engineering and Technology
(A High Impact Factor, Monthly, Peer Reviewed Journal) Visit: www.ijirset.com
Vol. 7, Issue 8, August 2018
Fig. 4. Spectra of fluctuations (θ=35°) during the New Moon on June 9, 1994 by the dates of their records: 1‒May 30, 2‒June 3, 3‒June,6, 4‒June14
According to Fig. 4, the effect is manifested (frame 1) in the increase of fluctuations in a narrow frequency interval. Further, frame 2, the amplitude of the spectra increases.in a wider frequency band. The amplitude reaches the highest values in phase 3, just before the New Moon phase. Then a rapid decline of the spectrum amplitude begins. Spectrum 4 means return to the structure in the unperturbed state.
The course of the process resembles the behaviour of the structure parameters during the Solar eclipse presented in Figures 1, 2, 3. Indeed, the water structure changes arise about a week before the eclipse, and sharply decrease at the end of the eclipse. Therefore, we can assume that the Moon at the transition into the New Moon phase. plays the main role in the process of the water structure changing during the day of the Solar eclipse
V. SOLAR ACTIVITY AND MAGNETIC STORMS
Solar flares are bright spots on its surface, which exist from a few minutes to several hours. Electromagnetic radiation from the flare reaches the Earth in about 8-10 minutes. Within tens minutes our planet is irradiated by powerful streams of charged particles. About two days later, clouds of the plasma reach the Earth magnetosphere. The collision of this peculiar blast wave with the Earth causes geomagnetic storms which last from several hours to several days.
The effect of this phenomenon on the water structure was studied by the example of the geomagnetic storm of G3 level, March 19-21, 2001, initiated by six Solar flares on March 18. The storm intensity varied. The measurement was performed on March 20 from 1200 to 1405. During this period, the geophysical activity reached maximum Kp= 7 against the background level of Kp = 6 (according to data of the Laboratory of X-ray Solar Astronomy, Lebedev Institute
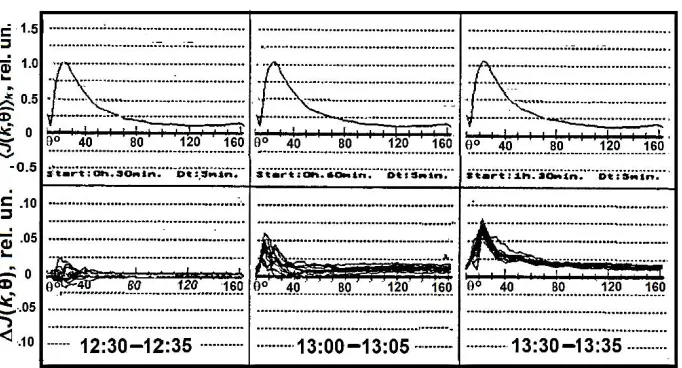
of RAS). Both setups were employed in the experiments The scattering angle covered the range θº[20, 160]. The most significant data of the measurements are in Fig. 5 and Fig. 6.
SETUP 1
Pulse sounding, ƛ = 0.53 μm. Measurements were performed in three cycles (n =1 - 3) starting from 1230, 1300, 1330 , 5 minutes each. A cycle included 9000 indicatrices. These indicatrices averaged for each cycle, J(n, θ)n, are represented in
Fig. 5. Water structure changes during magnetic storm on March 20, 2001 (Moscow): average indicatrices Jn(k,θ)k(top); difference indicatrices at 1230, 1300, 1330 (row 2);
Comparing the averaged indicatrices J(n, θ)n depicted in the top row, we see that the scattering intensity increases
during the magnetic storm.This increase is rather small, the difference is about 5% of the indicatrix itself. However, this value is significant, since it is obtained by averaging 9000 indicatrices in a cycle. After all, the effect is of the same order of magnitude. It looks similar the turbulent oscillations. storm strength
The difference indicatrices Jn(k,θ)=Jn(k,θ)- Jn(k,θ)kare represented by three groups of dependencies in row 2. The
transition to the difference presentation allow to obtain a clear visual confirmation of the effect. As the graphs proves, the scattering intensifies throughout all the indicatrix, though the most significant effect is observed in the area of small
scattering angles θ which correspond to the size of optical inhomogeneity of the order 0.1 μm.
Also, the cycle divided into fragments makes it possible to estimate the duration of rapid changes of the magnetic storm strength Indicatrix of every k-th fragment is averaged over 900 of the realizations. That implies a reliable determination of their mutual displacement. It follows that the water structure changes noticeably in no more than 30 s. Accordingly, the magnetic storm strength changes at the same pace.
SETUP 2
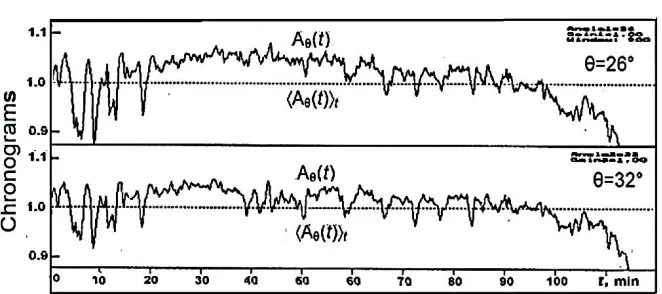
Continuous sounding, ƛ=0.44 μm. Figure 6 represents the chronograms of the scattering amplitude Aθ(t) recorded
simultaneously eith the indicatrices for the angles θ=26º and θ=32º against their averaged values Aθ(t)t.The record lasted
from 1200 to 1400. The averaged amplitudes Aθ(t) t are depicted by a straight dotted horizontal lines. Time in graph is
ISSN(Online): 2319-8753 ISSN (Print): 2347-6710
International Journal of Innovative Research in Science,
Engineering and Technology
(A High Impact Factor, Monthly, Peer Reviewed Journal) Visit: www.ijirset.com
Vol. 7, Issue 8, August 2018
Fig. 6. Water structure changes during magnetic storm on March 20, 2001 (Moscow):: scattering difference amplitudes Aθ(t) for angles θ= 26º (row1) and 32º (row 2)
against the background of their average values Aθ(t),11200 -1400
In the first 20 minutes, the scattering signal increases and oscillates greatly. Then the amplitude grows gradually to a level above the average value, whereas the oscillations decrease. Further the amplitude passes through the maximum and after an hour and a half it descending below the midline. At this stage, the fluctuations decrease as well.
The results obtained with both setups confirm alteration of the scattering indicatrix,.and, accordingly, of the water restructuring during the magnetic storm. This process manifests itself mainly as an increase in quantity of structural
complexes thereof size is about 0.1 μm, like the case oftwo other considered phenomena.
In addition, the results obtained make it possible to quantify certain features of the magnetic storm itself, such as temporal changes in the strength of the magnetic storm, which have already been mentioned. As we have seen, the magnetic storm strength variates within a minute. Chronograms in Fig. 6 provide information concerning much wider period of the variations of the magnetic storm strength, which covers the interval from minutes to hours, to say nothing about the days.
No doubt, the water structure change is a consequence of the magnetic storm strength development.
VI. CONCLUSION
The presented data contain empirical information on the changes of the water structure during some natural phenomena, namely: the Solar eclipse, Moon phases, magnetic storms. There is no theory or prediction of this unexpected changes, and it is not surprising, since there is no generally accepted concept of the water structure. As a result, structural elements of the water could be of various nature, for example, such as the clusters of various sizes, or different microvolumes filled with molecules.
The peculiarity of the problem consisted in determining the changes of what which is not exactly known, and also provided the complete absence of any data for comparison. Therefore, first of all, it was necessary to make sure that such an influence, whatever it was, exists in reality, and the data obtained are not the result of errors. The light scattering techniques was used to solve the problem. Some doubt concerning the justification of the method application might arise because of the strong discrepancy between the dimensions of the measuring tool (the wavelength of the
probing radiation, the order of 1 μm) and the size of the water molecules (10-4μm). Many years of experience with
scattering methods for of laser local diagnostics of plasma, including determination of its composition and structure, came to the rescue.
Reducing the measurement errors is an important step to increase the reliability of the results when we deal with small
However, the scattering indicatrix of the water of various origin looks very different. Following options were examined to select the water with reproducible indicatrix: water from more than ten natural sources, tap water from different Moscow districts, distillate and bidistillate, heavy water, and biological solution. As a result, the tap water from the Northern Water Treatment Station (Moscow) was chosen for the experiments. The water assigned for measurements was filtered and kept under constant conditions for two days. This procedure stabilized the indicatrix and provided good reproducing its parameters.
Thus, it was revealed that the water structure undergoes noticeable changes on the day of the Solar eclipse, as well as during periods of the New Moon and the magnetic storm. Probably, there are other celestial phenomena with the same effect. So far, the impact of celestial phenomena on the water structure was not investigated. As a manifestation of a new mechanism of interaction, it can be of great importance in physics. And we can not exclude the possible dependence of chemical reactions on the water structure, especially in organic chemistry. Finally, the impact on biological processes, in particular, on the state of living beings including humans.is of considerable interest. Now, apparently, this problem should be given more serious attention.
Straining the fantasy, we can imagine existence of some forces, which we do not yet know, but whom we lack to master many of the secrets of the nature and life.
REFERENCES
[1] H.C Van de Hulst.“Light scattering by small particles.” N.Y. J. Willey & Suns, London.Chapman& Hall. 1957. [2] L.N. Pyatnitsky. “Laser Diagnostics of Plasmas.”Plasma Technology. Fundamentals and applications. Ed. M.Capitelli, C. Gorse (Plenum Press. New York. 1991), pp.11-26.
[3] L.N. Pyatnitsky. “Wave Besselian beams” Moscow. URSS/KRASAND. 2014. 400 p. [4] Eclipse.gsfc.nasa.gov/solar.html. Solar Eclipses: 1991 – 2000. (Catalog solareclipses.).
FIGURE LEGENDS
Fig.1. The values of J(θ) and δJ/J(θ) on the day of the Solar eclipse 12.10.1996: λ=0.53 μm; θ=38° (1), 40° (2), 44° (3), and 46° (4)
Fig. 2. Dependence dG(t) for the angles θ=40° and θ=60°, λ=0.53 μm,
October 12, from 1130 to 2130
Fig. 3. Measurement schedule (left) and scattering intensity chronograms Jn(t):
1-4 is cycle number, time t is a thousandth part of the indicatrix recording duration 0.9 s, Jn(t) is ratio of the current intensity to the largest one observed
in experiment, taken as 1000 units
Fig. 4. Spectra of fluctuations (θ=35°) during the New Moon on June 9, 1994
by the dates of their records: 1‒May,30, 2‒June, 3, 3‒June, 6, 4‒June,14
Fig. 5. Water structure changes during magnetic storm on March 20, 2001 (Moscow): average indicatrices Jn(k,θ)k(top); difference indicatrices at 1230, 1300, 1330 (row 2);
Fig. 6. Water structure changes during magnetic storm on March 20, 2001 (Moscow): scattering difference amplitude Aθ(t) for angles θ=26º (row1) and 32º (row 2)
ISSN(Online): 2319-8753 ISSN (Print): 2347-6710
International Journal of Innovative Research in Science,
Engineering and Technology
(A High Impact Factor, Monthly, Peer Reviewed Journal) Visit: www.ijirset.com
Vol. 7, Issue 8, August 2018
Addition for reviewers
I see, there аrеtоо many figures in the paper. To reduce the number, three figures were omitted. One of them (Method, the diagram of device [3]).was replaced by short description and reference to the monograph [3] The second (chronograms, spectra, and ACF for solar eclipse was reducedand replaced by the result description. The text including the indicatrix chronograms for new moon was shortened. Now, to simplify the work of reviewers, all of thesefigures are given in this addition
Here is the diagram of device [3].
Before Fig.1.Indicatrix recording scheme (left):
1laser beam in water, 2centre of the volume under study,3axiconring, 4aperture of view field, 5focusinglens,6CCD-natrix,
αangle of axicon geheratrix, εangle of axicon generatrix giving indicatrix image; on the right - presentation of the results on the control computer screen;
data acquisition and processing system of the computer forms the indicatrix image and. its representation in Cartesian coordinates, as well a some d other information
The scattering indicatrix (λ = 0.44 μm) in water 11.10.1996 ̶̶ 12.10.1996: the upper row-indicatrix J (θ), the middle and lower series-spectra S(f) and,
the autocorrelation functions ACF (f) for the angle θ=38°
The measurement cycle (n,i) included k=1000 indicatrices J(θi).A cycle record lasted 15 minutes, τ=0.9 s for each
angle. Total 4000 indicatrices were recorded, containing 2.44× 10⁵meaningful intensitiesJ(θi). Changes in the water
structure during the eclipse can be seen by comparing the data for the four selected cycles shown in he figure.The top row shows the indicatrix J(θi) for four cycles. In the second and third rows, the scattering intensity fluctuations S (f,
θ=38°) and the autocorrelation functions ACF (f, θ=38°) are givenrespectively.
. The top row contains the indicatrix images for all cycles 1-4. These images of the indicatrices include all 1000 measurements, although the difference between them is virtually indistinguishable in given scale. Their indistinguishability indicates a small experimental error and a good reproducibility of the results. Despite this scale of the image, it is clearly visible that the indicatrix recorded at 1800 (column 3) has some maximum for the angle of
θ=38°.The second and third rows represent spectra S(f) and the autocorrelation functions ACF(f) of the scattering intensity J(θ) found for angle of θ=38°, where the indicatrix peakis located. Comparison of the graphs in columns 1-4 reveals structural changes in the water during the eclipse.. In addition to the peak θ=38°, the spectrum density in columns 2 and especially 3 (the frequencies f<14 Hz) increases, whereas after the eclipse (column 4) the density falls throughout all the frequency range.Differences are also observed in the autocorrelation function. They generally correspond to the behavior of the spectra of indicatrix J(θ=38°).The data of these experiments, as well as the experiments of the previous series, indicate the water structure change during the eclipse of the sun.
Here is the scattering indicatrices recorded during a New Moon phase,
ISSN(Online): 2319-8753 ISSN (Print): 2347-6710
International Journal of Innovative Research in Science,
Engineering and Technology
(A High Impact Factor, Monthly, Peer Reviewed Journal) Visit: www.ijirset.com
Vol. 7, Issue 8, August 2018
Before Fig. 4.Indicaticies of scattered light during the New Moon on June 9, 1994
The image of each of them includes 9000 indicatrices. Each cycle is divided into k=10 parts. Current indicarixJn(k, θ)is
averaged over k-th part, Jn(k,θ)k, The averaging results are shown in this figure. Despite the large number of
indicatrices in each cycle, they have the form of one curve, which indicates a good repeatability.However, in the zone of small angles. θ<15°, the curve differebce is noticeable. It grows to 500, and then quickly decreases, Note, the difference is observed for all angles, but it manifests itself only as a small broadening of the indicatrix, whereas in the
zone of small angles corresponding to the structure dimensions of the order of 0.1 μm, the difference increases sharply. Summary
People have long noticed that the Moon in some phases influences on the man self-feeling. Since water is about 70%
оf the human mass, we tried to find out whether the water is that agent through which this influence is realized.