ISSN(Online): 2319-8753 ISSN (Print): 2347-6710
I
nternational
J
ournal of
I
nnovative
R
esearch in
S
cience,
E
ngineering and
T
echnology
(A High Impact Factor, Monthly, Peer Reviewed Journal)
Visit: www.ijirset.com
Vol. 7, Issue 11, November 2018
Study on Water Characteristics for Network
Analysis in a Pond
Nitu Kumari1, Rekha Kumari2, Jainendra Kumar3.
M.Sc Scholar, Department of Botany, College of Commerce, Arts & Science (Magadh University, Bodh Gaya)
Patna, India1.
M.Sc Scholar, Department of Botany, College of Commerce, Arts & Science (Magadh University, Bodh Gaya)
Patna, India2.
Professor & Former Heard, Department of Botany, Biotechnology, College of Commerce, Arts & Science (Magadh
University, Bodh Gaya) Patna, India3.
ABSTRACT: Despite the continuous decrease in water table, pond water is a good medium for the aquatic organisms to survive. Water quality parameters were analysed and estimated seasonally. Range of different parameters was found as PH-7-8, Temperature- 180c – 320c, Electrical Conductivity – 300 – 410 ms/cm, Transparency – 16.6 – 31 cm, D.O – 4.5 – 7.9 mg/l, B.O.D. – 4.6 – 6.5 mg/l, Ca – 48.01 -104.08 mg/l, Mg – 196.4 – 245.3 mg/l, Phosphate – 0.5 – 1, Nitrates – 0 – 1 mg/l, Total hardness – 200 – 252 mg/l, TDS –220 – 260 mg/l, Turbidity – 25 - 40 NTU, Chlorine content – 17.4 – 56.8 mg/l. In combination with biomass estimation of the organism of different trophic levels, these parameters are to be employed for network analysis of the pond by applying EWE ( Ecopath with Ecosim Version 6.5)
I. INTRODUCTION
India is how known to be facing water scarcity since a few years back. Water is the most essential constituent for the living beings and is a boon for the aquatic Ecosystem. Bihar comprises a huge number of Ponds which contains planktons and organisms of different trophic levels along with the fishes. Water quality affects all the organisms living in and around the pond. The water quality changes day by day and also seasons wise.
II. MATERIAL AND METHODS
STUDY AREA
ISSN(Online): 2319-8753 ISSN (Print): 2347-6710
I
nternational
J
ournal of
I
nnovative
R
esearch in
S
cience,
E
ngineering and
T
echnology
(A High Impact Factor, Monthly, Peer Reviewed Journal)
Visit: www.ijirset.com
Vol. 7, Issue 11, November 2018
Water sample was collected from ‘Mora Talab’ Bihar Sharif at seasonal intervals from December 2017 to August 2018 during winter, summer and monsoon seasons in clean spotless plastic bottles. Closed bottle was inserted in the water and the cap was opened thereafter filling the bottle, cap was closed inside the water. PH, Temperature, Transparency, Turbidity were estimated on the spot by using PH paper, Thermometer, artificial Sechhi disk and Turbidity tube respectively. Conductivity was measured by Conductometer, TDS by TDS meter, D.O. by titration, total hardness, Ca, Mg by using EDTA by Titration, chlorine content by Titration method ,Nitrate by Nitrate test reagent kit and Phosphate by Phosphate test reagent kit.
III. RESULT AND DISCUSSION
PH is a negative logarithm of concentration of Hydrogen ion in a dilute solution. Photosynthesis by green aquatic plants uses H2 and increases PH. Similarly respiration and decomposition lower PH (Mentham, 2000). Too much low or high PH may have adverse effect on the aquatic organisms. Pond water PH was ranged from 7 – 8 which means it is neither more acidic nor more basic. It was found highest range in summer and lowest range in monsoon. Hence, is suitable for the organisms
.
IV. TEMPERATURE
Temperature is a measurement of average kinetic energy of atoms and molecules. It is the factor which influence the other water parameters. A/C to J.R.Brett it is defined as abiotic master function due to its effect on aquatic organism.
Corresponding Author:-NituKumari.
ISSN(Online): 2319-8753 ISSN (Print): 2347-6710
I
nternational
J
ournal of
I
nnovative
R
esearch in
S
cience,
E
ngineering and
T
echnology
(A High Impact Factor, Monthly, Peer Reviewed Journal)
Visit: www.ijirset.com
Vol. 7, Issue 11, November 2018
The range of Temperature was 18oC-32oC. It is found highest in summer season hence decreases D.O. and photosynthesis rate too and increases B.O.D.. During the rainy season since temperature was found lowest so D.O. increases and B.O.D. decreases. It also affects the biomass of the organisms. (Hemlata, 2013)
V. CONDUCTIVITY
It is a measure of water’s capability to pass electrical flow. The more ions that are present, the higher the Conductivity of water. Likewise the fewer ions that are in the water, the less conductive it is. Conductivity is an early indicator of change in water system (A.K Shrestha, 2017). A sudden increase or decrease can indicate pollution. Agricultural run off or a sewage leak may increase Conductivity due to additional chloride, phosphate and nitrate ions. Addition of oil spill or other organic compounds decreases conductivity as they don’t break down into ions. The range of Conductivity was 0.7-0.9 Mohs/cm. The EC was recorded maximum during monsoon season and minimum during summer season.
D.O
It refers to the level of free, non-compound Oxygen present in water. It is produced as a waste product of photosynthesis from phytoplankton. Bacteria and fungi require D.O. for the decomposition of dead and decaying material. Higher decomposed materials indicate the lower level of D.O.
1. D.O. decreases if temperature increases.
2. D.O. decreases expotentially as salt level increases.
3. D.O. increases due to increased pressure.
It affects growth, survival, behaviour and physiology of aquatic organisms. The obtained range of D.O. of the pond water found 2.5 – 5.2 mg/l. It was found highest in monsoon and lowest in summer.
TRANSPARENCY
ISSN(Online): 2319-8753 ISSN (Print): 2347-6710
I
nternational
J
ournal of
I
nnovative
R
esearch in
S
cience,
E
ngineering and
T
echnology
(A High Impact Factor, Monthly, Peer Reviewed Journal)
Visit: www.ijirset.com
Vol. 7, Issue 11, November 2018
B.O.D.
Biochemical oxygen demand which represents the quantity of oxygen consumed by the microbes during aerobic processes of decomposition of organic material (W.Rice, 2005). Increased level of B.O.D shows decreased level of D.O as oxygen is being consumed. Decrease in D.O level may create problem in the survival of the organisms. The obtained range of B.O.D was 4.6 – 6.5 mg/l. The value of B.O.D was found greatest in summer and lowest in monsoon season. Optimum range of B.O.D for fish activity is 3 – 6 mg/l. Hence it is safe for fish population.
TDS
Total dissolved solids, represent the presence of Potassium, Chloride and Sodium, Some toxic substances like dead, Arsenic, Nitrates, Cadmium and some others may also dissolved in water and have long-term effects. Value of Potassium, Chloride shows short term effects and can be rectified or modified. It comprises inorganic salts and small amount of organic matters also.
The estimated value of TDS was 220 – 260 mg/l. Due to the addition of effluents by rain water its highest value was found during rainy season. High TDS may affect the aesthetic quantity of water.
TOTAL HARDNESS
It is parameter which describes the effect of dissolved minerals, calcium and magnesium. It determines the purpose of pond water whether is suitable for industrial or domestic. During the summer season, due to higher rate of evaporation Total hardness value was found more. The present study shows the value of Total hardness was 244.41 – 349.38 mg/l.
CALCIUM
The calculate range was 48.01 – 104.08 mg/l. It was highest in summer and lowest in monsoon. It is important in molting process of Crustaceans. It also helps in the formation of bone and scales of fishes.
MAGNESIUM
It is absorbed in the form of Mg2+ by aquatic livings. Plants may loose colour due to lack of Magnesium. The found range was 196.4 – 245.30 mg/l. Highest in summer and lowest in monsoon season.
TURBIDITY
It is a measure of the degree to which the water loses its Transparency due to the presence of suspended particulates. The more suspended particulates, the higher the turbidity. It is an expression of the amount of light that is scattered by material in the water (Mann, 2007) when a light is shined through water sample. The higher the intensity of scattered light, the higher the Turbidity. Its range was 25 – 40 NTU. The highest value is found during monsoon as the surrounding land may washed into the pond.
PHOSPHATE
Phosphate are the chemical compounds containing Phosphorus. It is also found in animal bones. Lower level of Phosphate limits the algae growth. A large proportion of Phosphate passes through and be released in the fish waste. The range of Phosphate was 0.5 – 1 mg/l. It was found maximum in rainy season might due to the addition of mineral and organic nutrients.
NITRATE
ISSN(Online): 2319-8753 ISSN (Print): 2347-6710
I
nternational
J
ournal of
I
nnovative
R
esearch in
S
cience,
E
ngineering and
T
echnology
(A High Impact Factor, Monthly, Peer Reviewed Journal)
Visit: www.ijirset.com
Vol. 7, Issue 11, November 2018
CHLORINE CONTENT
Chloride ion in the environment can come from the Sodium chloride or from other Chloride salts such as Potassium chloride, Calcium chloride. High Chloride concentration in freshwater can harm aquatic organism as it may interfere osmoregulation. Fishes are less sensitive to Chloride exposure than small free-floating planktonic Crustaceans. The estimated range of chlorine was found 17.4 – 56.8 mg/l. It was found highest during summer season and lowest during rainy season.
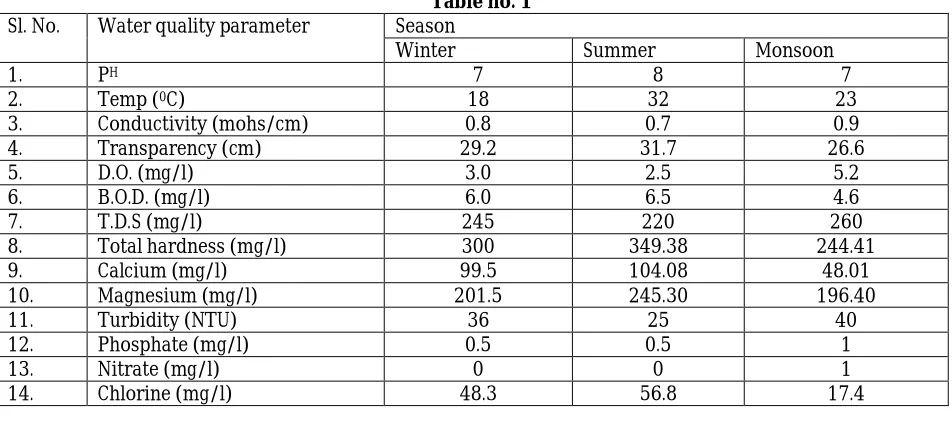
Table no. 1
Sl. No. Water quality parameter Season
Winter Summer Monsoon
1. PH 7 8 7
2. Temp (0C) 18 32 23
3. Conductivity (mohs/cm) 0.8 0.7 0.9
4. Transparency (cm) 29.2 31.7 26.6
5. D.O. (mg/l) 3.0 2.5 5.2
6. B.O.D. (mg/l) 6.0 6.5 4.6
7. T.D.S (mg/l) 245 220 260
8. Total hardness (mg/l) 300 349.38 244.41
9. Calcium (mg/l) 99.5 104.08 48.01
10. Magnesium (mg/l) 201.5 245.30 196.40
11. Turbidity (NTU) 36 25 40
12. Phosphate (mg/l) 0.5 0.5 1
13. Nitrate (mg/l) 0 0 1
14. Chlorine (mg/l) 48.3 56.8 17.4
VI. CONCLUSION
By the view of utilization of water we conclude that it is precious for the human purposes and by the view of ecosystem functions, is mandatory for the aquatic organisms. Due to the lack of sources of water, Pond water can become a good medium for the aquatic ecosystem. The study shows pollution free, good quality and healthy environment of aquatic ecosystem. It is also suitable for ecological productivity and fish productivity.
ACKNOWLEDGEMENT
The author is very grateful to the University Grant Commission (UGC), Government of India and of Bihar. The author is also very grateful to the College of Commerce Arts and Science, Patna, H.O.D. of Botany Department, Director and Lab In-charge of Water Sewage Treatment Plant Anishabad, Patna, Angel scientific store, Patna. They provided me the facilities and equipments by using which my investigation has been carried out successfully under the guidance of Dr.Jainendra Kumar.
REFERENCES
1. Mentham, J; Denny, R.C; Barnes, J.D; Thomas, M.J.K (2000), Vogel’s Quantitative chemical Analysis (6th ed.), New York; Prentice Hall, ISBN 0 – 582 – 22628 – 7, Section 13.23, “Determination of PH”.
2. MahobeHemlata (2013) – Study of physicochemical characteristics of water ponds of Rajnadgaon Town, Chhatisgarh. Intrnational journal of Scientific & Engineering Research, volume 4, 155N2229-5518.
ISSN(Online): 2319-8753 ISSN (Print): 2347-6710
I
nternational
J
ournal of
I
nnovative
R
esearch in
S
cience,
E
ngineering and
T
echnology
(A High Impact Factor, Monthly, Peer Reviewed Journal)
Visit: www.ijirset.com
Vol. 7, Issue 11, November 2018
Washington, DC; American public health association, American water works association and the water environment association.
5. A.G.Mann, C.C. Tam, C.D. Higgins & L.C Lorigues (2007). The association between drinking water turbidity and gastrointestinal illness; a systematie review. BMC public heath. 7 (256): 1 – 7 .
6. Arreguín-Sánchez, F and Manickchand-Heileman, S. 1998 The trophic role of lutjanid fish and impacts of their fisheries in two ecosystems in the Gulf of Mexico. Journal of Fish Biology53: 143-153.
7. Bai, Y. and RongshuoCai, R. 2015 The Principles of Ecopath with Ecosim and its Application in Marine Ecosystem. International Conference on Advances in Energy, Environment and Chemical Engineering (AEECE-2015).
8. Bauer, M. 2010 An ecosystem model of the Sacramento-San Joaquin Delta and Suisun bay, California, USA. A Project Presented to the Faculty of California State University, Chico. In Partial Fulfillment of the Requirements for the Degree Master of Science in Environmental Science: Professional Science Master Option.
9. Christensen, V. and Pauly, D.1992. ECOPATH II - a software for balancing steady-state models and calculating network characteristics. Ecol. Modelling 61:169-185.
10. Dubey, R.S, and Dubey, A.R. 2015 Effect of idols immersion on anthropogenic influenced ritual ponds water quality at holy city Varanasi. International journal of Engineering sciences & research technology4(12): 656-665.
11. Field, J. G., Wulff, F. and Mann, K. H. 1989 The need to analyze ecological networks.In: Wulff, F.; Field, J. G. and Mann. K. H. (eds.) Network analysis in marine ecology: methods and applications. Coastal and estuarine studies32 Springer-Verlag, Heidelberg, p. 3-12.
12. Finn, J. T 1976 Measures of ecosystem structure and function derived from analysis of flows. J. theoretBiol56:363-380. 13. Hannon, B. 1973 The structure of ecosystems. J. theoret. Biol.41: 535-546.
14. ICAR (Indian Council of Agriculture Research) 2011 Fisheries Development in Bihar: An Action Plan. Retrieved from http://ahd.bih.nic.in/Docs/ICAR-Report-Fisheries-Dev-Bihar.pdf on 2.02.2016.
15. Kay, J. J., Graham, L. A. and Ulanowicz, R. E. 1989 A detailed guide to network analysis. In: Wulff, F., Field, J. G. and Mann, K. H. (eds.) Network analysis in marine ecology: methods and applications. Coastal and estuarine studies32 Springer-Verlag, Heidelberg, p. 15-61. 16. Kiran, A. 2013 Dynamic modeling of fish population in some North Bihar rivers and ponds in reference to their water quality. Thesis submitted
for the degree of Doctor of Philosophy in the faculty of Science under Magadh University, Bodh Gaya (Bihar), India.
17. Kiran, A. 2013 Dynamic modeling of fish population in some North Bihar rivers and ponds in reference to their water quality. Thesis submitted for the degree of Doctor of Philosophy in the faculty of Science under Magadh University, Bodh Gaya (Bihar), India.
18. Kumar, J., Kiran, A. and Singh, A.K. 2011 Study of energy flow and ecosystem modeling in the river Khadag of North Bihar (India). Int. J. Mendel 28(1-4):31-33.
19. Kumar, J., Kumar, P., Sheel, R. and Kumar, M. 2012 Analytical study of some wetlands for their strategic conservation and positive utilization. IOSR-JESTFT 1(2):10-20. ISSN 21019-2402X.