Analysis and Assessment of Solid Waste
Management through Field Approach
Hema H C1, H J Surendra2, Nagasahadevareddy K 3
GIS Consultant, Bangalore, Karnataka, India1
Department of Civil Engineering, ATRIA IT, Bangalore, Karnataka, India2
Department of Civil Engineering, SRSIT, Bangalore, Karnataka, India3
ABSTRACT: Managing the solid waste is really a big challenge all over the world for human beings. Increase in the solid waste in municipal area due to rise of living standard, rapid urbanization, commercial activities, cultural status etc need to manage effectively, since it may threat to nature and source for several diseases. Municipal solid waste management problem is also prevailing in the urban environment of Bangalore. Therefore the present research work was taken to find out the problems and prospects of Municipal solid waste in few areas of Bangalore city. This study helps to understand the present condition with respect to collection, storage, transportation of municipal solid waste. The data were collected through field visit, interacting with people and concerned authorities. In this work 12 blocks
were identified to analyze the present situation in the block. Evidences of photograph were also made about
generation, storage, collection, transportation of solid waste. This study reveals that the present system may not satisfactory for managing and handling solid waste due to shortfall of vehicle and time management.
KEYWORDS: Analysis, Assessment, Field approach, solid waste management.
I. INTRODUCTION
II. STUDY AREA
The present study area chosen for the study is Ulsoor. Ulsoor, is one of the oldest neighborhood in the city of Bangalore, Karnataka, India, located 12.97º N, 77.63º E in central Bangalore and being roughly near the eastern terminus of Mahatma Gandhi road. It is renowned for its numerous temples and rather narrow streets.
2.1FILED VISIT REPORT
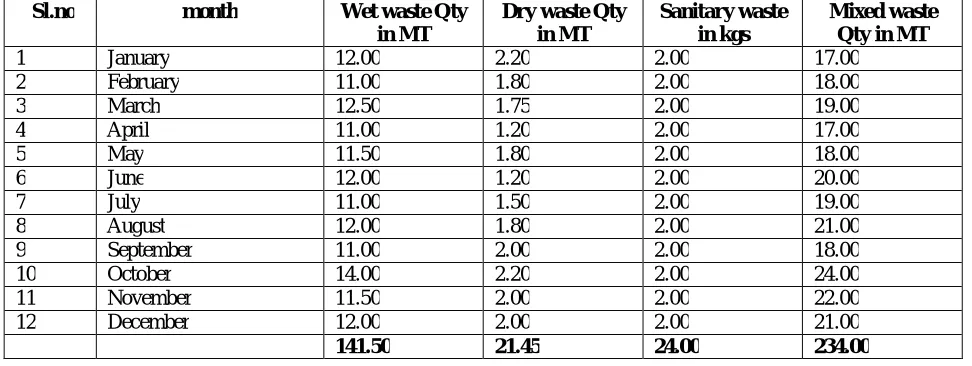
The average production of waste generated in the year 2017 is collected and used for analysis. The segregation is done in dumping yards which is divided into four categories. The wastes are collected in the ward without any segregation leads to major difficulty in segregation. In the month of October the waste generated will be more due to festival seasons. Month wise statistics of waste generated for the year 2017 is represented in the table 1. The wastes disposed in various locations are shown in the figure 1 to figure 5.
Table 1: Month wise statistics of waste generated report
Sl.no month Wet waste Qty in MT
Dry waste Qty in MT
Sanitary waste in kgs
Mixed waste Qty in MT
1 January 12.00 2.20 2.00 17.00
2 February 11.00 1.80 2.00 18.00
3 March 12.50 1.75 2.00 19.00
4 April 11.00 1.20 2.00 17.00
5 May 11.50 1.80 2.00 18.00
6 June 12.00 1.20 2.00 20.00
7 July 11.00 1.50 2.00 19.00
8 August 12.00 1.80 2.00 21.00
9 September 11.00 2.00 2.00 18.00
10 October 14.00 2.20 2.00 24.00
11 November 11.50 2.00 2.00 22.00
12 December 12.00 2.00 2.00 21.00
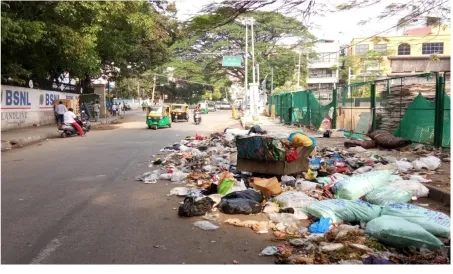
Figure 3: Waste dumped near road side
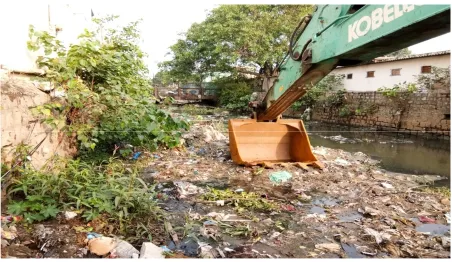
Figure 5: Waste dumped in Drain
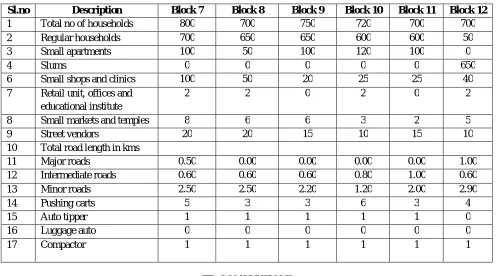
2.2 BLOCK WISE STATISTICS AND ITS DESCRIPTION
The major black spots are seen more in the area, which includes drains and three major sites. The drains affect the lake and environment. Even though waste are collected by the auto rickshaws daily in morning, still some sort of the waste are dumped in the area. As the available number of vehicles for collection of waste is less, the area covered by each vehicle is more. Hence lack of time management in the waste collection leads to dumping of waste along the road. The truck will be in the site for morning 1 hour as per the field survey.
6 Small shops and clinics 10 8 20 4 15 20
7 Retail unit, offices and educational institute
0 4 2 3 0 4
8 Small markets and temples
4 3 4 2 0 1
9 Street vendors 10 8 15 10 6 5
10 Total road length in kms
11 Major roads 0.50 0.50 0.30 0.60 0.50 0.80
12 Intermediate roads 0.50 0.60 0.30 0.60 0.40 0.50
13 Minor roads 0.80 0.50 0.90 0.70 1.00 1.00
14 Pushing carts 2 3 2 2 2 3
15 Auto tipper 1 1 1 1 1 1
16 Luggage auto 0 0 0 0 0 0
17 Compactor 1 1 1 1 1 1
Table 3: Block wise statistics (Block number 7 to block number 12)
Sl.no Description Block 7 Block 8 Block 9 Block 10 Block 11 Block 12
1 Total no of households 800 700 750 720 700 700
2 Regular households 700 650 650 600 600 50
3 Small apartments 100 50 100 120 100 0
4 Slums 0 0 0 0 0 650
6 Small shops and clinics 100 50 20 25 25 40
7 Retail unit, offices and educational institute
2 2 0 2 0 2
8 Small markets and temples 8 6 6 3 2 5
9 Street vendors 20 20 15 10 15 10
10 Total road length in kms
11 Major roads 0.50 0.00 0.00 0.00 0.00 1.00
12 Intermediate roads 0.60 0.60 0.60 0.80 1.00 0.60
13 Minor roads 2.50 2.50 2.20 1.20 2.00 2.90
14 Pushing carts 5 3 3 6 3 4
15 Auto tipper 1 1 1 1 1 0
16 Luggage auto 0 0 0 0 0 0
17 Compactor 1 1 1 1 1 1
III. CONCLUSIONS
waste collection, hence waste bins locations were identified in the ward. The numbers of vehicles available to carry the waste were also less; hence waste availability will be enormous in prominent places. For better environment and to improve the aesthetic appearance of the city, proper time management of waste collection are necessary.
REFERENCES
[1]. Dancan M, Martin G. “Application of GIS and Remote sensing technologies in Solid Waste Management: A Case study of Nyahururu Municipality”. Volume 5 , Issue 4 , April 2016.
[2]. Jerry Dean Greer. “Natural Resource Management using Remote Sensing and GIS”.
[3]. H.J. Surendra, Deka P C and Kavya B M (2017), “Improved Framework for modeling Municipal Residential Water Consumption Estimation using Wavelet-Mamdani Fuzzy approach”. International Journal of Advance research in science and engineering, Vol.no 6, Issue .No 8, ISSN(O):2319-8354, ISSN(P): 2319-8346 August 2017.
[4]. H.J. Surendra, Paresh Chandra Deka (2012), “Effects of Statistical Properties of Data Set in Predicting Performance of Various Artificial Intelligence Techniques for Urban Water Consumption Time Series”. International Journal of Civil Engineering and Technology, volume 3, Issue- 2, July- December (2012), PP-426-436.
[5]. H.J.Ningaraju, Ganesh Kumar S.B and H.J. Surendra (2016), “Estimation of Runoff Using SCS-CN and GIS method in un-gaugedwatershed: A case study of Kharadya mill watershed, India”. International Journal of Advanced Engineering Research and Science ISSN: 2349-6495.
[6]. Kumar N., Yamaç S.S. and Velmurugan A. “Applications of Remote Sensing and GIS in Natural Resource Management”. [7]. KoKoLwin. “Fundamentals of Remote Sensing and its Applications in GIS”.2008.
[8]. Sivasankar SV. KuppuRathinam. “Application of Remote Sensing and GIS in Solid Waste Management: A Case Study of Mellur Municipality, India” . Volume 6 , Issue 8 , August 2017.
[9]. SATHISKUMAR R and RAMACHANDRA, T.V. Solid waste management system using spatial analysis tool.
[10]. Shweta Karsauliya. “Application of Remote Sensing and GIS in Solid Waste Management: A Case Study of Surroundings of River Yamuna, India”.