MAAP4 P R E D I C T I O N OF THE DCH I N T E G R A L E F F E C T S TESTS
W. Luangdilok* and R.E. HenryFauske & Associates, Inc., Burr Ridge, IL. ( * also Adjunct Professor, Faculty of Engineering, University of Regina, Canada)
ABSTRACT
This paper deals with the development of direct containmem heating (DCH) model for the MAAP4 code and its benchmarking with the integral effects tests (IETs), the most comprehensive experiments to date carried out by the NRC to resolve the long-standing severe accident issue of DCH. The experiments selected for benchmarking were IET-1, IET-8B, IET-10, U1A, and U2. This selection covers: (1) all sizes (1/40, 1/10, and 1/6 linear scale) of containment models used in the IET series, (2) conditions with and without hydrogen combustion, and (3) conditions with and without prototypic core materials. In all five cases, the MAAP4 calculations correctly follow the pressure and temperature trends and can predict the DCH pressures to within 15% or better. Better comparison was obtained with IET-10 in which de-entrainment is negligible due to a Surry-type cavity design that results in a straight blowdown flow path to the sub-compartment. This paper demonstrates that MAAP4 is capable of predicting the dynamics of DCH pressure loads observed in small- and large-scale experiments with a reasonable accuracy.
INTRODUCTION
The Integral Effects Tests were part of an NRC experimental program represented a major effort involving the coordination of three research organizations (Sandia National Laboratories, Argonne National Laboratory, and Purdue University) performing integral and separate effects tests to resolve the long-standing severe accident issue of DCH. Counterpart experiments conducted at Sandia and Argonne at different scales (1/40, 1/10, and 1/6 linear scale) provided an extensive database [1-9] for understanding fundamental and integral behavior of DCH phenomena. The fundamental behavior, repeatedly demonstrated in the IET tests, that was key to resolving the issue, was the phenomena by which intermediate sub-compartments in the containment trap most of the debris dispersed from the reactor cavity. Further it was demonstrated that there is incoherence in the steam blowdown and melt entrainment process that the mechanism to transfer the bulk of the sensible energy of the melt to the containment atmosphere is quite limited.
Using these insights as the basis for simplified equilibrium models (and a more complex transient code model), the NRC evaluations of nuclear plants concluded that the conditional containment failure probability for most large dry and sub- atmospheric plants was negligible [10-14], and that the ice condenser plants are substantially more vulnerable to early containment failure than large dry containments, and that this vulnerability is not confined to DCH but includes other phenomena, such as hydrogen combustion [ 15]. Based on these evaluations, the NRC issued the research information letter RIL-0005 declaring the completion of research to address DCH on September 29, 2000.
Direct containment heating, once a long-standing concern in the NRC's consideration of severe accidents, is a severe accident terminology which collectively refers to four mechanisms that may cause a rapid increase in pressure and temperature in the reactor containment: (1) blowdown of the RCS at high pressure, (2) efficient debris-to-gas heat transfer, (3) exothermic metal/steam reactions, and (4) hydrogen combustion. DCH is a consequence of a chain of events called a high pressure melt ejection (HPME) in which molten core debris is expelled from a failure, in the bottom head of the RPV at high pressure, followed by a high-pressure blowdown of steam and entrainment of molten core debris into the high-velocity blowdown stream. Predicting the containment pressure and temperature loads during DCH had been technically very challenging due to the complexity of the phenomena. However, recent (1999) efforts in MAAP4 development have lead the code to be capable of predicting the dynamics of DCH loads observed in IET experiments.
In all IET tests, high-temperature, chemically reactive melt (either thermite for large 1/10 and 1/6 scales or corium for small 1/40 scale) was ejected from a melt generator by high-pressure steam into a scale model of a reactor cavity, geometrically typical of the Zion and Surry nuclear power plants. Debris was entrained by the steam blowdown into a large test vessel simulating a reactor containment building. For the Zion geometry, a model containment at Sandia with the internal structure at a linear scale of 1/10, as well as a 1/40 linear scale at Argonne with prototypic core materials, were used in the tests. For the Surry geometry, a 1/6 linear scale model at Sandia was used. All tests at Sandia used thermite melt as a molten debris, but geometrically a very large scale. On the other hand, tests at Argonne were performed with corium, but at a much smaller scale. The effects of specific phenomena on the containment load that can be integrally examined from the IET tests include the effect of: (1) physical scale, (2) prototypical sub-compartment structures, (3) water in the cavity and in the lower containment floor, (4) efficient debris-to-gas heat transfer, (5) exothermic metal/steam reactions, and (6) hydrogen combustion. Benchmarking results of five experiments, IET-1, IET-8B, IET-10, U1A, and U2 are presented in the paper. The first three tests representing a large-scale thermite series covered a blowdown pressure from 6 to 12 MPa, while the other
Page 1
~i ¸ ~ ~ L~, =/
SMiRT 16, Washington DC, August 2001 Paper # 1080
two tests represent the case of using actual reactor materials at lower blowdown pressures. Most experiments had all the effects mentioned above, with the exception of intentional suppression of hydrogen combustion in some experiments.
The key factors in good prediction of the phenomena are the modeling of several sub-processes which include: (1) partial debris quenching in cavity, (2) debris dispersal from cavity, (3) entrainment and heat transfer time scales, (4) de- entrainment, (5) energy available from entrained debris, and (6) high intensity jet burn.
M O D E L I N G BASIS F O R DCH C A L C U L A T I O N
The MAAP4 code takes a dual approach in DCH modeling. The two approaches are almost identical in the treatment of key sub-processes mentioned above, with the exception of debris dispersal and entrainment time. The first approach is based on the formulation of debris dispersal from first principles by Henry [16], and the formulation of the entrainment time from an isothermal blowdown. The second approach is based on the correlation of basic experimental data for debris dispersal and an isentropic blowdown for entrainment time established by Kim [ 17]. The two approaches yield similar results, with Henry's approach tends to over-predict Kim's approach. Here, Henry's approach will be discussed to demonstrate the modeling basis used in the code. According to Henry's work on debris dispersal; the mass of molten debris that could be entrained as finely particulated particles during HPME from the reactor cavity is given by:
I
(1)
m o = 0.19 A v Pv Lp L Po " ~ ~,-~g)
The entrainment of this molten debris mass occurs during an entrainment time (t~) defined as a time duration in which a blowdown gas velocity exceeds a minimum entrainment velocity (Uent). Uen t is given by:
1~
)11/4
Uen t "-
2.46(2)
The size of entrained particles is assumed to follow the Weber number criterion of 10.
For a cavity design that puts some fluid dynamical constraints on the blowdown flow, there is an option to consider a de-entrainment calculation so that an effective debris mass contributed to DCH becomes
moc H = ( l - r l d e ) m o (3)
where rlae is a de-entrainment efficiency, and can be calculated by the seal table de-entrainment model [ 18] for a flow path with a 90 ° turn at cavity exit.
There are two components in debris energy available for transfer: (1) oxidation heat, and (2) sensible and latent heat. The oxidation heat (Qox) is the sum of heat of the following metal-steam reactions: 1) Zr + 2H20 ---, ZrOz + 2H2 (Qzr = 616 MJ/kg-mol), 2) 2Cr + 3H20 ---* Cr203 + 3H2 (Qcr = 200 MJ/kg-mol), 3) Fe + HzO ---* FeO + H2 (Qve = 24 MJ/kg-mol), and 4) Ni + H20 ~ NiO + H2 (QNi = 2.35 MJ/kg-mol) (which can be neglected). Namely,
(
(~ox,Zr fZr Qzr
(~ox,Cr fCr Qcr
~)ox Fe fFe QFe~
Qox = motH + + ' (4)
Mzr
Mcr
MFe
)
I
where ~ox is a fraction of metal in the entrained debris (after de-entrainment, if any) that would be oxidized during HPME, f is a mass fraction, and M is an atomic weight. The extent of debris oxidation in the DCH model plays a major role in the calculated DCH pressure rise, as well as the amount of hydrogen gas generated during the HPME process. Inclusion of the oxidation model to the overall DCH model enables the MAAP4 code to predict successfully most IET experiments with good agreement.
The overall oxidation rate for Zr-water reaction is well known and extensively used in MAAP for in-core oxidation of damaged fuel clad. The rate can be expressed in a form x = ~/K t o that reflects the existence of a rate-limiting oxide layer [ 19, 20]. Here, x is thickness of oxide layer in meter, to is an oxidation time in seconds (in this case, an entrainment time is
Page 2
assumed), and K is the Arrhenius rate constant, Kzr : 2.07 x l 0 -6 exp (-1.6014 x 10⁴ / T D ).
The overall oxidation rate for stainless steel-water reaction also takes the square-root form, but with a larger rate constant KFe = 11.424 exp ( - 42451 / T D ). For experiments using thermite to generate melt, aluminum is used to simulate reactive metal in place of zirconium. The heat of oxidation for aluminum is 80% of zirconium (QA1 = 496 MJ/kg-mol). The overall oxidation rate for aluminum-water reaction is slowest among the three metals considered here. The growth of the oxide is proportional to the cubic root of oxidation time x = (K t o )1/3 with the Arrhenius rate constant smaller than that of Zr and Fe, K Al = 2 x 10 -6 exp ( - 36990.44/T D ).
Given an entrainment time and debris temperature TD (K), the extent of oxidation can be calculated by knowing the thickness of oxide layer. For a spherical debris particle with a nominal radius r, the fraction of the particle undergoing oxidation is given by
( x)3
~ox = 1 - 1 - (5)
The debris particle oxidation model described above is used to calculate the fraction of oxidation of each metal. Once the oxidation fraction is calculated, it is applied to the entire mass of debris that was initially entrained. That is, it is assumed that all initially entrained debris would be oxidized, even if some of them may be de-entrained.
In order to determine contribution from the sensible and latent heat, it is assumed thermal equilibration of entrained debris with gases from 3 sources that actually involve in the process, i.e., gases in the cavity, gases in the sub-compartment, and steam blowdown from the primary system during the DCH time scale. The blowdown mass (Am) is estimated by an isothermal process as:
te/X )
Am = P v V l - e - (6)
with 1 = C a3 t ° A v JYPv ( 7 )
, x V ~/Pv
where Pv is density of gas in the primary system, V is primary system blowdown volume, Ca is discharge coefficient, te is DCH entrainment time scale, Pv is primary system pressure when blowdown begins, Av is vessel failure area, 3, is Cp / Cv for steam, and ~/o = 0.585 for steam. The thermal equilibration assumption leads to the f'mal debris temperature (Tf):
mDCH (CD TD + Q L ) + m s t
Ust
(Ti)+ mg CvTi + Am(Ust ( T ) - U r e f +C s Tree) + Qox
Tf
- _ ( 8 )mg C v + (mst + Am)C s + mDC H C D
where
QL
is the latent heat of fusion of molten debris, CD is the specific heat capacity of debris, 1Tlst is the mass of steam in sub-compartment at time of blowdown, Cs is the specific heat capacity of steam, Ust is the specific internal energy of steam, Tv is primary system gas temperature, andTree
is reference temperature (273 K). Hence, the amount of energ~ available for transfer is:E ° = m D c H ( C D ( T D - T f ) + Q L ) + Q o x (9)
During a high pressure vessel blowdown, gas velocity in the cavity may exceed a minimum velocity (i.e., entrainment velocity, Went, defined in equation (3)) required for entrainment of debris into the blowdown stream. Entrainment will continue to occur until gas velocity drops below Went. This happens when the blowdown pressure drops to Pmin, a minimum value required to produce a gas velocity of magnitude Wen t in the cavity. The corresponding minimum gas flow rate (Wmin) in the cavity is then given by:
Wmin =
Pc AcUent
(10)where Pc is gas density in cavity, and A¢ is cavity flow area. Wmin can be equated to a minimum blowdown flow as:
Wmin
=
Ca Av yo 4, / PminP min
(11)Equating equation (10) to equation (11), Pmin is found to be:
- p c A c U e n t
ff~ Tmin
Pmin -
C d
30 Av Mw (12)Assuming an isothermal blowdown, the time (te) that it would take for the blowdown pressure to drop from initial pressure Pv to Pmi, is given by:
t e : x l n P (13)
Pmin
Since Pmin is the minimum vessel pressure that produces entrainment in the cavity, te is then the time period within which entrainment occurs. Hence, te is an effective entrainment time. An entrainment time is a very important parameter. It is the time scale the metal-steam reaction that produces hydrogen is assumed to take place. An entrainment time is also the time scale during which energy transfer from entrained debris to gas is assumed to occur.
Energy Transfer Rate
If Eo is the amount of DCH energy to be transferred to the gas phase within an entrainment time scale (te), we may assume that energy transfer will occur in an exponential form:
c t / t e
)
E ( t ) = E o l - e - (14)
with a transfer rate of." d E = c E o e - c t / t e (15)
dt t o
where c is a constant dictating how fast the transfer rate would be. Here, c = 3.5 is chosen, which corresponds to 97% energy transfer within a DCH time scale te.
High Intensity Hydrogen Jet Burn
About 1/2 to 2/3 of DCH energy comes from intensive burning of hydrogen-rich jet as it passes from the sub- compartment to the large open area of the upper compartment. Due to transfer of sensible and latent heat to gases in the cavity and sub-compartment, the gas temperature in the sub-compartment could go above auto-ignition temperature that causes the jet to bum as it enters oxygen-rich region. The burning of hydrogen jet during DCH is controlled by a jet burning factor which physically represents the effects of turbulent jet that enhances the burning rate. It is simply a multiplier to the jet flow rate. A much more comprehensive model of jet ignition with calculates jet turbulence intensity factor has been developed for the next generation MAAP code [22], but was not used in this benchmark.
E X P E R I M E N T A L I N S I G H T AND M O D E L I M P L E M E N T A T I O N
Examination of all HPME/DCH-related individual processes in the MAAP4 code were performed during the course of this work for their contribution to the integrated results. Particular attention for improvement was made related to DCH sub-processes and hydrogen combustion. These key points are described below.
Debris Quenching and Dispersal from Cavity
In all 1/10 scale lET tests [3], there was no complete dispersal of debris from the cavity. Even for tests with steam driving pressure of about 6 MPa or above, the fraction of debris not dispersed from the cavity ranged from 12 to 37%. In all
tests, there was some amount of water in the cavity that would quench a portion of the debris jet when expelled from the crucible. The frozen portion of the debris would not be entrained by the steam blowdown.
On the other hand, depending on the blowdown pressure, Henry's model can predict total dispersal, while Kim's model restricts the dispersal to only 80% of debris in the cavity. Clearly, this is a problem of implementation. Henry's model assumes that the debris is molten. Hence, its correct implementation should use only the molten portion of the debris. Kim's model already assumes 20% retention of debris, but may not cover a situation when the debris is frozen more than 20%. Hence, the implementation of Kim's model should also include only the molten portion of the debris if the frozen fraction is greater than 20%. It is noted that, in a situation where there is no water in the cavity and the debris is fully molten, Kim's model would still calculate a dispersal of no more than 80%.
Entrainment and Heat Transfer Time Scales
A typical debris dispersal time scale calculated by Henry's model for the IET facility length scale was about 40~50 ms. An implementation that assumes this time to be the time scale for efficient debris-to-gas heat transfer would suffer. The IET results suggest that the dispersal and the heat transfer occurred at about the same time with 0.4 s for dispersal and 0.6 s for rapid heat transfer following the completion of melt ejection. The heat transfer time scale is much longer than the dispersal time given by Henry's model. This is a problem of implementation since Henry's model only deals with time available for entrainment during debris dispersal, not the heat transfer time. To resolve this shortfall, a recipe for calculating effective entrainment time was introduced. This entrainment time is then assumed to represent the heat transfer time scale which is used to determine energy transfer rate. The entrainment times for the 1/10 scale IET tests were 1.7~2.4 seconds. This implementation puts the code in good standing on the benchmark.
De-Entrainment Model
The IET report [3] suggested that only 27.8% DCH efficiency for IET-1 and 26.8% for IET-8B contributed to the pressure rise. On the other hand, about 80% entrainment of molten debris would be predicted by Henry's and Kim's. Hence, de-entrainment is an important individual sub-process within the DCH phenomena. Implementation of Henry's and Kim's models should provide a means to address these uncertainties in the de-entrainment process. This can be done by using the seal table de-entrainment model [18] which was formulated for a cavity with geometry of a Zion nuclear plant. Its applicability should span to any design that results in a 90 ° change in the blowdown flow direction at the tunnel exit. The model is presented in the following form:
1 l n l l I --~ ( w / 1t
~ld e = - " ~ ~ + ~ W -- -- 1 qde (16)
where 4 ~ r -~-D Cdr
3(1)0g
(17)Energy Available from Entrained Debris
There are two components in debris energy available for transfer: (1) sensible and latent heat and (2) oxidation heat. Any combination of these two components can yield reasonable results as long as the total energy is conserved. Further examination of these energy components suggests that extensive release of oxidation heat from entrained debris should be the call. In IET-1 based on 30 min. measurement, about 38% of all metallic components in the thermite was oxidized. This figure went up to 49% in IET-8B (but the measurement time was at 900 mins) and more than 60% in IET-10 (measured at 15 s). Furthermore, for IET-8B and IET-10, the amount of hydrogen burned was close to the amount produced. This somehow indicates that most hydrogen-producing oxidation reactions occurred during the DCH time scale. Therefore, to be consistent with experiments, a near-100% metallic oxidation of entrained debris should be expected.
INTEGRAL EFFECTS TESTS (IET)
Two Zion-type IET tests (IET-1 and IET-8B), one Sma 3, type IET-10 test, and two Zion-type U1A and U2 tests using corium were chosen for the benchmark. IET-8B, IET-10, and U2 were tests with all the effects mentioned earlier, while IET-1 and U1A represented the tests from which hydrogen combustion and the presence of water in the sub- containment floor were excluded. However, the significant factor on the DCH load between the tests lies in whether hydrogen combustion occurred or not. The test facility is shown in Figures 1, 2, and 3. Table 1, compiled from data in [3, 4, 5, 21 ], lists initial conditions for selected IET experiments.
Surtsey Vessel
@
Level 65
Support Structure
Concrete Structure
/ Representing the
OperaUng Deck
/ Manway
Concrete Wall
RepresenUng the Crane Wall
...--- False Floor Representing the Containment
• Basement
i~,..~ ...::~1:6,;~..~. Y..':::;~..
Boiler Accumulator 1:10 $¢81e Zion Cavity
Figure 1 : 1 / 1 0 Linear Scale IET Test Facility [3].
3.10
CT'rF CONTAINMENT
VESSEL
1.36
1.02 m
0.17 m
RHR
PLATFORM WALL
)I.OGICAL SHIELD
Figure 2 : 1 / 6 Linear Scale IET Test Facility [4].
BENCHMARK RESULTS
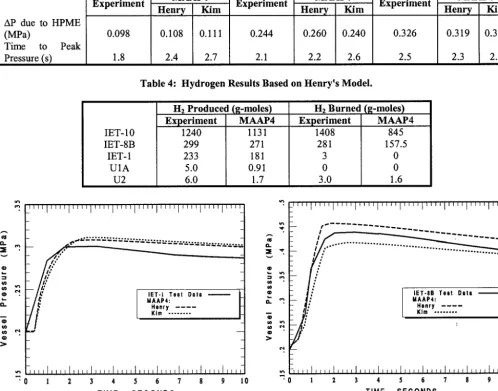
To perform MAAP4 bench- mark runs of the lET experiments, the code needed to be set up so that: (1) the high-pressure steam accumulator behaves like a reactor primary system, (2) the ejection of thermite from the crucible behaves like that of vessel failure, (3) corium properties are replaced by thermite properties, and (4) various gas composition (see Table 1) in the test vessel can be input to the code. The MAAP4 parameter file was used to handle all inputs related to containment nodalization which splits the containment vessel into 4 nodes, as shown in Figure 4. Benchmarking was performed with five selected tests. Some key results are summarized in Tables 2, 3, and 4.
IET-1 and IET-8B (1/10 Scale)
The two tests used the same amount of thermite with a driving steam pressure of 7.1 MPa for IET-1, and 6.2 MPa for IET-8B. These driving pressures were high enough to cause substantial dispersal. Hydrogen burning was prevented in IET-1 by inerting the vessel atmosphere. In IET-8B, not only that hydrogen combustion was allowed, but the initial gas atmosphere also contained a 3.9 vol.% hydrogen gas, i.e., just slightly below the flammability limit.
IET-1 provides a good data- base for benchmarking the DCH model without the pressure contribution from hydrogen combustion. This is an important point since the pressure increase in IET-1 was only 40% of that in IET-8B. Hence, at least 60% of the pressure increase in IET-8B would come from a combination of hydrogen combustion and vaporization of water in the cavity. There was as little as 3.48 kg of water in the cavity of IET-1, and 62 kg of water in IET-8B to render a more steaming effect. However, MAAP4's debris quenching model predicted only a small fraction of steaming during the melt ejection period for IET-8B. Within the context of MAAP4 interpretation, hydrogen burning must be a major factor in the pressure increase. Figure 5 compares
. . . :
~1[A. ] RUPTURE DISK . i VOLUME .' 1 . 1 cu. Merensl
\ I 1421 PSI 0 550 F _ - - - , ~ - , ± I
,,,,,,
[ T
S~E^Mvo,o., lul--- i r
j
J
I'l
iLa
[
I I VALVE XBLEED - : ~ l
VALVE
I
o I -
I
STEAM GENERATOR DRAWING: DCll SYSTEM DRAWING N O . : OCH9
DRAWN BY: O. KILSDONK DATE: 1 1 2 0 1 9 3 F I L E : $ Y S T E M . F C D ( 8 0 )
Figure 3 : 1 / 4 0 Linear Scale IET Test Facility [5].
Node 4
Surtsey
Vessel
Node 1
Accumulator
J
l
, |Node 3
I
Subeompartment]Node 2
1
CavityW I , I J O I N ~ . O O R 1,,11,418
Figure 4: Nodalization of the IET
Containment.
Table 1: Initial Conditions for Selected IET Experiments.
Melt Composition (kg) A1203 Fe Cr A1 IET-1 14.62 22.36 4.73 1.29 IET-8B 14.62 22.36 4.73 1.29 IET-10 63.18 77.74 17.08 0 U1A Corium*
Thermite Energy: Latent and Sensible Heat (MJ) Gas Pressure at Plug Failure (MPa)
Gas Temperature at Plug Failure (K) Initial Hole Diameter (cm)
Water in Cavity (k~)
Water on Sub-Compartment Floor (k~) Pressure in Sub-Compartment (MPa) Temperature in Sub-Compartment (K) Initial Gas Composition in Surtsey (mol.%)
Steam N2 02 H2 CO COz Other Linear Scale
Freeboard Volume Inside Sub-Compartment Structures (m 3)
Freeboard Volume in Upper Dome (m 3) Total Freeboard Volume (m 3)
95.27 7.1 600 95.27 6.2 554 289.9 12.1 713 1.356 600 U2 Corium* 1.356 4.3 600
3.5 3.5 7.0 1.1 1.1
3.48 62.0 0.057 0.057
0 ] 71.1 0 0
0.2 0.179
410 48.20 38.47 10.17 01.98 00.51 00.21 00.46 1:6 33.3 252.7 286.0 295
0.2 0.2
300 0.0 99.0 0.6 0.0 N/A N/A 0.4 1:40 72.66 x 10 .3
1.434 1.51 298 0.0 85.8 9.79 3.91 N/A 0.03 0.47 1:10 4.65 85.15 89.8 0.0 99.9 0.03 0.0 N/A 0.01 0.06 1:10 4.65 85.15 89.8
* Corium = 57.8% U O 2 n t- 13.7% Zr + 10.3% ZrO2 + 14.3% Fe + 3.7% Cr.
0.2 301
0.0 84.6 i 11.6 2.6 N/A N/A 1.2 1:40 72.66 x 10 -3
1.434 1.51
Table 2: Summary of Key Parameters from MAAP4 Results Based on Henry's Model. Variable Name TCMTC XRP TDSET FOXENT FOXZR FOXSS NH2GEN FSOL FDCH Description
Debris temp, K Particle radius, ~tm Entrainment time, s Fraction of debris oxidized Fraction of A1 or Zr oxidized* Fraction of SS oxidized Hydrogen produced, g-mole Fraction of debris that is solid
Fraction of debris successfully entrained
IET-10 1896 35 2.432 0.6 0 1.0 110.31 0.4 0.6 IET-8B 1937 159 1.506 0.654 0.0467 0.838 271 0.34 0.04 IET-1 2157 93 1.74 0.66 0.155 1.0 180.6 0.34 0.04 U1A 2600 433 0.228 0.279 0.194 1.0 0.97 0.683 0.64 x 10 -3
U2 2600 211 0.319 0.317 0.425 1.0 1.7 0.683
1.5 x 10 -3 * A1 for lET- 1 and IET-8B, Zr for U 1A and U2. There was no excess aluminum metal in lET- 10.
AP due to HPME (MPa)
Time to Peak
Pressure (s)
Table 3: Results Comparison.
IET-1
Experiment
0.098
1.8
MAAP4
Henry [ Kin[
0.108 I 0.111
2.4 I 2.7
Experiment
0.244
2.1
IET-8B
MAAP4
Henry I K i m
0.260 10.240
IET-10
Experiment
0.326
2.2 J 2.6 2.5
MAAP4
Henry I Kim
0.319 10.318
2.3 1 2 . 5
Table 4: Hydrogen Results Based on Henry's Model.
IET-10 IET-8B IET-1
U1A U2
H2 Produced (g-moles) Experiment MAAP4
1240 1131
299 271
233 181
5.0 0.91
6.0 1.7
H2
Burned (g-moles) Experiment MAAP41408 845
281 157.5
3 0
0 0
3.0 1.6
A m I:k.
t , .
O •
t , . 121..
o ¢,t)
¢,~ ¢'4
q )
i
, , , I , , , , i , , , , i , , , , i , , , , i , , , , i , , , , l , , , , i , , , , i , , , . , , , . . . , , . . , . ,• ., ~ . , . e ~ . . . M . ~ "- ".~'.f..,,~,~,.~ ~ M ~ . : - - " "- - . ~ , - _ - . . ~ ._. ~ . . .
IET-I Test Data MAAP4:
Henry . . . . KIm . . .
" f
t
" 0 1 2 3 4 5 6 7 8 9 10
TIME SECONDS
Figure 5:IET-1 Vessel Pressure Comparison.
Q .
Q
o .' IET-BB Test Data
( n c q
=:
u ' l
" " 0 1 2 3 4 5 6 7 8 9 10
TIME SECONDS
Figure 6: IET-8B Vessel Pressure Comparison.
the experimental data to the MAAP calculations of vessel pressure. The time to peak pressure was similar, 2.4 s for Henry's and 2.7 s for Kim's.
The results for IET-8B (which includes combustion heat in the DCH energy, in addition to sensible and latent heat, and oxidation heat) are shown in Figure 6. The values selected for the jet burning factor was 2.5. As will be evident later, this value appears to be universally applicable to all tests considered here. It is noted that when the jet burning factor is too small, i.e., jet burning is not strong enough, a peculiar result may occur. The calculated pressure may continue to increase after the DCH time scale as a result of deflagration of remaining hydrogen in the upper compartment, but at a much slower rate. Deflagration would be suppressed if sufficiently strong jet burning occurs, such that the mixture is far below its flammability limits. The major portion of the calculated pressure increase was due to combustion of a hydrogen jet as it passed through openings from the sub-compartment to the large space of the Surtsey vessel. The calculated vessel pressure results based on Henry's approach over-predict the experiment, while the results based on Kim's approach under-predict. In either case, the comparison is off by less than 15%.
IET-10 (1/6 Scale)
The DCH model implementation, which was to a reasonable extent successfully benchmarked with IET-1 and IET-8B, is fiLrther benchmarked with IET-10, another integral effects test. IET-10, the tenth experiment in the integral effects test series, was conducted to measure the DCH pressure load in a 1:6 linear scale Surry-type containment with a prototypic steam/air/H2 atmosphere. Note that IET-1 and IET-8B did not have steam initially in the containment atmosphere. Scale models of the Surry reactor pressure vessel (RPV), reactor support skirt, control rod drive missile shield, biological shield wall, cavity, instrument tunnel, residual heat removal (RHR) platform and heat exchangers, seal table room (STR) and seal table, operating deck, and crane wall were constructed inside a 1:6 scale model of the Surry reactor containment building. A 158-kg charge of iron/alumina/chromium thermite was used as a corium melt simulant. The Containment Technology Test Facility (CTTF) at Sandia National Laboratories was used to perform the experiments. The CTTF was initially heated to approximately 410 K, and then pressurized to 0.18 MPa with a mixture of about 48 mol.% steam, 50 mol.% air, and 2 mol.% Ha. The amount of preexisting hydrogen in the CTTF represented levels of hydrogen produced by partial clad oxidation during the core degradation process in a loss-of-coolant accident. The molten core debris was ejected by superheated steam at 12.1 MPa into the reactor cavity.
The measured containment peak pressure increase was 0.326 MPa. Hydrogen and oxygen measurements indicated that significant combustion occurred. Global hydrogen combustion was unlikely under the conditions in the experiment. Apparently hydrogen, produced by steam/metal reactions during the HPME, burned as a jet as it exited the sub-compartments and entered the upper dome atmosphere. This is the same burning mechanism observed in the IET-8B experiment.
IET-10 is similar to IET-8B. Both cases involve a major contributor to the containment pressure load, i.e., the burning of hydrogen-rich jet as it exited from the sub-compartment to the dome region. The CTTF containment was nodalized into 3 compartments (cavity, sub-compartment, and upper compartment) in the same manner as was done for the IET-8B analysis, with one additional node modeled as an accumulator for steam blowdown. The differences between the two are in the scale (1:6 vs. 1:10) and the cavity design. No de-entrainment was assumed for Surry-type cavity in IET-10, while de-entrainment was assumed for the Zion-type cavity in IET-8B. Based on the MAAP4 calculations of IET-10, hydrogen combustion contributes about 70% of the DCH energy to the containment pressure load, while the metal oxidation heat contribution is 18%, and the sensible and latent heat of the thermite melt only 12%. Again, this emphasizes the importance of jet burning in the DCH modeling. A very good prediction of the DCH pressure, as shown in Figure 7, can be obtained with a jet burning factor of 2.5, as in IET-8B.
The prediction of the corresponding gas temperature is shown in Figure 8. The calculated temperature is in line with the average of measured temperatures. Figure 9 shows the cavity pressures. This confirms that MAAP4 could not predict the detail of the cavity pressure buildup during debris dispersal. However, after the rapid transient period, the code can follow the pressure correctly. The amount of total hydrogen remained in the vessel, and the amount of total hydrogen burned are shown in Figure 10.
U1A and U2 (1/40 Scale)
These tests used real reactor materials in a small scale of 1/40. The simulant corium used in the test§ was made of 57.8% UO2, 10.5% ZrO2, 14.3% Fe, 3.71% Cr, and 13.7% Zr with the total weight of 1.13 kg. About 30% of the simulant corium were metals that could be oxidized during the test. The initial blowdown pressure was 3 MPa in U1A. The model predicts an oxidation fraction of 19.4% for Zr and 27.9% for stainless steel for U1A.
The comparison of pressure transients are shown in Figure 11. The calculation based on Henry's approach under- predicts the U1A data by 11% in peak pressure, while the Kim's approach under-predicts by more than twice of Henry's. (It is noted that about 1/3 of calculated pressure in U1A is due to steam blowdown. Sensible heat contribution was negligible since the seal table model de-entrains most (99.9%) of debris particles.)
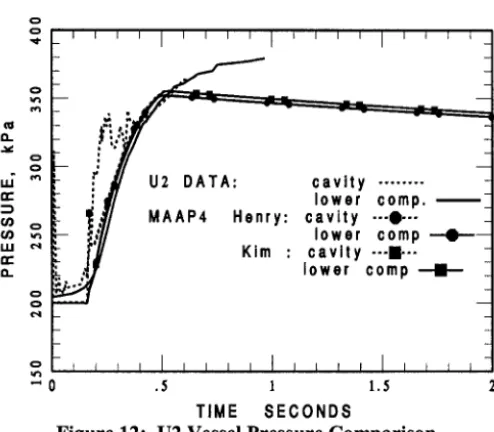
U2 experiment was a variation from U1A with respect to the containment atmosphere. The U2 atmosphere contained air with 2.5% H2, while U 1A was inert with nitrogen gas. The blowdown pressure in U2 was 4.3 MPa. As shown in Figure 12, the calculated pressure reached a peak value at 0.52 s, but the experimental data still kept rising until the end of
A
,q- v
U)
IX.
tO u'~
tO ¢ q
>
0 5 1 0 15
TIME SECONDS
Figure 7 : I E T - 1 0 Vessel Pressure Comparison.
m u-t
o " x v v
t .
E
o
1/} i ~ u..,
lET-10
M A A P C A L C U L A T I O N : H E N R Y . . .
KIM . . .
T e s t D a t a : C h a n n e l 62 ¢
T e s t D a t a : A v e r a g e T e s t D a t a : C h a n n e l 58 =
20
0 5 1 0 1 5 2 0
TIME SECONDS
~ "2.
,JD ~
. . . . I ' ' ' ' 1 . . . . I . . . . I . . . .
Figure 8 : I E T - 1 0 Vessel Gas Temperature Comparison. IX. m
z'~ I I
"f
m g ] M A A P 4 C a l c u l a t i o n : H e n r y . . . . - - ~ Z ]
~-
r
4) t~ sS" ..."
.;
,-.,I I I I I I I I I I -
0 1 2
lET-10 ,.,-ui :I
i,
,
l E T . 1 0,
,
,
,
,
t
o
T e s t D a t a r ~
LU o r r ' o
_
_
" 0
T I M E S E C O N D S
Figure 9 : I E T - 1 0 Cavity Pressure Comparison.
j,-,- Fd,.W N N Ilq, 'M,'Fq, qP,PF.q' N N ml, ql, q, qeq.qP.q,,ev N N rz w . z , m $ , z , $ , e
I "
_ | .
I
I ' I ' i o
I ' I E T - I O
i ~ f M A A P 4 C A L C U L A T I O N H E N R Y . . . .
l- ~ ' " . . .
i i i i I i , i i I i f i J I i i i i I I I I J
5 10 15 20
T I M E S E C O N D S
,,-t =.m m,.m m.'.mm'.mm'W, m.m, ~ w m.e ,mw.,b-,,m..v,..,w, nm.m W w ,mw..m,,.--,-~.,w, m d .-. w , m w , . m ~
I;
_ I -
- I ;
_ I : I1 - I :
- I,' I E T - I O
I " M A A P 4 C A L C U L A T I O N I: H E N R Y . . . . - ~ KIM . . .
F
I: -i:
- I
_t
$ 1 0 15 2 0
T I M E S E C O N D S
Figure 1 0 : I E T - 1 0 Hydrogen Results.
U I A D A T A : e v l t y . . . . l o w e r t e m p .
i M A A P 4
: , ' . H e n r y : c a v i t y - - - 0 - - - i ~ " ~ . l o w e r comp =
: K I m : c a v i t y - - - I - - -
i : ~ l o w e r comp -- -
i ~.
i 2 ~ "-'_ .... _
~
:_ -_-__ - _ = - _.- - [] -
_
_
i i i i I i i i i I I ~ I I I I I I I
. 5 1 1 . 5
T I M E S E C O N D S
Figure 11: U 1 A Vessel Pressure Comparison.
2
1 s. Such pressure behavior indicated that hydrogen was still
burning in the actual test. This burning could not be
followed by the same jet burning model that successfully used in IET-10, and IET-8B which was much larger in scale than U2. Could this be due to a particular characteristic of a very small scale? The answer probably lies in the signif-
o I 1 .
o o
r r '
::D 0') o (/)
UJ
n,-
n
U2 DATA:
MAAP4
c a v i t y ... lower comp. Henry: c a v i t y ---e---
lower comp ----0- Kim : c a v i t y - - - B - - -
lower comp - - I - -
o
o t l l l l l l l l l l l l l l l l J l
" 0 .5 1 1.5 2
TIME S E C O N D S
Figure 1 2 : U 2 Vessel Pressure Comparison.
icantly large discrepancy in the amount of hydrogen produced, as shown in Table 4, especially for the 1/40 scale experiments using cerium. With too little hydrogen produced during HPME, there would be no hydrogen to support burning, as seen in the experiment. Another reason that could contribute to this discrepancy is the accuracy of initial conditions (Table 1), in particular, those related to the energy and temperature of cerium were not well characterized for the cerium tests. Nevertheless, the discrepancy, up to the point of divergence, was very small. CONCLUSION
We have performed an extensive benchmarking of the MAAP4 code in its performance to predict the DCH behavior observed in the IET experiments. It is fair to say that among all the different scale experiments, the code tends to do best in the largest 1/6 scale, with the 1/10 scale in second place, and the 1/40 scale in last place. With an exception for the U2 experiment where the discrepancy in DCH pressure is nearly 20%, all other experiments are within or better than 15%. The two modeling approaches (Henry and Kim) were shown to yield similar results, with Henry's approach tends to over-predict Kim's approach for cases with and without hydrogen burning. Due to partial freezing of the ejected debris that could exceed 20% retention assumed in the Kim's model, the two models yield similar amount of entrainment. This shows that different models can lead to similar results when implemented properly. Based on the results, it was found that the use of the seal table de-entrainment model yielded reasonable results for Zion-type cavity. For DCH with hydrogen combustion, reasonable results can be achieved with the jet burning factor of 2.5. This value can be applied universally to all tests. Jet combustion is the dominant contributor (60~70%) to the DCH pressure load.
NOMENCLATURE Ac As Av Co Ca Cdr Cv Eo g K L Lp mD mDCH Mw Pv QL Qox r R To
minimum cavity flow area, reactor cavity floor area, RPV blowdown area, debris specific heat, discharge coefficient, drag coefficient,
gas specific heat at constant volume,
amount of energy transferred from debris to gas, acceleration of gravity,
Arrhenius rate constant for oxidation, length of cavity floor,
length of cavity floor + tunnel length, entrained mass,
debris mass contributed to DCH, gas molecular weight,
RPV pressure, latent heat, oxidation heat,
radius of entrained debris particle, universal gas constant,
initial debris temperature,
te Tf Ti Tv Uent Ug V W
y O
~de Pg Pw 17 ~tD entrainment time,
final equilibrium debris temperature, initial gas temperature,
temperature of gas in blowdown vessel, minimum entrainment velocity, gas velocity in cavity,
accumulator blowdown volume,
width of operative through which particles travel as they turn to leave the reactor cavity,
thickness of oxide layer on oxidized metal, surface tension,
specific heat ratio, Cp/Cv,
T+l
3'+1
de-entrainment efficiency, gas density,
water density,
blowdown time constant, and viscosity of molten debris.
REFERENCES
Zuber, N., and the Technical Program Group, "An Integrated Structure and Scaling Methodology for Severe Accident Technical Issue Resolution,"
NUREG/CR-5809,
Idaho National Engineering Laboratory, 1991., o ,
10. 11. 12. 13.
14.
15. 16. 17.
18. 19. 20. 21. 22.
Allen, M. D., Pilch, M, Griffith, R. O., and Nichols, R. T., "Experiments to Investigate the Effects of Water in the Cavity on Direct Containment Heating in Surtsey Test Facility- the WC-1 and WC-2 Tests," SAND91-1173, Sandia National Laboratories, March 1992.
Allen, M. D., Pilch, M. M., Blanchat, T. K., Griffith, R. O., and Nichols, R. T., "Experiments to Investigate Direct Containment Heating Phenomena with Scaled Models of the Zion Nuclear Power Plant in the SURTSEY Test Facility," NUREG/CR-6044, SAND93-1049, Sandia National Laboratory, May 1994.
Blanchat, T. K., Allen, M. D., and Pilch, M. M., "Experiments to Investigate Direct Containment Heating Phenomena with Scaled Models of the Surry Nuclear Power Plant," NUREG/CR-6152, SAND93-2519, Sandia National Laboratory, June 1994.
Binder, J. L., McUmber, L. M., and Spencer, B. W., "Direct Containment Heating Integral Effects Tests at 1/40 Scale in Zion Nuclear Power Plant Geometry," NUREG/CR-6168, ANL-94/18, Argonne National Laboratory, September 1994.
Blanchat, T. K., Pilch, M. M., and Allen, M. D., "Experiments to Investigate Direct Containment Heating Phenomena with Scaled Models of the Calvert Cliffs Nuclear Power Plant," NUREG/CR-6469, SAND96-2289, Sandia National Laboratory, February 1997.
Ishii, M., Revankar, S. T., and Zhang, G., "Air-Water Simulation of Phenomena of Corium Dispersion in Direct Containment Heating," NUREG-CR-6267, PUNE-93/1, Purdue University, West Lafayette, IN., October 1994. Ishii, M., "Corium Dispersion in Direct Containment Heating," NUREG/CR-651 O, Pu NE-96-2&3, Volumes 1 & 2, Purdue University, September 1999.
Blanchat, T. K., Pilch, M. M., and Allen, M. D., "Direct Containment Heating Experiments at Low Reactor Coolant System Pressure in the Surtsey Test Facility," NUREG/CR-5 746, SAND99-1634, Sandia National Laboratory, July 1999.
Pilch, M. M., Yan, H., and Theofanous, T. G., "The Probability of Containment Failure by Direct Containment Heating in Zion," NUREG/CR-6075, SAND93-1535, Sandia National Laboratory, December 1994.
Pilch, M. M., Allen, M. D., and Knudson, D. L., "The Probability of Containment Failure by Direct Containment Heating in Zion," NUREG/CR-6075, Supplement 1, SAND93-1535, Sandia National Laboratory, December 1994. Pilch, M. M., Allen, M. D., and Spencer, B. W., "The Probability of Containment Failure by Direct Containment Heating in Surry," NUREG/CR-6109, SAND93-2078, Sandia National Laboratory, May 1995.
Pilch, M. M., Allen, M. D., and Klamerus, E. W., "Resolution of the Direct Containment Heating Issue for All Westinghouse Plants With Large Dry Containments or Subatmospheric Containments," NUREG/CR-6338, SAND95-2381, Sandia National Laboratory, February 1996.
Pilch, M. M., Allen, M. D., and Powell, J. L., "Resolution of the Direct Containment Heating Issue for Combustion Engineering Plants and Babcock and Wilcox Plants," NUREG/CR-6475, SAND97-0667, Sandia National Laboratory, November 1998.
Pilch, M., Bergenon, K. D., and Gregory, J. J., "Assessment of the Direct Containment Heating Issue for Plants With Ice Condenser Containments," NUREG/CR-6427, SAND99-2253, Sandia National Laboratory, April 2000.
Henry, R. E., "An Evaluation of Fission Product Release Rates During Debris Dispersal," Proc. ANS International Topical Meeting, Probability, Reliability, and Safety Assessment 1, pp. 375-383, April 2-7, 1989.
Kim, S. B., Chung, M. K., Lee, H. Y., and Kim, H. D., "Parametrical Study of Geometrical Effects in Debris Dispersal from a Reactor Vessel during High Pressure Ejection," International Communication in Heat & Mass
Transfer, Vol. 22, No. 1, pp. 25-34, 1995.
Walker, J. V., "Reactor Safety Research Semi-Annual Report," NUREG/CR-5039, SAND87-2411, Sandia National Laboratory, 1987.
White, J. F., "AEC Fuels and Materials Development Program," Seventh Annual Report- GEMP-IO04, March 1968. Pong, L. T., "A Theoretical Study of the Reactions of Molten Zr, Fe, and A1 with Water," SAND88-7119, Sandia National Laboratory, October 1988.
Blanchat, T, K., Allen, M. D., Pilch, M. M., and Nichols, R. T., "Quick-Look Report on the Tenth Integral Effects Test (IET-10) in the Containment Technology Test Facility," Sandia National Laboratories, August 1993.
Luangdilok, W., Morota, H., and Epstein, M., "Flame Propagation Model in a Multi-Node Geometry," submitted to Nuclear Technology, 2000.
![Figure 1:1/10 Linear Scale IET Test Facility [3].](https://thumb-us.123doks.com/thumbv2/123dok_us/1555006.1190915/6.596.49.366.39.329/figure-linear-scale-iet-test-facility.webp)
![Figure 3:1/40 Linear Scale IET Test Facility [5].](https://thumb-us.123doks.com/thumbv2/123dok_us/1555006.1190915/7.596.46.538.43.308/figure-linear-scale-iet-test-facility.webp)