HIGHLIGHTED ARTICLE
| INVESTIGATION
Toward Universal Forward Genetics: Using a Draft
Genome Sequence of the Nematode
Oscheius tipulae
To Identify Mutations Affecting Vulva Development
Fabrice Besnard,*,1,2Georgios Koutsovoulos,†,1,3Sana Dieudonné,* Mark Blaxter,†,4and Marie-Anne Félix*,2,4
*École Normale Supérieure, Centre National de la Recherche Scientifique, Institut National de la Santé et de la Recherche Médicale,
Institut de Biologie de l’École Normale Supérieure, Paris Sciences et Lettres Research University, 75005, France, and†Institute of
Evolutionary Biology, University of Edinburgh, EH8 9YL, United Kingdom ORCID IDs: 0000-0003-4619-5547 (F.B.); 0000-0003-3406-3715 (G.K.); 0000-0003-2861-949X (M.B.)
ABSTRACTMapping-by-sequencing has become a standard method to map and identify phenotype-causing mutations in model species.
Here, we show that a fragmented draft assembly is sufficient to perform mapping-by-sequencing in nonmodel species. We generated a
draft assembly and annotation of the genome of the free-living nematodeOscheius tipulae, a distant relative of the modelCaenorhabditis
elegans. We used this draft to identify the likely causative mutations at theO. tipulae cov-3 locus, which affect vulval development. The
cov-3locus encodes theO. tipulaeortholog ofC. elegansmig-13, and we further show thatCel-mig-13mutants also have an unsuspected
vulval-development phenotype. In a virtuous circle, we were able to use the linkage information collected during mutant mapping to improve the genome assembly. These results showcase the promise of genome-enabled forward genetics in nonmodel species.
KEYWORDSOscheius tipulae; genome assembly; mapping-by-sequencing; vulva development;mig-13
A
few model organisms have greatly contributed to biolog-ical research in the last decades, among them the nematode Caenorhabditis elegans. However, to tell conserved from specific features and understand the evolutionary process that gave rise to extant diversity, comparisons between different species at key phylogenetic positions are necessary. Genome sequences havebeen instrumental in model organism research, and the ongoing revolution in new genome sequencing and assembly technolo-gies eases the once-daunting task of building such resources for any species. Draft assemblies can now be achieved within a few months at a reasonable cost, even by individual teams. Once a reference genome and gene annotation are available, other high-throughput sequencing techniques, such as RNA sequenc-ing, can be used to explore genotype–phenotype interactions (Liu et al.2015; Roux et al.2015). Classical forward genetic approaches,i.e., phenotype-based mutagenesis screens, are easy to perform and universal, provided the species can be cultured and crossed. Forward genetics has the huge advantage of iden-tifying genes without prior knowledge or bias, which is partic-ularly important in evolutionary comparisons. Such forward screens have been applied to many nonmodel species, but a remaining challenge is the identification of causative mutations and thus the function of target genes at the molecular level.
Massively parallel sequencing permits rapid identifica-tion of phenotype-causing mutaidentifica-tions through“ mapping-by-sequencing.”Mapping-by-sequencing has become a standard forward genetic approach in most model organisms, includ-ingArabidopsis thaliana(Jameset al.2013),Saccharomyces Copyright © 2017 Besnardet al.
doi:https://doi.org/10.1534/genetics.117.203521
Manuscript received May 3, 2017; accepted for publication June 15, 2017; published Early Online June 19, 2017.
Available freely online through the author-supported open access option.
This is an open-access article distributed under the terms of the Creative Commons Attribution 4.0 International License (http://creativecommons.org/licenses/by/4.0/), which permits unrestricted use, distribution, and reproduction in any medium, provided the original work is properly cited.
Supplemental material is available online atwww.genetics.org/lookup/suppl/doi:10. 1534/genetics.117.203521/-/DC1.
1These authors contributed equally to this work.
2Corresponding authors: Laboratoire Reproduction et Développement des Plantes, École Normale Supérieure de Lyon, Université de Lyon, 46 Allée d’Italie, 69364 Lyon CEDEX 07, France. E-mail: [email protected]; and Institut de Biologie de l’École Normale Supérieure, 46 rue d’Ulm, 75230 Paris CEDEX 05, France. E-mail: [email protected]
3Present address: Institut National de la Recherche Agronomique, Université Côte d’Azur, Centre National de la Recherche Scientifique, Institut Sophia Agrobiotech, Sophia Antipolis 06903, France.
cerevisiae, Danio rerio, Drosophila melanogaster, and C. elegans (Schneeberger 2014). Mapping-by-sequencing strategies are generally based on the sequencing of bulk-segregant populations (Michelmore et al. 1991). Starting with a cross between the mutant strain of interest to a phe-notypically wild-type but genetically different outcrossing strain, F2grand-progeny individuals showing the recessive mutant phenotype are selected, and their DNA is pooled and sequenced. The recessive causative allele is necessarily ho-mozygous for all individuals in this bulk mutant sample. For any polymorphic position between the two backgrounds, allele frequencies can be measured from mapped sequenc-ing reads. If unlinked to the selected mutation, polymor-phisms that distinguish the two parental strains will be found in the mutant pool at equal frequencies. However, if these markers are genetically linked to the causative muta-tion, the proportion of the allele from the wild-type back-ground will decrease close to the mutated locus and approach zero in its immediate vicinity. Plotting allele fre-quencies along a reference genome will thus define a region of low wild-type allele frequency, surrounding the location of the causative mutation. The physical size of this interval will decrease with the number of meiotic recombination events in the F2population (and, if limiting, with the number of avail-able polymorphic positions).
In theory, if a mutant strain only differs from a nonmutant strain by a single mutation, comparing whole-genome se-quencing data should reveal this polymorphism with no need for mapping (Nordström et al. 2013). In practice, genetic mapping information is required because a mutagenized strain and its nonmutagenized reference will have many spu-riousfixed differences: nonphenotype-causing mutations due to mutagenesis, orde novospontaneous mutationsfixed by drift in each strain. Technical noise, such as sequencing or mapping errors, can also contribute to observed variation. After one or several crosses, most of these variations can be excluded because they fall outside the mapping interval. Hence, sequencing bulk-segregant F2 populations and mapping allele frequencies on a reference genome is key to identifying the phenotype-causing mutation. Recently, mapping-by-sequencing has been applied to crop plants like rice (Abe et al.2012; Fekihet al. 2013; Takagiet al.2013), maize (Liu et al. 2012; Li et al. 2013), or barley (Mascher et al.2014; Pankinet al.2014), in which the genome is incom-plete but high-resolution physical and genetic maps exist for each chromosome. Whether mapping-by-sequencing can be ef-ficient in organisms with a fragmented or incomplete reference genome and no genetic map has not been tested.
The phylum Nematoda, which includes the model organ-ismC. elegans, is an ideal target for the development of new species as model organisms amenable to forward genetics, because many species combine easy genomics and easy ge-netics. First, the relatively small size of nematode genomes, ranging from 20 to 400 Mb, ensures reasonable costs and good quality for most genome projects (Kumaret al.2012). Second, the powerful genetics of C. eleganscomes from its
short life cycle and its androdioecious mode of reproduction, with selfing XX hermaphrodites that mate with X0 males in a facultative and controllable manner. Other nematode species sharing these features have therefore been chosen to perform forward genetics:C. briggsae(Guptaet al.2007),Oscheius tipulae (Félix 2006), andPristionchus pacificus (Sommer 2006). With C. elegans, these three free-living bacteriovorous nematodes belong to the Rhabditinae (De Ley and Blaxter 2002) [also referred as clade V (Blaxter et al.1998) or 9 (Holtermanet al.2006; van Megenet al.2009); see Figure 1]. Besides its mode of reproduction and easy culture,O. tipulae has been chosen for several reasons: the two-step, anchor-cell induction of vulval-precursor-cell fates and its simple vulval cell lineage (Félix and Sternberg 1997), its easy isolation from various regions of the world (Baïlle et al.2008), and its phylogenetic position compared to C. elegansas an out-group toCaenorhabditisspecies but an ingroup toP. pacificus (Blaxteret al.1998). High-quality genome assemblies have been generated for C. briggsae (Stein et al. 2003) and P. pacificus (Dieterich et al. 2008). Classical techniques have been employed to map and identify genes involved in differ-ent traits with particular emphasis on the convergdiffer-ent evolu-tion of self-fertile hermaphroditism, reviewed in Ellis and Lin (2014), and vulva development (Seetharaman et al.2010; Sharanya et al. 2012, 2015; Sommer 2012; Kienle and Sommer 2013). InP. pacificus, genetic analyses of the evolution of sex muscles (Photoset al.2006), gonad development (Rudel et al.2008), dauer formation (Ogawaet al.2009, 2011), and buccal tooth dimorphism (Bento et al. 2010) have been published. Inspired by the versatile and robust pipelines of mapping-by-sequencing routinely used forC. elegans(Minevich et al.2012), we generated a genome assembly forO. tipulaeand here test mapping-by-sequencing in this species.
taking a secondary (2°) fate. Nematode vulval development is one of the best examples of how pervasive but cryptic evo-lution modifies the mechanisms of development despite an invariable output; a phenomenon known as“developmental system drift”(True and Haag 2001; Burgess 2011; Robinson 2011). Interestingly, the phenotypic spectrum of O. tipulae vulva mutants suggests substantial underlying evolutionary differences in specification and interaction compared to other species. InO. tipulae, all but 1 of the 34 vulval mutations so far isolated in forward genetic screens await molecular iden-tification. Uncovering the molecular nature of the 33 mutants that are still uncharacterized inO. tipulaewill help to unveil the mode and tempo of the vulva development system drift and possible innovations among Rhabditinae.
Here, we integrate a range of genomic tools to rapidly and cost effectively build a draft genome assembly and annotate genes in the nematodeO. tipulae. Despite its fragmentation, we show that this draft assembly is a suitable platform for mapping-by-sequencing. As a proof of concept, we identify the vulva mutant genecov-3(Louvet-Valléeet al.2003) as the O. tipulae homolog ofC. elegans mig-13. Finally, we show that linkage information collected during mapping of mutant
alleles can be further used to detect mis-scaffolding and to group scaffolds into chromosome-scale linkage groups, im-proving the initial assembly, and providing useful information for further genetic mapping and mutant gene identification.
Materials and Methods
Nematode strains and culture
TheO. tipulaereference strainCEW1, originally from Brazil, was used for forward mutant screens (Félixet al.2001). The second wild strain that we used as a source of molecular poly-morphisms is JU170, a strain sampled from soil in Sevilla, Spain, in 2000. This latter strain was chosen as it has a high genetic distance compared toCEW1, based on prior amplified fragment length polymorphisms (AFLP) analysis of a set of 63 wildO. tipulaeisolates (Baïlleet al.2008).O. tipulae mu-tant strains were generated as previously described (Félixet al. 2000; Dichtelet al.2001). See Supplemental Material,Table S3, for the list of mutant alleles used in this study. These alleles were described in Dichtelet al.(2001), Louvet-Valléeet al. (2003), and Dichtel-Danjoy and Félix (2004), except for Figure 1 Phylogenetic relationships ofO. tipulaeand comparison of vulva development withC. elegans. (A) Cartoons showing (left) the systematic
structure phylum Nematoda [clades I–V or 1–12 defined according to Blaxteret al.(1998), p. 199, and van Megenet al.(2009), respectively] and (right)
the relationship ofO. tipulaeto key Rhabditina species discussed in the text. Pictures of young adult hermaphrodites ofO. tipulaeandC. elegansare
shown on the right (arrowhead pointing to the vulva). Bar, 0.5 mm. (B–D) Vulva development inO. tipualeandC. elegans. (B) Ventral epidermal cells
called P3.p to P8.p are specified as vulva precursor cells in young L1 larvae. (C) Conserved anteroposterior pattern of cell fates, despite variation in cell
lineages: P6.p occupies the central position and adopts a 1°fate, P5.p and P7.p are induced to follow a 2°fate, and their daughters will form the border
of the vulval invagination. Other cells (P3,4,8.p) differentiate into nonvulval epidermal fates, either with or without one round of division (3°or 4°fates,
respectively). (D) Nomarski images of wild-type, L4-stage hermaphrodites (left,O. tipulae; right,C. elegans), highlighting the daughter cells of the Pn.p
mf33, whose phenotype is only weakly penetrant and will be described elsewhere. O. tipulaestrains were thawed from frozen stocks and cultured at 23° on NGM-plates seeded with Escherichia coli OP50, as previously described (Félix et al.2000). TheC. elegansstrains used were Bristol strain N2 and the CF726 strain carrying the mig-13(mu225) X mutation, and they were cultured according to standard protocols (Brenner 1974) at 20°.
Library preparation and next-generation sequencing
For genome assembly, genomic DNA was extracted from a mixed-stage growing population using reagents from the Puregene Core Kit A (QIAGEN, Valencia, CA). Data were generated from a 400-bp library and a 3-kb mate-pair or jumping library, following manufacturer’s instructions. The mate-pair library was constructed by the Centre for Genome Research, Liverpool. The 400-bp library was sequenced on the Illumina MiSeq platform (6.5 million 100-base read pairs and 20.7 million 300-bp read pairs). The paired-end library was sequenced on an Illumina HiSeq2500 (145.5 million 100-bp paired reads) (Table S1). Raw data have been submitted to the International Nucleotide Sequence Database Consortium (INSDC) under project accession no. PRJEB15512.
RNA was extracted from a mixed-stage growing population of O. tipulaeCEW1, cultured in standard laboratory condi-tions. Poly(A)-enriched complementary DNA was prepared from the RNA by GATC (Konstanz, Germany) and normalized using reassociation kinetics. RNA sequencing was performed by GATC on the Roche GS FLX Titanium platform. A total of 592,650 reads (average length 369 bp) remained after filter-ing for quality. Raw transcriptome data are available in INSDC under project no. PRJEB15512).
For mapping-by-sequencing, genomic libraries and se-quencing data fromO. tipulaeJU170 (INSDC project acces-sion no. PRJEB19969) and mutant F2 pools (see project accessions inTable S3) used were generated by BGI. Short insert libraries (,800 bp) were paired-end sequenced on Illumina Hiseq2000, Hiseq2500, or Hiseq4000 with 100-bp reads to obtain 2.2 GB (403coverage) of clean data per sample after manufacturer’s datafiltering (removing adaptor sequences, contamination, and low-quality reads).
Genome assembly
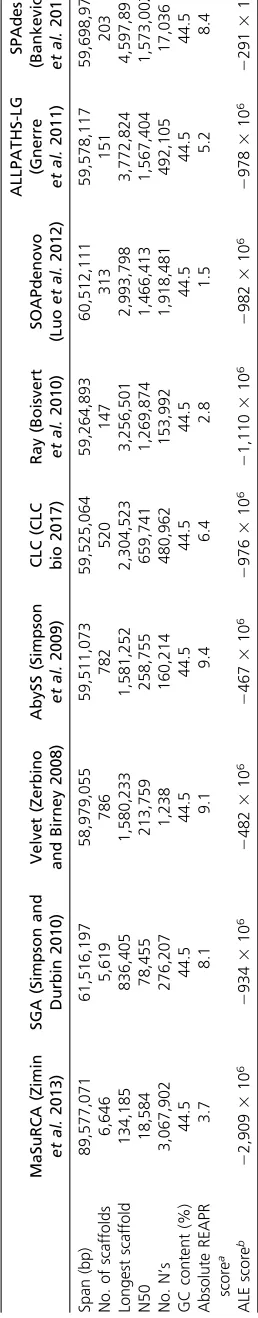
All software tools used (including versioning and command line main options) are summarized inTable S4. Raw reads were trimmed for adaptors using Cutadapt (Martin 2011) and low-quality bases, then corrected for sequencing errors based on k-mer content using Quake (Kelleyet al.2010) and JELLYFISH (Marçais and Kingsford 2011). Raw data were checked with FastQC (Andrews 2010) and a preliminary as-sembly generated with CLC Asas-sembly Cell (CLC bio 2017) (Table S5). The CLC assembly was screened for contaminants using taxon-annotated, GC-coverage (TAGC) plots (Kumar et al.2013). Only data deriving fromE. coli, the food source, was identified as contaminant and the corresponding reads were removed. The optimal k-mer size for assembly of the
cleaned read set was estimated using KmerGenie (Chikhi and Medvedev 2014). Nine different assemblers (Table 1) were used to generate preliminary assemblies and these were assessed using basic metrics, correctness of read alignment using ALE (Clarket al.2013) and REAPR (Huntet al.2013), and biological completeness using Core Eukaryotic Genes Mapping Appoach (CEGMA) (Parra et al.2007) and direct identification of ribosomal RNA genes and mitochondrial ge-nome sequences. SPAdes (Bankevich et al. 2012) outper-formed the other assembly tools in almost all aspects and was chosen as draft assembly nOt.1.0. An improved assembly limited to the nuclear genome (nOt.2.0) was generated by removing mitochondrial contigs and contigs of abnormally low coverage and by breaking all scaffolds where mis-assembly had been indicated from analysis of mapping plots and REAPR fragment coverage distribution (FCD) scores.
Gene prediction and orthogroup inference
Genes were predicted using a two-pass pipeline (Koutsovoulos et al.2014) (seeFigure S3) based on MAKER2 (Holt and Yandell 2011) and Augustus (Stankeet al.2006), and using the tran-scriptome data as evidence. Repeats were identified in the as-sembly using RepeatModeler (Smitet al.2013–2015). MAKER2 was run in an SGE cluster using the SNAP (Korf 2004)ab initio genefinder trained by CEGMA (Parraet al.2007) output mod-els, the GeneMark-ES ab initiofinder, SwissProt proteins, and O. tipulaetranscripts. The transcriptome data werefiltered so that only reads.300 bases that had significant basic-local-alignment-search-tool (BLAST) similarity to C. elegansprotein databases were kept. The MAKER2 predictions were used to train Augustus to generate a custom gene-finding profile for O. tipulae. Finally, Augustus was used with the gene-finder profile andO. tipulaetranscripts to predict thefinal gene set. Not enough transcript evidence was available to train a model of untranslated regions (UTRs), and therefore no UTRs were annotated. Protein sets forC. elegans(C.elegans Sequenc-ing Consortium 1998),Dictyocaulus viviparus(Koutsovoulos et al.2014),Meloidogyne hapla(Oppermanet al.2008), and P. pacificus(Dieterichet al.2008), downloaded from WormBase (http://www.wormbase.org/), were clustered with Orthofinder (Emms and Kelly 2015) using an inflation value of three. Synteny
O. tipulae scaffolds containing .100 predicted protein-coding genes were selected to perform synteny analyses betweenO. tipulaeandC. elegans. Predicted proteins from these 36 scaffolds were compared to theC. elegansprotein data set with BLAST to identify orthologous pairs. For each pair, the chromosome location of the C. elegansortholog was identified. Hierarchical clustering was performed to group the scaffolds into groups based on the proportions ofC. eleganschromosomal attributions (Figure S9).
Mapping crosses
background) and several F1cross-progeny were singled. In the F2 progeny, mutant animals were isolated based on the observation of the mutant phenotype (checked under Nomarski microscopy if necessary) and singled onto indi-vidual plates. These lines were amplified by selfing and allowed to grow until theE. colifood was just exhausted. Forcov-3F2mutant pool sequencing, independent mutant F2-derived populations (21 for mf35 and 51 for sy463) were washed several times in M9 buffer (Stiernagle 2006) and stored at280°as pellets. A similar mass of nematodes from each F2line was then pooled for DNA extraction. For the F2sequencing of other mutations, each F2-derived pop-ulation was checked for the presence of the mutation in the homozygous state and allowed to grow until theE. colifood was just exhausted. Nematodes were directly pooled from different plates and washed in M9 buffer. DNA was then extracted using the Puregene Core Kit A (QIAGEN). Variant analysis, gene mapping, and identification
JU170 whole-genome sequencing data were analyzed to identify SNPs compared to the CEW1 reference genome. These variants were then used for genetic mapping of the mutants (listed inTable S3). Reads were mapped with bwa (Li and Durbin 2009) to theCEW1assembly, mappings pro-cessed with the GATK tool suite (McKennaet al.2010) ver-sion 3.3-0 and variants called with HaplotypeCaller using default parameters. We followed HaplotypeCaller’s authors’ recommendations of best practice (DePristoet al.2011; Van der Auweraet al.2013), realigning reads around indels and performing BQSR by bootstrapping a first call made with HaplotypeCaller. We analyzed the 300-bpCEW1MiSeq data used for genome assembly with the same pipeline, afterE. coli decontamination, as a control for variant calling. We then hard filtered a list of high-confidence SNPs of JU170 with conservative criteria, retaining homozygous positions cov-ered by at least three reads in each strain, with a sequencing and mapping quality higher than 100 and 55, respectively, and a position noted as reference in CEW1 and variant in JU170. Sequencing data from pooled F2mutants were ana-lyzed with the same pipeline, except that variant calling was restricted to a list of JU170 SNPs previously established for faster computing (using the HaplotypeCaller option genotyping_mode GENOTYPE_GIVEN_ALLELES). Output VCFfiles were used to compute allele frequencies for each SNP on the JU170 list as the ratio of the number of reads with the JU170 allele over the total number of reads. These fre-quencies were plotted along each scaffold using custom R scripts. Scaffolds displaying a mean JU170 allele frequency,10% were selected as possibly linked to the candidate locus and retained for a second, unrestricted variant call. JU170 variants were filtered out from the output at this stage. We also system-atically added for analysis the 47 scaffolds that do not carry SNPs between JU170 and CEW1 (0.1% of the genome). The functional impact of identified variants was assessed using snpEff (Cingolaniet al.2012) and used to prioritize candidate genes. Where two alleles of the same gene were analyzed,
candidate gene lists were compared to exclude identical varia-tions (likely initial background variavaria-tions) and were inspected for independent hits to the same gene with a different noncom-plementing mutation. When necessary, visual inspections of var-iations in aligned reads was performed with Tablet (Milneet al. 2013). Scripts used to automate this pipeline are available at: https://github.com/fabfabBesnard/Andalusian_Mapping.
Sanger sequencing and gene validation
Four primers were designed to cover theOti-mig-13coding region.Oti-mig-13fragments were amplified from strains ho-mozygous for the four alleles ofcov-3[mf35,mf79,mf80, and
sy463(Louvet-Valléeet al.2003)]. PCR products were
veri-fied on agarose gels, cleaned on columns, and sent for Sanger sequencing to Eurofins.
X chromosome linkage of scaffolds and pyrosequencing
Linkage of scaffolds to the X chromosome was determined using directed pyrosequencing of F1males from crosses (in both di-rections) between theCEW1and JU170 strains. For each scaf-fold, we selected one polymorphic nucleotide position in the middle of the scaffold in an otherwise conserved context (no other variations in the 300 bp surrounding the variant) to en-sure unbiased PCR. For each position, two PCR primers and one sequencing primer were designed (Table S6) using the pyrose-quencer’s companion design software (PyroMark Q96 ID instru-ment from Biotage, Uppsala, Sweden). The primers were tested on parental strains. PCR using universal biotinylated primers and single-stranded PCR amplicon purification was performed as previously described (Duveau and Félix 2010). For each geno-typing assay, in a successful mating plate, three individual adult F1males and three individual adult F1hermaphrodites were transferred individually into 10 ml worm lysis buffer containing proteinase K (200 mg/ml) and frozen at 220°. Nematodes were then thawed and lysed at 60°followed by 15 min at 95°to inactivate the proteinase. A total of 4ml of worm lysate was used as PCR template. Pyrosequencing re-actions were performed in the sequencing mode. High-quality DNA extracts from the parental strains were used as positive controls (separately and mixed to mimic a heterozygote) for each assay. Linkage to autosomes or the X chromosome was made if at least two male genotypes were concordant.
Scaffold linkage analysis
For each mutant strain (seeTable S3) and each scaffold, the mean frequency of alleles in the F2mapping population whole-genome sequencing was extracted from the previous pipeline. All data sets included frequencies for the 144 scaffolds (over a total of 191 in nOt.2.0) that contained polymorphic positions between the strainsCEW1and JU170. Scaffolds and F2 map-ping populations were clustered using the“heatmap.2” func-tion of the“gplots”package in R.
Microscopy
The vulval-cell phenotypes were determined during the early to mid-L4 larval stage using Nomarski microscopy.
Data availability
All raw sequencing data supporting the conclusions of this article have been submitted to the INSDC. Sequencing data of genomic DNA and RNA from reference strainCEW1(used for assembly) are available under project accession no. PRJEB15512. Whole-genome resequencing data of the mapping strain JU170 is under project accession no. PRJEB19969. Project accession numbers corresponding to the sequencing data of F2mapping populations of the different strains used in this study are listed inTable S3. Annotations have also been submitted to the database European Molecular Biology Laboratory–European Bioinformatics Institute under the accession no. PRJEB15512.
All scripts used for mapping-by-sequencing and gene iden-tification are available inhttps://github.com/fabfabBesnard/ Andalusian_Mapping.
The genome assembly and annotation is available for browsing, exploration, and download athttp://ensembl. caenorhabditis.org/index.html; and will be uploaded soon to WormBase (http://www.wormbase.org/).
Results
Assembly and annotation of the O. tipulae genome
(Koutsovoulos et al. 2014), using bothab initio predic-tions and evidence from RNA-sequencing data (Figure S3 and seeMaterials and Methods), and resulted in 14,938 gene predictions (Table 2). We assessed the completeness of the nOt.2.0 assembly using the CEGMA pipeline, and identified 97.6% complete and 99.2% partial genes out of the set of 248 conserved and likely essential genes (Parraet al.2007). TheO. tipulaegenome is surprisingly small, with a span only 59% of that of the model speciesC. elegans. This reduction likely results from different factors (Table S2). Genes are less numerous (74% that ofC. elegans) and have a denser packing (251 genes per Mb compared to 202 genes per Mb in C. elegans). They are also shorter overall (mean gene length is 81% of C. elegans) with shorter introns (160 bp vs. 339 bp), despite more introns per gene (8.5 vs.6). The reduction in genome size is mirrored in the reduction in the span of intergenic DNA, and the repeat content of this inter-genic DNA is much reduced. Overall repeat content inO. tipulae is 8.4% of the genome compared to 18.7% inC. elegans, mostly due to a much lower span of DNA elements (1.0% inO. tipulae compared to 9.9% inC. elegans). Comparing gene orthologies revealed no particular patterns of gene losses but indicated a reduced amount of species-specific genes, suggesting lower frequency of gene expansion and diversification inO. tipulae (Figure S4).
Mapping-by-sequencing identifies the cov-3 locus
Our motivation to assemble the O. tipulae genome was to identify the molecular lesions affecting vulva development in a set of previously characterized mutant strains (Dichtel et al. 2001; Louvet-Vallée et al.2003; Dichtel-Danjoy and Félix 2004). To establish this proof of concept, we chose thecov-3(covstanding forcompetence and centering of vulva) mutant.cov3-mutantO. tipulaedisplay a partial loss of vulval competence with a highly penetrant anterior shift of the vulval fate pattern (Louvet-Valléeet al.2003). This pheno-type has only recently been described inC. elegans, occurring at low penetrance in some Wnt pathway mutants (Millozet al. 2008; Grimbertet al.2016); suggesting that the coupling of competence and centering differs between the two species. Four alleles ofcov-3were available, permitting independent confirmation of candidate genes.
For genetic mapping, we chose the strain JU170. This wild O. tipulae isolate is genetically distant from CEW1 (the genetic background of all mutants) based on AFLP (Baïlle et al.2008). We resequenced JU170 to40-fold coverage and identified SNPs and indels that distinguish CEWI and JU170. We found one SNP every 95 bp on average, and a total of 632,027 SNPs (seeFigure S5). For comparison, the genetically distant strain used routinely inC. elegans mapping-by-sequencing (CB4856) has an average SNP density of 1 SNP every 1000 bp (Hillieret al.2008; Minevichet al.2012), which is 10-fold less.
We crossed cov-3 hermaphrodites (alleles mf35 and sy465) with JU170 males and selected F2grand-progeny dis-playing the recessivecov-3phenotype. After amplification by
selfing, F2-derived populations were pooled and genomic DNA extracted and sequenced (see Materials and Methods and Figure 2). To identify thecov-3mutations, afirst variant call was performed only on known JU170 SNPs, and their frequencies were plotted genome wide. Scaffolds containing the lowest JU170 allele frequency were retained. A second-pass call scanned these scaffolds for all other variants (excluding JU170 and other background variations). This analysis re-trieved only eight candidate mutations which were priori-tized according to their functional impact. In the sy463
pool, a putative 38-bp insertion was predicted to cause a frameshift in the nOt.2.0.1.t01002 gene, homologous to
Cel-mig-13. However, inspection of read pairing revealed
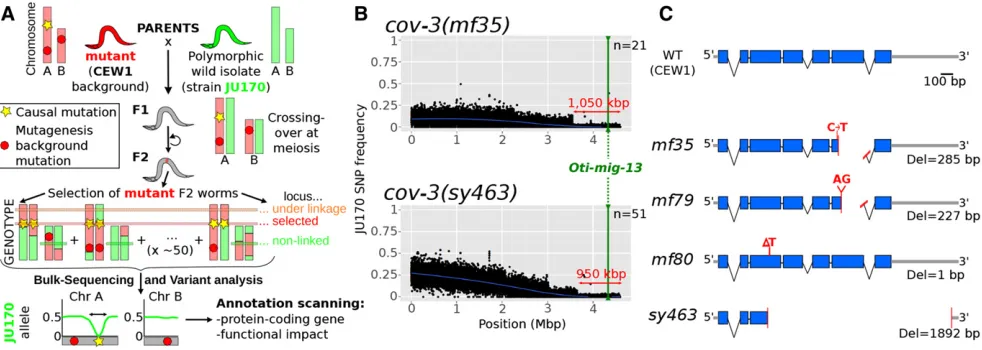
a much larger deletion (1888 bp) in this gene. No SNP variants were called at this locus for the mf35 pool, but inspection revealed a 283-bp deletion affecting the same gene (Figure S6). Such large deletions are expected to be less frequent than SNPs following EMS mutagenesis (Flibotte et al. 2010) and the variant toolkit we used is not optimal for identification of large indels.
Both mutations are predicted to result in truncation of the expressed protein, and thus are likely to be loss-of-function alleles. In the F2bulk-segregant data, JU170 allele frequency displayed a clear drop in the 1 Mb at the end of scaffold nOt.2.0.scaf00001, an interval that contains200 gene pre-dictions includingOti-mig-13(Figure 2). We conclude that Oti-mig-13 (nOt.2.0.1.t01002) is the best candidate gene for the cov-3 locus. To confirm this, the Oti-mig-13locus was amplified and directly sequenced from all four available, independently isolated cov-3 alleles:sy463,mf35, mf79, and
mf80. The deletions predicted from whole-genome resequenc-ing were confirmed insy463andmf35. In the trimethylpsoralen-ultraviolet (TMP-UV)-induced allelesmf79and mf80, two new frameshift-causing deletions were found, and these are thus also likely to be loss-of-function alleles (Figure 2). We have thus been able to use a draft genome assembly to identify a locus by mapping-by-sequencing. The O. tipulae cov-3locus is orthologous to C. elegans mig-13. Following standard nematode genetics nomenclature procedures, we redesignateOti-cov-3asOti-mig-13.
Table 2 Genomic characteristics ofO. tipulae
O. tipulae (assembly nOt.2.0)
Genome size (Mb) 59
Total intergenic span (Mb) (% of total genome)
21 (35.5%)
Total genic span (Mb) (% of total genome)
38 (64.5%)
Number of genes 14,938
Number of genes/Mbp 251
Mean/median transcript length (bp) 1,368/1,032
Mean/median exon length (bp) 160/132
Mean/median number of exons per gene
8.5/7
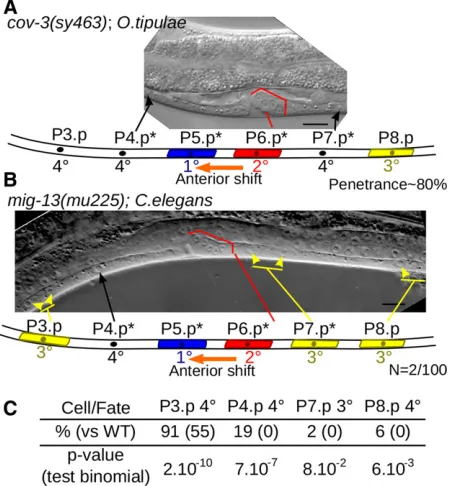
The role of mig-13 in vulva development has changed between C. elegans and O. tipulae
The MIG-13protein is predicted to be a single-pass,trans -membrane protein that contains two protein–protein interac-tion domains (a CUB domain and an LDL-receptor repeat), both extracellular.C. elegansandO. tipulaeMIG-13proteins are quite similar (48% aa identity and 63.5% similarity), with higher identity in CUB and LDL functional domains (Figure S7). Similar organization is observed inMIG-13homologs in other nematodes. InC. elegans,mig-13is necessary for the an-terior migration of the neuroblasts of the QR lineage (Symet al. 1999), butCel-mig-13was not known to play any role in vulva development. WhileO. tipulae cov-3mutants display a partially penetrant egg laying-defective phenotype, theC. elegansmig-13
mutants are not defective in egg laying. We further investigated
theCel-mig-13(mu225) null mutant using Nomarski microscopy
on a large number of animals. We observed an anterior shift of the 1°fate on P5.p, associated with decreased P4.p competence, a phenotype identical to theO. tipulae mig-13phenotype, with very low (2%) penetrance. Penetrance of this phenotype is 80% inO. tipulae(Louvet-Valléeet al.2003) (Figure 3, A and B). We also observed a more penetrant reduction in competence of vulval equivalence group cells inCel-mig13(mu255), where P(3,4,8).p adopt the noncompetent fused 4° fate more fre-quently than the competent uninduced 3° fate (Figure 3C). Thus,mig-13does play a role in vulva development inC. elegans, but the impact of its loss of function is reduced compared to O. tipulae, especially as far as the centering defect is concerned. The difference in the mutational phenotypic spectrum between the two species is thus likely to be due to a quantitative rather than a qualitative evolution of the contributions ofmig-13to the
vulva genetic network. This example demonstrates the power of streamlined forward genetics inO. tipulae, as it both uncovers the evolution of developmental mechanisms hidden by a highly conserved cell-fate pattern, and also reveals new aspects of C. elegansdevelopment, even in a well-studied system such as vulva formation.
Improvements of the O. tipulae genome assembly using genetic linkage data
The JU170 allele frequency plots provide genome-wide in-formation about genetic linkage that can be used to improve the genome assembly, both in identifying errors in assembly and in superscaffolding into linkage groups. Since many F2 lines are pooled in each data set, recombination events are averaged out and JU170 allele frequency (with mean of 0.5) should vary continuously, especially along scaffolds unlinked to the selected mutations. Following precedents (Leshchiner et al.2012), we used abrupt breaks in JU170 allele frequency in themf35andsy463data sets as indica-tions of mis-assembly. We confirmed overscaffolding by di-rect inspection of the aligned reads in 11 cases (Figure 4A). From the REAPR FCD score for each broken scaffold, we estimated heuristically an FCD cutoff value, and brokefive additional scaffolds that were not highlighted in the allele frequency plots (Figure 4B). Detection of mis-assemblies using allele-frequency plots is highly dependent on the posi-tion of the mapped mutant locus and the number of pooled F2 animals. However, allele frequency plots provide evidence-based criteria to inform cutoff parameters to assess the correct-ness of the whole assembly. The modifications outlined above were integrated in assembly version nOt.2.0.
Figure 2 Mapping-by-sequencing ofO. tipulae vulva mutants and identification ofcov-3 mutations in theOti-mig-13 gene. (A) Principle of the
mapping-by-sequencing approach, involving the wild isolate JU170 as a mapping strain and whole-genome resequencing of a bulk of mutant F2
grand-progeny (see text for details). The phenotype-causing mutation is mapped genetically by the cross as the region of low frequency of JU170 alleles.
Final identification requires scanning of this interval for variations specific to the mutant background. (B) JU170 allele frequency plots in scaffold
1 (genome version nOt.2.0.) in bulk-sequencing data generated with the independentcov-3allelesmf35andsy463(upper and lower plots respectively).
On each plot, the blue line is a local regression of the JU170 allele frequency, the red arrow indicates the mapping interval size, the green line
the position of themig-13gene, andnthe number of F2lines pooled in each mapping population. (C) Cartoon depicting the structure of the wild-type
A second kind of information present in JU170 allele frequencies is genetic linkage between scaffolds. In an F2 mapping population, a scaffold with a JU170 allele frequency significantly,0.5 indicates linkage to the mutation of inter-est. Scaffolds displaying a low mean JU170 allele frequency in thesy463data set were also consistently low in themf35
data set (see Figure 2B, Figure 5A, andFigure S8). We rea-soned that we could infer linkage over the whole genome by analyzing similar data for several independent loci distrib-uted over the genome. Following the same strategy as for cov-3, we generated and sequenced F2mapping populations from a cross between JU170 and 16 additional strains from ourO. tipulaemutant collection, corresponding to 14 differ-ent genetic loci (seeTable S3). Using the same pipeline as for cov-3, the genes mutated in these strains were almost all identified and they will be described in a future article focus-ing on the evolutionary changes in vulva development be-tween O. tipuale and C. elegans. Here, we only extracted the mean JU170 allele frequency of all scaffolds from each independent mapping data set, which does not require the causal mutations to be found. Using this approach, we sorted the genome into large chromosome-scale clusters, but which remain unordered (Figure S8).
While nematode genomes evolve rapidly, retention of chromosomal linkage in the absence of close synteny has been
observed in several comparisons (Stein et al.2003; Ghedin et al.2007; Dieterichet al.2008). We produced aC. elegans chromosome homology profile for each of the 36 largest scaf-folds (.100 kb, 79% of the assembly span) (Figure S9). For each scaffold, we observed that a majority of the genes had orthologs located on a single C. elegans chromosome. This pattern was strongest for genes mapping toC. elegans chro-mosomes I, II, III, IV; and weaker for chrochro-mosomes V and X. Clustering of these orthology-based profiles generated six groups (labeled A–F in Figure S8 and Figure S9) that are likely to represent the sixO. tipulaechromosomes observed by microscopy (Ahn and Winter 2006). We reasoned that if these orthology-driven clusters represent real chromosomes, they should also cluster by linkage. Indeed, orthology-driven clusters A, B, C, and D were fully preserved in the linkage clusters. We thus labeled by homology the corresponding clusters as part ofO. tipulaechromosomes I, II, III, and IV, respectively, because the majority of genes in these linkage groups have their C. elegansortholog in the corresponding chromosome (Figure S9).
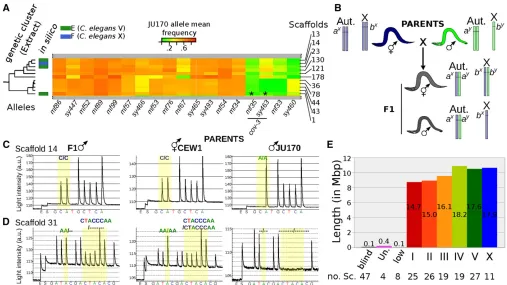
In contrast, two scaffolds assignedin silicoto group E and one assigned to group F were not genetically linked to other scaffolds of the respective group. Consideration of their con-tent of orthologs suggested they should instead be swapped between these two chromosomes (Figure 5A andFigure S8). It was not possible to assign a clearC. eleganschromosome homology for these two remaining genetic clusters since they each have many orthologs in bothC. eleganschromosomes V and X (Figure S9). To determine whichO. tipulae chromo-some is the sex chromochromo-some, we directly genotyped F1males from a cross between the reference strain CEW1 and the polymorphic strain JU170. Markers were designed from the larger scaffolds of groups E and F and animals were geno-typed by pyrosequencing. X0-males will be hemizygous for any X-linked markers, but diploid and thus heterozygous for autosomal markers that distinguish CEWI and JU170 (Figure 5, B–D) (Srinivasan et al. 2002). This strategy identified group E as representing the X chromosome, confirming pre-vious observations of X-linkage forcov-3(Louvet-Valléeet al. 2003) andmf33(M.-A. Félix, unpublished data).Cel-mig-13
is on theC. elegansX chromosome. This assignment suggests that there have been substantial rearrangements involving what are now the C. elegansandO. tipulaeV and X chro-mosomes. The genotyping also identified an additional mis-assembled scaffold (scaffold 8, Figure S10). We fur-ther annotated our preliminary chromosome assembly with the scaffold position of telomeres (File S1).
The scaffolds assigned to a chromosome corresponded to 99.5% of the genome. The remaining scaffolds were all small (Figure 5E). A group of 47 scaffolds that bear no genomic variants between JU170 andCEW1cannot be mapped in this cross. Four scaffolds had a consistently high JU170 allele frequency across all genetic mapping data sets and are likely to be regions that happened to be genetically unlinked to all loci that were mapped in this study. Eight scaffolds had a con-sistently rather low mean JU170 allele frequency (20–25%) Figure 3 Conservation and evolution of MIG-13 betweenC. elegansand
O. tipulae. (A) Typical phenotype of aOti-cov-3mutant, shown in a Nomarski picture and an interpretation cartoon below: an anterior shift
(1°fate shifted from P6.p to P5.p) is coupled to a reduced competence of
vulva precursor cells.*indicates Pn.p cells with a modified fate compared
to the wild type. (B) Acov-3-like phenotype can be observed at very low
frequency in amig-13null mutant,Cel-mig13(mu225), ofC. elegans. (C)
Reduced competence of P3,4,8.p cells inCel-mig-13(mu225) is indicated
and clustered together. Their low frequency of JU170 alleles could be an artifact due to problems of read mapping in di-vergent, repeated, or mis-assembled regions, or may be due to transmission distortion in the cross between two wild isolates as seen inC. elegans(Seidelet al.2008) orC. briggsae(Ross et al. 2011). For our mapping-by-sequencing approach, we flagged putative causative mutations associated with these scaffolds, but will return to them to attempt linkage attribution in the future.
Discussion
A draft assembly with a high quality provides a useful and versatile resource for a new nematode species
We assembled a rapid draft assembly for the reference CEWI strain ofO.tipulaefrom relatively inexpensive Illumina short-read data. The assembly has good contiguity and gene con-tent metrics, and appears to represent theO. tipulaegenome well. It ranks among the better nematode genome assemblies alongside the complete C. elegans andOnchocerca volvulus assemblies and the almost complete Strongyloides ratti, C. briggsae, and Candida tropicalis assemblies, on which considerablefinishing effort has been expended (C.elegans Sequencing Consortium 1998; Steinet al.2003; Hillieret al. 2007; Koboldt et al.2010; Ross et al. 2011; Cottonet al. 2016; Huntet al.2016). The high quality of theO. tipulae assembly is likely to be a result of the high homozygosity in the inbred strain sequenced (Barrière et al.2009) and the small genome size (and concomitant reduced contribution of repeats,Table S2). The total genome length in our assem-bly is 40% shorter than a previous estimate from reassocia-tion kinetics (Ahn and Winter 2006). We found no evidence for missing genetic content, or a large span of overcollapsed repeats. It is perhaps more likely that the reassociation kinetics-based estimate is in error, as was observed forA. thaliana [actual genome span of 135 Mb (The Arabidopsis Ge-nome Initiative 2000),flow cytometry estimate of150 Mb (Bennett et al. 2003), reassociation kinetics estimate of 70–80 Mb (Leutwileret al.1984)].
Regardless of the specific advantages ofO. tipulae, achiev-ing high-quality draft assemblies at reasonable cost is now
feasible for a wide range of species. Advances in sequencing technologies and assembly algorithms can be combined to enable high contiguity assemblies, even from highly hetero-zygous organisms. For example, Fierstet al.(2015) recently produced a 131-Mb assembly of the highly polymorphic out-crossing C. remaneiin only 1600 scaffolds, using a mix of short insert and mate-pair libraries, as we did here. We also found marked differences between assemblers, even those based on the same underlying algorithm. Comparisons of assembly toolkits have been made in several“Assemblathon” competitions, and from these it is clear that, while some as-semblers do perform better consistently, customization of ap-proach is key to optimal assembly (Earlet al.2011; Bradnam et al. 2013). As the assumptions made in the coding of dif-ferent assemblers may interact difdif-ferently with the particular patterns of genome structure and diversity present in a target species, it may still be useful to assess several different as-semblers in parallel for each new genome.
The O. tipulaeassembly could still be improved. Long-read sequence data from Pacific Biosciences, Oxford Nano-pore, or 103Genomics platforms could be used to further contiguate the genome. Long-range physical mapping using the BioNano or OpGen optical-mapping platforms could be used to superscaffold the existing assembly. Both of these approaches could yield chromosomal-sized scaffolds. Tradi-tional genetic map production from a large mapping cross could also be used to bin and order scaffolds in a linkage map, and validate the sequence- or physical-based assembly. Genotyping-by-sequencing approaches such as restriction site-associated DNA sequencing (Bairdet al. 2008; Baxter et al.2011; Fierstet al.2015) or other reduced-representation sequencing methods would provide the density of markers required at minimal cost. Low-coverage, whole-genome skimming; for example, of recombinant inbred lines as ap-plied in C. elegans(Li et al. 2006; Doroszuket al. 2009; Rockman and Kruglyak 2009), C. briggsae (Hillier et al. 2007; Rosset al.2011), andP. pacificus(Srinivasanet al. 2002); would serve the same goal. We were able to lever-age the data generated from bulk-segregant identification of selected markers in a “virtuous circle”to also improve the assembly, binning scaffolds representing 99.5% of the Figure 4 Mapping-by-sequencing detects mis-assembly. Variant analysis was performed using the preliminary assembly (nOt.1.0). Plots obtained from
mapping-by-sequencing data set from thecov-3(sy463) mapping
population. JU170 allele frequency is plotted in upper graphs for each SNP along (A) contig 16 or (B) contig 4 and the coverage is indicated below. Blue lines are local regressions of the allele frequency or of the
cov-erage. (A) Contig 16:)indicates a sudden shift in
assembly into putative chromosomal groups and will con-tinue to do so with further mutations.
A complete assembly of theO. tipulaegenome will require significant additional effort, but until that goal is achieved, we have shown that the existing assembly is a sufficient sub-strate for mapping of mutants and identification of genes. It is also highly informative concerning genome evolutionary dynamics in the Rhabditinae. The genome is available for browsing and download athttp://ensembl.caenorhabditis. org/Oscheius_tipulae_not2/Info/Index.
Toward universal forward genetics?
For thefirst time, we successfully identified without a candidate-gene approach a phenotype-causing candidate-gene inO. tipulae, namely theOti-mig-13gene corresponding to the previously described cov-3vulva mutants (Louvet-Valléeet al.2003). Our pipeline is similar to those developed for model species (Schneeberger et al. 2009; Minevichet al.2012; Jameset al. 2013). The fragmentation of the genome into200 contigs did not impair
our ability to identify causative lesions. Three of the four muta-tions we identified inOti-mig-13 were large deletions, including two derived from EMS mutagenesis screens. While TMP-UV mutagenesis is chosen because of its propensity to induce deletions, mutations induced by EMS are thought to mainly comprise G/C to A/T transitions (Anderson 1995); but they can also include a significant proportion of deletions, es-pecially after screens for strong loss-of-function mutations (Flibotte et al. 2010;C.elegans Deletion Mutant Consortium 2012).
Our results suggest that most good-quality draft genome assemblies will be sufficient to allow the identification of loci identified by forward genetics. Methods have been developed that directly identifyfixed differences in raw whole-genome sequencing data without mapping to an assembly (Nordström et al.2013). This linkage- and reference-free strategy is par-ticularly useful in organisms, such as plants, with large and repetitive genomes, because assembling such genomes is still challenging (Schneeberger 2014). However, this approach Figure 5 Building a chromosome-scale assembly of theO. tipulaedraft assembly. (A) TheO. tipulaecluster of scaffolds that correspond to the X
chromosome. This cluster was selected from a global clustering based on JU170 allele mean frequency across 18 F2mapping populations. The entire
heatmap is shown inFigure S8. Each column of the heatmap corresponds to an independent F2mapping population (Table S3) and each rectangle to
the mean frequency of JU170 alleles in a scaffold. Scaffold identifiers are listed on the right side of the heatmap and the color scale is given above. If
available, the prediction made from orthology-driven clusters (Figure S9) is indicated on the left side of the heat map.*indicates scaffolds where the
causativecov-3mutation has been found. (B) Method to distinguish autosome-linkedvs.X-linked loci.aandbloci are on an autosome (Aut.) and the X
chromosome, respectively, and are polymorphic between two strains (allelesxandy). While F1hermaphrodites are heterozygotes for both loci, F1males
are homozygotes for the X-linked locus and bear the maternal allele. (C and D) Pyrograms of an F1male progeny (left) from a CEW1 hermaphrodite
(middle) and a JU170 male (right): genotyping was performed with polymorphic markers in scaffold 14 and 31 (assembly nOt.2.0.), which are placed in genetic clusters (C and D), respectively. Scaffold 14 is linked to X while scaffold 31 is linked to an autosome. (E) Cumulative length of each cluster of
scaffolds. Numbers within bars are percent of the whole assembly, numbers below the chart count the number of scaffolds in each cluster.♀, female;♂,
tends to output more candidate variants, and cannot exclude candidates by linkage. This is critical, as downstream valida-tion of candidates is time consuming and occasionally not technically possible in nonmodel species. For Nematoda, where genomes are generally small, a pipeline with ade novo reference assembly and mapping by bulk-segregant analysis is very efficient.
Many nematode species are attractive subjects for labora-tory research, thanks to their small size, fast life cycle, large broods, and simplicity of culture. The fact that many species can be cryopreserved simplifies genetic approaches. Many genetically diverse isolates are available from wild sampling collections for each species for generation of mapping pop-ulations. Facultative selfing has evolved multiple independent times in the phylum, and this, as inC. elegans, significantly simplifies genetic analyses. The homozygosing effect of self-ing also ensures easier genome assembly, but high-quality genomic resources can still be built for obligate outcrossers, such asC. remanei(Fierstet al.2015). Thus, many new nem-atode species, selfing or outcrossing, could now be turned into genetic model systems. The real bottleneck will be the development of functional genetic tools to validate the iden-tified candidate genes. However, the revolution brought by the CRISPR-Cas9 system for genome editing may solve this issue, as shown by the recent successful implementations of this versatile technique in various nematode species other than C. elegans, includingP. pacificus(Witteet al.2015, p. 201) and C. briggsae(Culpet al.2015).
Evolution of development of the vulva in nematodes
We exemplify the relevance of the comparative genetic ap-proach with our analyses of the evolution of the role ofmig-13
in nematode vulva development. First, this gene would not have been investigated in a targeted reverse genetic study: phenotype-based screens ensure unexpectedfindings about genetic innovation. Second, althoughC. elegansvulva devel-opment has been studied in exquisite detail, thefindings in O. tipulaeallowed us to uncover a role formig-13inC. elegans vulval development. The precise involvement of mig-13 in vulva development remains an open question. MIG-13 in C. eleganswas known to be required for the anterior migration of the QR neuroblast (Symet al.1999, p. 1). Lrp12, a mouse trans-membrane protein containing CUB and LDL repeats, is expressed in populations of migrating and polarized neurons during corticogenesis (Schneideret al.2011) and can partially rescue aC. elegansmig-13mutant (Wanget al.2013). Although the mechanism of action of mig-13 in neuroblast migration remains elusive, it likely acts cell autonomously to polarize the actin skeleton at the leading edge of the migrating cell (Wanget al.2013). As reported previously (Symet al.1999), we were unable to detectmig-13expression in the Pn.p vulva precursor cells inC. elegans, but this could be due to a weak expression [as in QR neurons (Wanget al.2013)]. A cell-autonomous role ofMIG-13in migration of Pn.p cells could explain the centering phenotype observed inO. tipulae, al-though the mechanism of its effect on competence is less
clear. In C. elegans, although vulval precursor cells move (Grimbertet al.2016), this movement could be of reduced importance for proper centering of the cell fate pattern on P6.p. This reduced role would explain whycovphenotypes are not penetrant. It is tempting to speculate that MIG-13 acts as a receptor, but no ligand or protein partner has been identified. Finally, since a mixture of competence and cen-tering phenotypes have been reported in Wnt mutants ofC. elegans(Eisenmannet al.1998; Millozet al.2008; Grimbert et al.2016), it will be important to test whether the Wnt and
the mig-13 pathways interact during vulva development,
and whether the Wnt pathway is disrupted in otherO. tipulae covmutants. Interestingly,mig-13appears to be absent from theP. pacificusgenome. Comparing vulva development in the three species will provide a useful framework to polarize evolutionary changes and understand the genetic basis of phenotypic change and stasis despite pervasive develop-mental system drift.
In conclusion, we have shown how a draftde novogenome assembly can be used to identify phenotype-causing muta-tions in a nonmodel species. Our method does not require physical or genetic maps of the genome. In addition to further understanding of key developmental mechanisms in nema-todes, the new assembly will be a useful resource for phylum-wide nematode genome analyses. We validated our approach by successfully identifyingOti-mig-13as the gene responsible for the vulva mutant phenotypes described incov-3mutants (Louvet-Valléeet al.2003). Our results pave the way for the identification of further O. tipulae mutations. Mapping-by-sequencing provides further linkage information, creating a virtuous circle between genome assembly and mutant map-ping. More broadly, this work shows that the combination of better assembly techniques and mapping-by-sequencing now makes forward genetics realistic in nonmodel species.
Acknowledgments
theCaenorhabditisGenetics Center, which is funded by the National Institutes of Health Office of Research Infrastruc-ture Programs (P40 OD-010440). The authors declare that they have no competing interests.
Author contributions: M.-A.F. designed the project. F.B., M.-A.F., and S.D. performed the experiments. M.B. designed the sequencing scheme and supervised the downstream anal-ysis. G.K. carried out the assembly and genomic analanal-ysis. F.B. implemented the mapping-by-sequencing workflow, conducted assembly improvements, and the genetic linkage analysis. F.B., M.-A.F., and S.D. mapped, identified, and confirmed the mutants. F.B., M.A.F., M.B., and G.K. wrote the article. All authors read and approved thefinal manuscript.
Literature Cited
Abe, A., S. Kosugi, K. Yoshida, S. Natsume, H. Takagi et al.,
2012 Genome sequencing reveals agronomically important
loci in rice using MutMap. Nat. Biotechnol. 30: 174–178.
Ahn, I. Y., and C. E. Winter, 2006 The genome of Oscheius tipulae:
determination of size, complexity, and structure by DNA
reassocia-tion usingfluorescent dye. Genome 49: 1007–1015.
Anderson, P., 1995 Mutagenesis. Methods Cell Biol. 48: 31–58.
Andrews, S., 2010 FastQC A Quality Control Tool for High
Throughput Sequence Data. http://www.bioinformatics.babraham.
ac.uk/projects/fastqc/.
Baïlle, D., A. Barrière, and M.-A. Félix, 2008 Oscheius tipulae, a
widespread hermaphroditic soil nematode, displays a higher ge-netic diversity and geographical structure than Caenorhabditis
elegans. Mol. Ecol. 17: 1523–1534.
Baird, N. A., P. D. Etter, T. S. Atwood, M. C. Currey, A. L. Shiver et al., 2008 Rapid SNP discovery and genetic mapping using sequenced RAD markers. PLoS One 3: e3376.
Bankevich, A., S. Nurk, D. Antipov, A. A. Gurevich, M. Dvorkinet al.,
2012 SPAdes: a new genome assembly algorithm and its
appli-cations to single-cell sequencing. J. Comput. Biol. 19: 455–477.
Barrière, A., S.-P. Yang, E. Pekarek, C. G. Thomas, E. S. Haaget al.,
2009 Detecting heterozygosity in shotgun genome assemblies:
lessons from obligately outcrossing nematodes. Genome Res.
19: 470–480.
Baxter, S. W., J. W. Davey, J. S. Johnston, A. M. Shelton, D. G.
Heckel et al., 2011 Linkage mapping and comparative
geno-mics using next-generation RAD sequencing of a non-model organism. PLoS One 6: e19315.
Bennett, M. D., I. J. Leitch, H. J. Price, and J. S. Johnston,
2003 Comparisons with Caenorhabditis (100 Mb) and
Dro-sophila (175 Mb) usingflow cytometry show genome size
in Arabidopsis to be157 Mb and thus25% larger than the
Arabidopsis genome initiative estimate of 125 Mb. Ann.
Bot. 91: 547–557.
Bento, G., A. Ogawa, and R. J. Sommer, 2010 Co-option of the
hormone-signalling module dafachronic acid-DAF-12 in
nema-tode evolution. Nature 466: 494–497.
Blaxter, M. L., P. De Ley, J. R. Garey, L. X. Liu, P. Scheldemanet al.,
1998 A molecular evolutionary framework for the phylum
Nematoda. Nature 392: 71–75.
Boisvert, S., F. Laviolette, and J. Corbeil, 2010 Ray: simultaneous
assembly of reads from a mix of high-throughput sequencing
technologies. J. Comput. Biol. 17: 1519–1533.
Bradnam, K. R., J. N. Fass, A. Alexandrov, P. Baranay, M. Bechner et al., 2013 Assemblathon 2: evaluating de novo methods of genome assembly in three vertebrate species. Gigascience 2: 10.
Brenner, S., 1974 The genetics of Caenorhabditis elegans.
Genet-ics 77: 71–94.
Burgess, D. J., 2011 Evo-devo: hidden rewiring comes to light.
Nat. Rev. Genet. 12: 586.
C. elegansDeletion MutantConsortium, 2012 Large-scale screening
for targeted knockouts in theCaenorhabditis elegansgenome. G3
(Bethesda) 2: 1415–1425.
C.elegansSequencing Consortium, 1998 Genome sequence of the nematode C. elegans: a platform for investigating biology.
Sci-ence 282: 2012–2018 [corrigenda: Science 283: 35 (1999);
Sci-ence 283: 2103 (1999); SciSci-ence 285: 1493 (1999)].
Chikhi, R., and P. Medvedev, 2014 Informed and automated k-mer
size selection for genome assembly. Bioinformatics 30: 31–37.
Cingolani, P., A. Platts, L. L. Wang, M. Coon, T. Nguyenet al., 2012 A
program for annotating and predicting the effects of single nucle-otide polymorphisms, SnpEff: SNPs in the genome of Drosophila
melanogaster strain w1118; iso-2; iso-3. Fly (Austin) 6: 80–92.
Clark, S. C., R. Egan, P. I. Frazier, and Z. Wang, 2013 ALE: a
generic assembly likelihood evaluation framework for assessing the accuracy of genome and metagenome assemblies.
Bioinfor-matics 29: 435–443.
CLC bio, 2014 CLC Assembly Cell.https://www.qiagenbioinformatics.
com/products/clc-assembly-cell/.
Cotton, J. A., S. Bennuru, A. Grote, B. Harsha, A. Tracey et al.,
2016 The genome of Onchocerca volvulus, agent of river
blind-ness. Nat. Microbiol. 2: 16216.
Culp, E., C. Richman, D. Sharanya, and B. Gupta, 2015 Genome
editing in Caenorhabditis briggsae using the CRISPR/Cas9 Sys-tem. bioRxiv 021121. DOI: https://doi.org/10.1101/021121.
De Ley, P., and M. L. Blaxter, 2002 Systematic position and
phy-logeny, pp. 1–30 inThe Biology of Nematodes, edited by D. Lee.
Taylor and Francis, London.
DePristo, M. A., E. Banks, R. Poplin, K. V. Garimella, J. R. Maguire et al., 2011 A framework for variation discovery and genotyp-ing usgenotyp-ing next-generation DNA sequencgenotyp-ing data. Nat. Genet. 43:
491–498.
Dichtel, M. L., S. Louvet-Vallée, M. E. Viney, M. A. Félix, and P. W.
Sternberg, 2001 Control of vulval cell division number in the
nematode Oscheius/Dolichorhabditis sp. CEW1. Genetics 157:
183–197.
Dichtel-Danjoy, M.-L., and M.-A. Félix, 2004 The two steps of
vulval induction in Oscheius tipulae CEW1 recruit common
reg-ulators including a MEK kinase. Dev. Biol. 265: 113–126.
Dieterich, C., S. W. Clifton, L. N. Schuster, A. Chinwalla, K. Delehaunty et al., 2008 The Pristionchus pacificus genome provides a unique perspective on nematode lifestyle and parasitism. Nat. Genet. 40:
1193–1198.
Doroszuk, A., L. B. Snoek, E. Fradin, J. Riksen, and J. Kammenga,
2009 A genome-wide library of CB4856/N2 introgression lines
of Caenorhabditis elegans. Nucleic Acids Res. 37: e110.
Duveau, F., and M.-A. Félix, 2010 Evolution of sex determination
in C. elegans. hidden variation mapped. Heredity 105: 423–425.
Earl, D., K. Bradnam, J. St John, A. Darling, D. Lin et al.,
2011 Assemblathon 1: a competitive assessment of de novo
short read assembly methods. Genome Res. 21: 2224–2241.
Eisenmann, D. M., J. N. Maloof, J. S. Simske, C. Kenyon, and S. K.
Kim, 1998 The beta-catenin homolog BAR-1 and LET-60 Ras
coordinately regulate the Hox gene lin-39 during
Caenorhabdi-tis elegans vulval development. Development 125: 3667–3680.
Ellis, R. E., and S.-Y. Lin, 2014 The evolutionary origins and
con-sequences of self-fertility in nematodes. F1000Prime Rep. 6: 62.
Emms, D. M., and S. Kelly, 2015 OrthoFinder: solving
fundamen-tal biases in whole genome comparisons dramatically improves orthogroup inference accuracy. Genome Biol. 16: 157.
Fekih, R., H. Takagi, M. Tamiru, A. Abe, S. Natsume et al.,
2013 MutMap+: genetic mapping and mutant identification
Félix, M.-A., 2006 Oscheius tipulae(August 16, 2006),WormBook,
ed. TheC. elegansResearch Community, WormBook, doi/10.1895/
wormbook.1.119.1,http://www.wormbook.org.
Félix, M. A., and P. W. Sternberg, 1997 Two nested gonadal
induc-tions of the vulva in nematodes. Development 124: 253–259.
Félix, M.-A., M. Delattre, and M.-L. Dichtel, 2000 Comparative
developmental studies using Oscheius/Dolichorhabditis sp. CEW1
(Rhabditidae). Nematology 2: 89–98.
Félix, M. A., A. Vierstraete, and J. Vanfleteren, 2001 Three biological
species closely related to Rhabditis (Oscheius) pseudodolichura
Körner in Osche, 1952. J. Nematol. 33: 104–109.
Fierst, J. L., J. H. Willis, C. G. Thomas, W. Wang, R. M. Reynoldset al.,
2015 Reproductive mode and the evolution of genome size and
structure in Caenorhabditis nematodes. PLoS Genet. 11: e1005323.
Flibotte, S., M. L. Edgley, I. Chaudhry, J. Taylor, S. E. Neil et al.,
2010 Whole-genome profiling of mutagenesis in
Caenorhabdi-tis elegans. Genetics 185: 431–441.
Ghedin, E., S. Wang, D. Spiro, E. Caler, Q. Zhaoet al., 2007 Draft
genome of the Filarial nematode parasite brugia malayi. Science
317: 1756–1760.
Gnerre, S., I. MacCallum, D. Przybylski, F. J. Ribeiro, J. N. Burton et al., 2011 High-quality draft assemblies of mammalian ge-nomes from massively parallel sequence data. Proc. Natl. Acad.
Sci. USA 108: 1513–1518.
Grimbert, S., K. Tietze, M. Barkoulas, P. W. Sternberg, M.-A. Félix et al., 2016 Anchor cell signaling and vulval precursor cell positioning establish a reproducible spatial context during C.
elegans vulval induction. Dev. Biol. 416: 123–135.
Gupta, B. P., R. Johnsen, and N. Chen, 2007 Genomics and
bi-ology of the nematode Caenorhabditis briggsae (May 3, 2007), WormBook, ed. TheC. elegansResearch Community, WormBook,
doi/10.1895/wormbook.1.136.1,http://www.wormbook.org.
Hillier, L. W., R. D. Miller, S. E. Baird, A. Chinwalla, L. A. Fulton et al., 2007 Comparison of C. elegans and C. briggsae genome sequences reveals extensive conservation of chromosome orga-nization and synteny. PLoS Biol. 5: e167.
Hillier, L. W., G. T. Marth, A. R. Quinlan, D. Dooling, G. Fewell et al., 2008 Whole-genome sequencing and variant discovery
in C. elegans. Nat. Methods 5: 183–188.
Holt, C., and M. Yandell, 2011 MAKER2: an annotation pipeline
and genome-database management tool for second-generation genome projects. BMC Bioinformatics 12: 491.
Holterman, M., A. van der Wurff, S. van den Elsen, H. van Megen, T.
Bongerset al., 2006 Phylum-wide analysis of SSU rDNA reveals
deep phylogenetic relationships among nematodes and accelerated
evolution toward crown clades. Mol. Biol. Evol. 23: 1792–1800.
Hunt, M., T. Kikuchi, M. Sanders, C. Newbold, M. Berrimanet al.,
2013 REAPR: a universal tool for genome assembly
evalua-tion. Genome Biol. 14: R47.
Hunt, V. L., I. J. Tsai, A. Coghlan, A. J. Reid, N. Holroyd et al.,
2016 The genomic basis of parasitism in the Strongyloides
clade of nematodes. Nat. Genet. 48: 299–307.
James, G. V., V. Patel, K. J. Nordström, J. R. Klasen, P. A. Salomé et al., 2013 User guide for mapping-by-sequencing in Arabi-dopsis. Genome Biol. 14: R61.
Kelley, D. R., M. C. Schatz, and S. L. Salzberg, 2010 Quake:
qual-ity-aware detection and correction of sequencing errors. Ge-nome Biol. 11: R116.
Kienle, S., and R. J. Sommer, 2013 Cryptic variation in vulva
de-velopment by cis-regulatory evolution of a HAIRY-binding site. Nat. Commun. 4: 1714.
Kiontke, K., A. Barrière, I. Kolotuev, B. Podbilewicz, R. Sommer et al., 2007 Trends, stasis, and drift in the evolution of
nema-tode vulva development. Curr. Biol. CB 17: 1925–1937.
Koboldt, D. C., J. Staisch, B. Thillainathan, K. Haines, S. E. Baird et al., 2010 A toolkit for rapid gene mapping in the nematode Caenorhabditis briggsae. BMC Genomics 11: 236.
Korf, I., 2004 Genefinding in novel genomes. BMC Bioinformatics
5: 59.
Koutsovoulos, G., B. Makepeace, V. N. Tanya, and M. Blaxter,
2014 Palaeosymbiosis revealed by genomic fossils of
Wolba-chia in a strongyloidean nematode. PLoS Genet. 10: e1004397.
Kumar, S., G. Koutsovoulos, G. Kaur, and M. Blaxter, 2012 Toward
959 nematode genomes. Worm 1: 42–50.
Kumar, S., M. Jones, G. Koutsovoulos, M. Clarke, and M. Blaxter,
2013 Blobology: exploring raw genome data for contaminants,
symbionts and parasites using taxon-annotated GC-coverage plots. Front. Genet. 4: 237.
Leshchiner, I., K. Alexa, P. Kelsey, I. Adzhubei, C. A. Austin-Tse et al., 2012 Mutation mapping and identification by
whole-genome sequencing. Genome Res. 22: 1541–1548.
Leutwiler, L., B. Hough-Evans, and E. M. Meyerowitz, 1984 The
DNA of Arabidopsis thaliana. Mol. Gen. Genet. 194: 15–23.
Li, H., and R. Durbin, 2009 Fast and accurate short read alignment
with Burrows-Wheeler transform. Bioinformatics 25: 1754–1760.
Li, L., D. Li, S. Liu, X. Ma, C. R. Dietrich et al., 2013 The maize
glossy13 gene, cloned via BSR-Seq and Seq-walking encodes a putative ABC transporter required for the normal accumulation of epicuticular waxes. PLoS One 8: e82333.
Li, Y., O. A. Alvarez, E. W. Gutteling, M. Tijsterman, J. Fu et al.,
2006 Mapping determinants of gene expression plasticity by
genetical genomics in C. elegans. PLoS Genet. 2: e222. Liu, S., C.-T. Yeh, H. M. Tang, D. Nettleton, and P. S. Schnable,
2012 Gene mapping via bulked segregant RNA-Seq (BSR-Seq).
PLoS One 7: e36406.
Liu, T., L. Yu, L. Liu, H. Li, and Y. Li, 2015 Comparative
tran-scriptomes and EVO-DEVO studies depending on next genera-tion sequencing. Comput. Math. Methods Med. 2015: 896176. Louvet-Vallée, S., I. Kolotuev, B. Podbilewicz, and M.-A. Félix,
2003 Control of vulval competence and centering in the
nem-atode Oscheius sp. 1 CEW1. Genetics 163: 133–146.
Luo, R., B. Liu, Y. Xie, Z. Li, W. Huanget al., 2012 SOAPdenovo2:
an empirically improved memory-efficient short-read de novo
assembler. Gigascience 1: 18.
Marçais, G., and C. Kingsford, 2011 A fast, lock-free approach for
efficient parallel counting of occurrences of k-mers.
Bioinfor-matics 27: 764–770.
Martin, M., 2011 Cutadapt removes adapter sequences from
high-throughput sequencing reads. EMBnet.journal 17: 10–12.
Mascher, M., M. Jost, J.-E. Kuon, A. Himmelbach, A. Aßfalget al.,
2014 Mapping-by-sequencing accelerates forward genetics in
barley. Genome Biol. 15: R78.
McKenna, A., M. Hanna, E. Banks, A. Sivachenko, K. Cibulskiset al.,
2010 The genome analysis toolkit: a MapReduce framework
for analyzing next-generation DNA sequencing data. Genome
Res. 20: 1297–1303.
Michelmore, R. W., I. Paran, and R. V. Kesseli, 1991 Identification
of markers linked to disease-resistance genes by bulked
segre-gant analysis: a rapid method to detect markers in specific
ge-nomic regions by using segregating populations. Proc. Natl.
Acad. Sci. USA 88: 9828–9832.
Milloz, J., F. Duveau, I. Nuez, and M.-A. Félix, 2008 Intraspecific
evolution of the intercellular signaling network underlying a
robust developmental system. Genes Dev. 22: 3064–3075.
Milne, I., G. Stephen, M. Bayer, P. J. A. Cock, L. Pritchard et al.,
2013 Using tablet for visual exploration of second-generation
sequencing data. Brief. Bioinform. 14: 193–202.
Minevich, G., D. S. Park, D. Blankenberg, R. J. Poole, and O. Hobert,
2012 CloudMap: a cloud-based pipeline for analysis of mutant
genome sequences. Genetics 192: 1249–1269.
Nordström, K. J. V., M. C. Albani, G. V. James, C. Gutjahr, B. Hartwig et al., 2013 Mutation identification by direct comparison of whole-genome sequencing data from mutant and wild-type individuals