Comparison of Three Stations’ PM10 Data for
Istanbul, Turkey
Pelin Cansu Çavuş1, Ali Deniz1, Nida Doğan1, İbrahim Akbayır1, Veli Yavuz1
Department of Meteorological Engineering, Faculty of Aeronautics and Astronautics, İstanbul Technical University,
Istanbul, Turkey1
ABSTRACT: Air pollution is effective problem for environment and the health issues. Local investigation of air pollution is gained importance in recently years, because of increasing effects. Especially, on health problems are caused by decreasing on air quality. Metropolitan cities are more suitable for increasing of air pollution. One of the cities under great risk in Turkey is Istanbul. Because of population, transportation, heating, etc. Air pollution analysis of previous years is necessary to take prevention against future risks. In this study, PM10 data are statically analysed which are received from three different air quality stations, Kagithane, Besiktas, and Sariyer in Istanbul, Turkey for 2013-2014 years’ period.
KEYWORDS: PM10, Statically Analysis, Air Pollution, Istanbul.
I. INTRODUCTION
In recent years, damages of air pollution have become a situation which cannot be ignored. All man-made (anthropogenic) emissions into the air can be called air pollution, because they alter the chemical composition of the natural atmosphere. The rise in the global concentrations of greenhouse gases CO2, CH4, and N2O, can be called air pollution using this approach, even though the concentrations have not found to be toxic for humans and the ecosystem [1]. One can refine this approach and only consider anthropogenic emissions of harmful chemicals as air pollution [2]. Most common pollutants are particle pollution (often referred to as particulate matter), ground-level ozone, carbon monoxide, sulphur oxides, nitrogen oxides, and lead. These pollutants can harm your health and the environment, and cause property damage [4]. Of the six pollutants, particle pollution and ground-level ozone are the most widespread health threats. EPA calls these pollutants "criteria" air pollutants because it regulates them by developing human health-based and/or environmentally-health-based criteria (science-health-based guidelines) for setting permissible levels. The set of limits based on human health is called primary standards. Another set of limits intended to prevent environmental and property damage is called secondary standards [4].
In this study, particulate matter is choosing for analysing of local air pollution distribution. Particle pollution is a mixture of microscopic solids and liquid droplets suspended in air. This pollution, also known as particulate matter, is made up of a number of components, including acids (such as nitrates and sulphates), organic chemicals, metals, soil or dust particles, and allergens (such as fragments of pollen or mould spores). The size of particles is directly linked to their potential for causing health problems. Larger particles are of less concern, although they can irritate your eyes, nose, and throat. Small particles of concern include "fine particles" (such as those found in smoke and haze), which are 2.5 micrometres in diameter or less; and "coarse particles" (such as those found in wind-blown dust), which have diameters between 2.5 and 10 micrometres’ [3].
lung function and the development of chronic bronchitis and even premature death. Short-term exposures to particles (hours or days) can aggravate lung disease, causing asthma attacks and acute bronchitis, and may also increase susceptibility to respiratory infections. In people with heart disease, short-term exposures have been linked to heart attacks and arrhythmias.
These problems can be avoided with necessary precautions. Analyse of air pollution is important for air quality. In this study, PM10 data are statically analysed which are received from three different air quality stations, Kagithane, Besiktas, Sariyer in Istanbul, Turkey for 2013-2014 years period.
II. METHODOLOGY
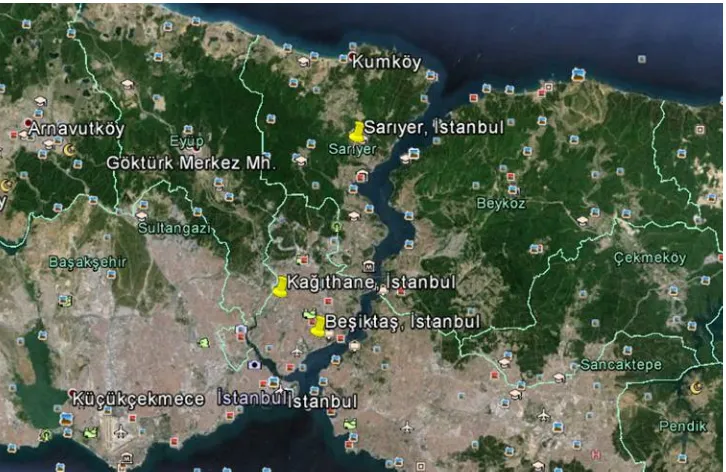
Istanbul is the most important city in Turkey, constituting the country's economic, cultural, and historical heart. Istanbul is a transcontinental city in Eurasia, with its commercial and historical center lying on the European side and about a third of its population living on the Asian side of Eurasia. With a population of 14.4 million, the city forms the largest urban agglomeration in Europe as well as the largest in the Middle East, and the sixth-largest city proper in the world. Istanbul's vast area of 5,343 square kilometers (2,063 sq. mi) is coterminous with Istanbul Province, of which the city is the administrative capital. Istanbul straddles the Bosphorus strait in northwestern Turkey, between the Sea of Marmara and the Black Sea. In these study daily PM10 concentrations of Kagithane, Besiktas and Sariyer stations for the period between 2013 and 2014 were used. The stations locations are given in the Fig.1.
III.DATAANALYSIS
For the statistical analysis, daily PM10 concentration data in the period between 2013 and 2014, works with the RStudio standard version of R available from CRAN.
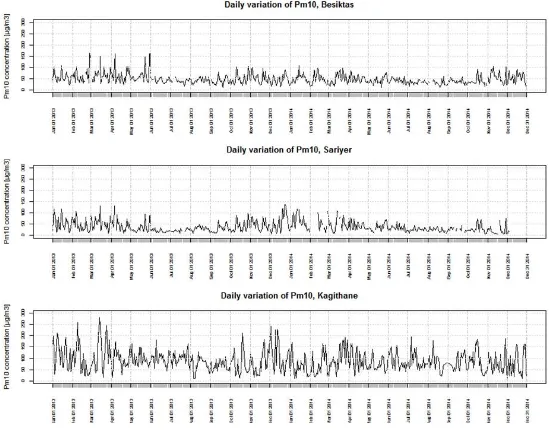
First of all, daily variations of PM10 concentrations of Besiktas, Sariyer and Kagithane stations were plotted in Fig.2. As seen in the Fig.2, Pm10 concentrations of Kagithane station is higher than Besiktas and Sariyer stations. All stations have more fluctuations in winter times. Maximum daily value of Besiktas station is 150 g/m3, maximum value of Sariyer stations is 125 g/m3 and Kagithane station’s maximum value is 260 g/m3.
Figure 2. Daily variations of PM10 concentrations of 3 stations in 2013-2014.
Figure 3. Daily variations of PM10 concentrations of Besiktas station in 2013-2014.
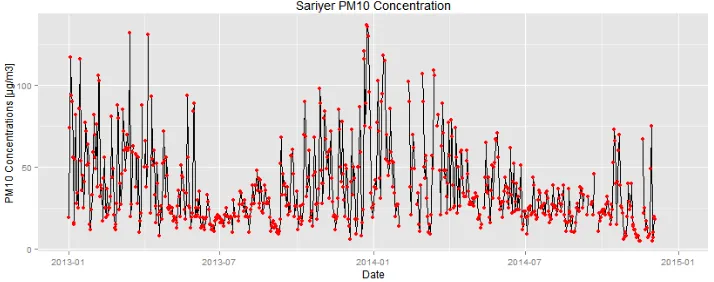
Figure 4. Daily variations of PM10 concentrations of Sariyer station in 2013-2014.
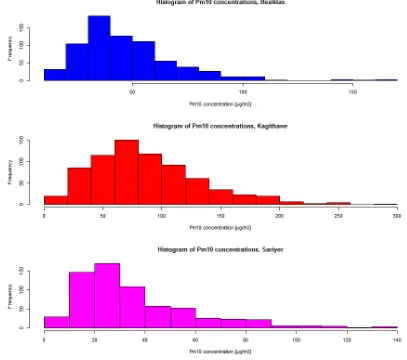
Histogram of three air quality stations were plotted in Fig.6 to see the statistical distribution for the period of between 2013 and 2014.
Figure 6. Histogram of Besiktas, Kagithane and Sariyer stations.
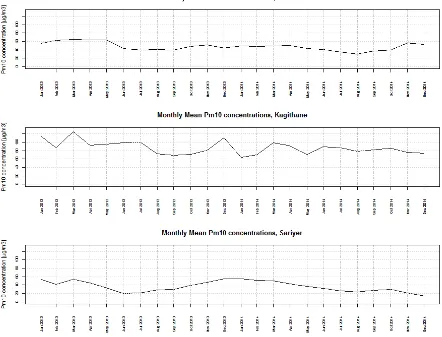
Monthly means of threestations were calculated and plotted in Fig.7,
Figure 7. Monthlyvariation of PM10 concentrationsfor Besiktas, Kagithane and Sariyer stations.
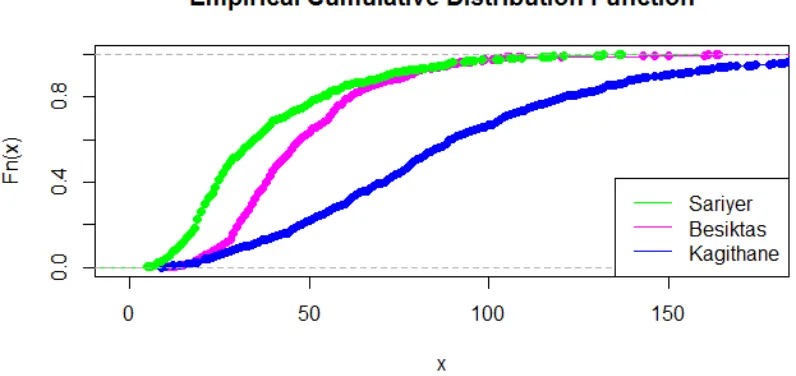
The difference empirical cumulative distribution function is applied and plotted in Fig.8.
Figure 8. Emprical cumulative distribution function of PM10 concentrations of Kagithane, Besiktas and Sariyer stations for given period.
Clearly it is seenthat, Sariyer and Besiktas stationsaredifferentfrom Kagithane station. And also, Sariyer and Besiktas stationsarecloseeachother on ECDF.Seasonalvariation of PM10 concentrationfor 2013 and 2014 yearsfor Kagithane, Besiktas and Sariyer stationswasplotted in Fig.8 Fig.9 and Fig.10 respectively. For Sariyer station, at 2014 winter and summerseasonsmean of PM10 concentrations is lowerthan 2013 winter and summerseasonsmean of PM10 concentrations. At 2014 springseasonmean of PM10 concentrations is higherthan 2013 springseasonmean of PM10 concentrations. At fallseasons of 2013-2014 years, means of PM10 concentrationshaveclosevalues. For Besiktas station, at allseasons of 2013-2014 years, means of PM1O concentrationshaveclosevalues. Only, at 2014 winterseasonmeanvaluesarelessthan 2013 yearmeanvalues. For Kagithane station, at allseasons of 2014 years, means of PM1O concentrationsarelessthanallseasons of 2013. But meanvalues of PM10 concentrations at summerseasons of 2013-2014 yearsareveryclosetoeachother.
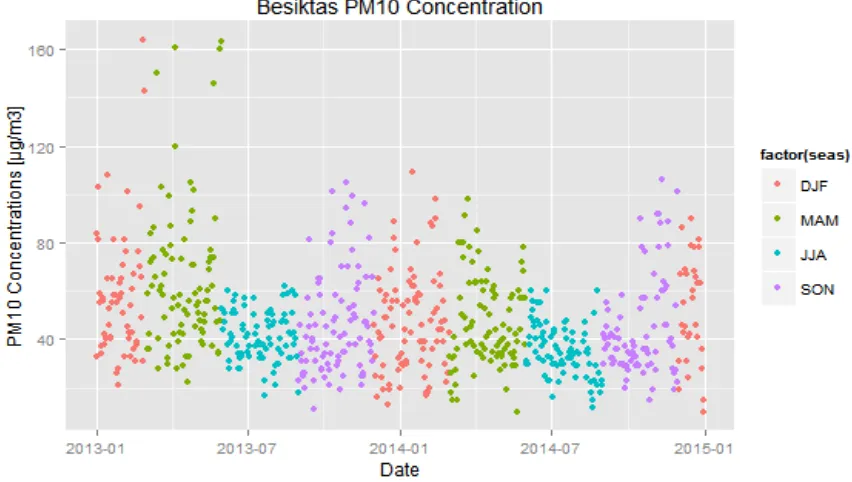
Figure 11. SeasonalVariability of PM10 concentrations of Besiktas stationforgivenperiod.
Tolook at seasonalvariabilityfrom a differentangle, the seasonalvariabilityfollowinggraphsareplotted.
Figure 12. SeasonalVariability of PM10 concentrations of Besiktas stationforgivenperiod.
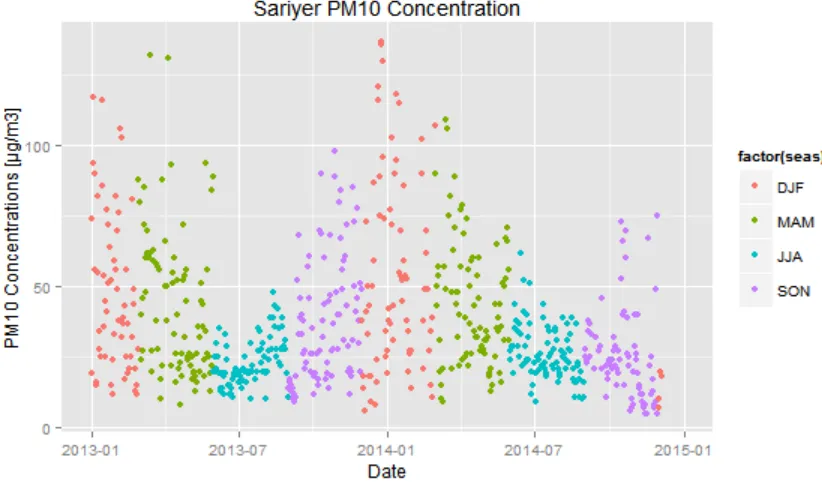
Figure 13.SeasonalVariability of PM10 concentrations of Sariyer stationforgivenperiod.
For Sariyer Station, at winterseason of 2014 year has highestvalue. Spring seasons of bothyearshavehighervaluesthanotherseasons.
For Kagithane station, spring season of 2013 year has the highest value, winter seasons of both years have close and higher PM10 concentrations.
In addition to exploratory data analysis, hypothesis testing was done. At first correlation coefficients are calculated as binary. The highest correlation coefficient is between Sariyer and Besiktas stations. Kagithane is different from other stations.
Figure 15. Correlation coefficients of stations.
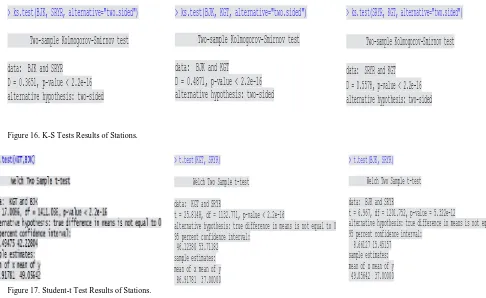
First test is Kolmogorov Smirnov test. Also for this test, our p-value is smaller than 0.05 so null hypotheses is rejected. The result of Kolmogorov Smirnov test is shown in Fig.16.
Figure 16. K-S Tests Results of Stations.
Figure 17. Student-t Test Results of Stations.
Finally, Student’s t test was applied between Kagithane-Besiktas-Sariyer. For H0 hypothesis, µ=0.05 is accepted.
When we applied t test to the data our p-value is found 2.2e-16 and this values is much smaller than accepted p value. So, H0 hypothesis is rejected and H1 hypothesis is accepted. According to t-test’s result, Kagithane, Besiktas and
Sariyer statitons’ Pm10 concentration µ=0.05 distribution is different. On the other hand, p value between Besiktas-Sariyer stations is higher than the other comparisons, already p value is smaller than µ=0.05.
> cor(BJK,KGT, use="complete.obs", method="kendall")
[1] 0.02230526
> cor(BJK,SRYR, use="complete.obs", method="kendall")
[1] 0.5466337
> cor(KGT,SRYR, use="complete.obs", method="kendall")
[1] 0.02763757
> ks.test(BJK, SRYR, alternative="two.sided")
Two-sample Kolmogorov-Smirnov test
data: BJK and SRYR
D = 0.3651, p-value < 2.2e-16
alternative hypothesis: two-sided
> ks.test(BJK, KGT, alternative="two.sided")
Two-sample Kolmogorov-Smirnov test
data: BJK and KGT
D = 0.4871, p-value < 2.2e-16
alternative hypothesis: two-sided
> ks.test(SRYR, KGT, alternative="two.sided")
Two-sample Kolmogorov-Smirnov test
data: SRYR and KGT
D = 0.5578, p-value < 2.2e-16
alternative hypothesis: two-sided
> t.test(KGT, SRYR)
Welch Two Sample t-test
data: KGT and SRYR
t = 25.8148, df = 1132.771, p-value < 2.2e-16
alternative hypothesis: true difference in means is not equal to 0 95 percent confidence interval:
46.12380 53.71182 sample estimates: mean of x mean of y 86.91781 37.00000
> t.test(BJK, SRYR)
Welch Two Sample t-test
data: BJK and SRYR
t = 6.967, df = 1201.752, p-value = 5.322e-12
alternative hypothesis: true difference in means is not equal to 0 95 percent confidence interval:
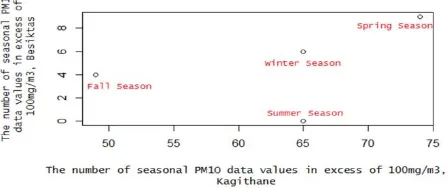
Following these analysis, a special study was done between Besiktas and Kagithane. Firstly, Pm10 levels exceed the value of 100mg/m3 are classified as seasonal for the two districts. Distribution graph of these data is shown in Figure 18. As seen from the graph, correlation between them is low. For all seasons, Kagithane has higher number of PM10 data than Besiktas. Kagithane has the highest Pm10 values which are exceed of 100mg/m3 in the Spring Season. Spring is the season that begins the work of the construction sector, generally. In recent years, Kagithane are preferred by the construction sector. Therefore, the high values which are in spring season can be regarded as normal. Second high values of Kagithane station are observed in winter season. In parallel with the construction industry, the numbers of residential also have a high value in the Kagithane region. Therefore, the sourced from heating pollutants have high value. Values are in the winter season can be regarded as normal, too.
Figure 18. Scatter Plot of the number of seasonal PM10 data values in excess of 100mg/m3.
As a consequence of analysis, daily and monthly variations of PM10 concentration of three air quality station was interpreted. Also histogram, seasonal boxplots were plotted, seasonal distribution of the two years has been shown. Monthly and daily variations of Kagithane, seem different from other two stations. Acoording to hypothesis testing, daily PM10 concentration levels differs from each other. But Kagithane station is exactly differs from Besiktas and Sariyer stations.
Primarily, coefficients are determined for the linear model analysis (Figure 19). Their regression value is regarded as 0.18. This values hows how much of the variability can be explained by regression line. The value which is obtained demonstrates that the relationship between them is weak. But, values of Kagithane and Besiktas stations have positive regression.
Figure 19. CoefficientsResults of Linear Model.
Figure 20.Result of a Linear Model.
Figure 21.Graphs of the result of Linear Model.
Finally, Durbin-Watson test is done for the numbers of seasonal Pm10 values that exceeding of 100 g/m3 of Besiktas and Kagithane stations. Accordingtodwtest, DW is 1.7352, therefore value is 0 and then Hohypothesises is accepted. Tosumup, there is no auto correlation between Kagithane and Besiktas stations.
IV. CONCLUSION
As a consequence of analysis, daily and monthly variations of PM10 concentration of three air quality station was interpreted. Also histogram, seasonal boxplots were plotted, seasonal distribution of the two years has been shown. Monthly and daily variations of Kagithane seem different from other two stations. According to hypothesis testing, daily PM10 concentration levels differs from each other. But Kagithane station is exactly differs from Besiktas and Sariyer stations.
Linear model analyses are applied with the numbers of seasonal Pm10 values that exceeding of 100 mg/m3 of Besiktas and Kagithane stations, result of in this model, a weak positive correlation was observed between these stations. Finally, Durbin-Watson test are performed, it was seen that there is no autocorrelation between Besiktas and Kagithane stations.
REFERENCES
[1] Builtjes, P. The Problem – Air Pollution. Chapter 1 of AIR QUALITY MODELING Theories, Methodologies, Computational Techniques, and Available Databases and Software. VolI – Fundamentals (P. Zannetti, Editor). EnviroComp Institute and Air & Waste Management Association, 2003.
[2] Daly, A. and P. Zannetti.. An Introduction to Air Pollution –Definitions, Classifications, and History. Chapter 1 of AMBIENT AIR POLLUTION, The Arab School for Science and Technology (ASST) and The EnviroComp Institute, 2007.
[3] EPA. (2010). Fact Sheet, Smoke, Particulate Pollution & Your Health.