ABSTRACT
KRISHNAMURTHY, RAMESH . A Framework for Evaluating Server Performance:Application to SIP Proxy Servers. (Under the direction of Dr. George N. Rouskas.)
The growing number of applications that use the Session Initiation Protocol (SIP) to manage media sessions over IP is placing increasing demands on the SIP proxy servers (SPS) that make up the core of the SIP network. In this work we investigated the performance of OpenSIPS, an open source SIP proxy server. We collected a large set of experimental data to characterize the performance of the SPS under various call arrival rates and inter-arrival time distributions. Based on these measurements, in the first part, we studied a single SPS server thread on a single-core CPU hardware and modeled the SIP proxy server as an M/G/1 queue. A key component of the model is a parameter that captures the interrupt overhead, i.e., the impact of interrupts and the resulting cache-misses on socket queue service times.
For the second part, we studied the performance of multiple SPS server threads on a single-core CPU hardware. We measured the call rate where the SPS server starts experiencing losses greater than 1% and developed a prediction model for the drop probability as a function of call rate and number of server threads. We also introduced a new parameter to capture the overhead of multiple server threads, in addition to the interrupt overhead.
For the third part, we investigated the impact of the Linux scheduler settings on the perfor-mance of single-core, multi-threaded SIP proxy servers, in terms of packet service time, waiting time, and packet drop rate (PDR) to capture the impact on end-user experience. Based on the results of a large set of experiments across a wide range of traffic loads and number of server threads, we developed a methodology to configure the scheduler parameters such that it resulted in significant gains in SPS performance compared to industry-recommended “server” mode operation. Importantly, the gains in performance were the result of setting the scheduler parameters to appropriate values, without the need for adding server capacity or other capital expenditures.
c Copyright 2016 by Ramesh Krishnamurthy
A Framework for Evaluating Server Performance: Application to SIP Proxy Servers
by
Ramesh Krishnamurthy
A dissertation submitted to the Graduate Faculty of North Carolina State University
in partial fulfillment of the requirements for the Degree of
Doctor of Philosophy
Computer Science
Raleigh, North Carolina
2016
APPROVED BY:
Dr. Rudra Dutta Dr. Khaled Harfoush
Dr. David Thuente Dr. George N. Rouskas
DEDICATION
To my parents, for their support and instilling in me the value of education and hard work. To my wonderful wife, Sujatha for her patience, love and encouragement.
BIOGRAPHY
Ramesh Krishnamurthy grew up in the central Indian city of Nagpur. He received his Bachelor’s degree in Computer Science from Visvesvaraya National Institute of Technology (formerly called Visvesvaraya Regional College of Engineering), Nagpur, India. He was awarded the graduate merit fellowship from University of Maryland Baltimore County, Baltimore, where he pursued his Master’s in Computer Science.
Ramesh joined Cisco at Research Triangle Park, North Carolina as a Software Engineer and has since worked on several software development projects at Cisco. Ramesh’s primary role is centered around design, development and architecture of software. Ramesh has also been awarded two patents from the U.S. Patent office for developing novel methods in the area of network protocols.
Ramesh pursued his Ph.D in Computer Science at North Carolina State University, Raleigh, while working full time at Cisco. He was selected for the Preparing for Professoriate (PTP) fellowship at NC State. As part of PTP he underwent extensive training to improve his skills and e↵ectiveness as a teacher. He worked with Dr. Rouskas in updating the course content, projects and lecturing for Data Structures and Algorithms course (CSC 316).
ACKNOWLEDGEMENTS
I consider myself very fortunate to have Dr. George Rouskas as my advisor. Throughout my research Dr. Rouskas was very supportive, encouraging, treated me with respect and made himself available whenever I needed him. I especially admire his ability to identify key technical points and help prioritize items so as to maintain focus on tasks that mattered most. Open and candid communication with Dr.Rouskas created an environment of trust and empowerment and brought out the best in me. For this I am very grateful to him. This dissertation would not have been possible without his constant support.
I would like to thank committee members Dr. Rudra Dutta, Dr. Khaled Harfoush and Dr. David Thuente for their time in the research advisory committee. Trying to find answers to their challenging question made me more diligent and prepared. Their insightful comments have significantly raised the quality of my research.
This work is dedicated to my parents for their support and instilling in me the value of hard work and education. I am grateful to my wonderful wife Sujatha for her patience, love and encouragement and to my sons, Prem and Raj for the joy and happiness they bring to our lives. I want to thank my in-laws, especially my father-in-law for helping with the editing of the thesis. I want to thank my sisters, brother-in-law and their families and my nieces and nephews for their support and encouragement.
TABLE OF CONTENTS
List of Tables . . . .viii
List of Figures . . . x
Chapter 1 Introduction . . . 1
1.1 Thesis Organization . . . 3
Chapter 2 SIP Architecture . . . 5
2.1 Main Components . . . 6
2.2 Call Setup and Teardown . . . 7
2.3 SIP Protocol Family . . . 9
2.4 Related Work . . . 9
Chapter 3 Linux Kernel Modifications and Measurement Methodology . . . . 13
3.1 Kernel Overview . . . 13
3.1.1 Kernel Design . . . 15
3.2 Packet Processing within the Linux Kernel . . . 15
3.2.1 Linux Kernel Network Stack – Packet Receiving . . . 17
3.2.2 Application Layer Packet Processing . . . 17
3.2.3 Linux Kernel Network Stack – Packet Sending . . . 17
3.3 Packet Service and Waiting Time Components . . . 18
3.4 Impact of Interrupts and Cache Misses . . . 19
3.5 Measurement Methodology . . . 20
3.5.1 Measuring the Time Components: Kernel and OpenSIPS Modifications . 21 Chapter 4 Evaluation of SIP Proxy Server Performance: Packet-Level Mea-surements and Queuing Model . . . 25
4.1 Experimental Setup . . . 26
4.1.1 OpenSIPS as SPS . . . 27
4.1.2 SIPpas UAC . . . 27
4.1.3 SIPpas UAS . . . 29
4.2 Experiments and Performance Measurements . . . 29
4.2.1 Experimental Results: Measurement Data forKrcv,Kstack, and Ksockq . . 30
4.2.2 Experimental Results: Measurement Data forTsip . . . 34
4.2.3 Experimental Results: Measurement Data forKsnd . . . 36
4.2.4 Experimental Results: Overall mean forKsockq and Tsip . . . 36
4.3 M/G/1 Queuing Model for the SPS . . . 36
4.3.1 Estimating theKs sockq Component of the Service Time X . . . 40
Chapter 5 Performance Evaluation of Single-Core, Multi-Threaded SIP Servers 45
5.1 Related Work . . . 46
5.2 Experiments and Performance Measurements . . . 46
5.2.1 Experimental Results: Measurement Data forKrcv,Kstack, and Ksockq . . 47
5.2.2 Experimental Results: Measurement Data forTsip . . . 49
5.2.3 Experimental Results: Measurement Data forKsnd . . . 49
5.3 Drop-Probability Model for the SPS . . . 50
5.3.1 Modeling the Interrupt Overhead: . . . 52
5.3.2 Modeling the Server-Thread Overhead: . . . 52
5.3.3 Modeling Results . . . 54
5.4 Conclusions . . . 58
Chapter 6 Performance of Multi-threaded SIP Servers: The Impact of Sched-uler Parameters . . . 59
6.1 Related Work . . . 60
6.2 Experiments and Performance Measurements . . . 60
6.3 Impact of Process Scheduler on SPS Performance . . . 61
6.3.1 Baseline Server Mode . . . 62
6.3.2 Enhanced Server Mode . . . 63
6.4 Experimental Results . . . 64
6.4.1 Average Service and Waiting Times . . . 64
6.4.2 Packet Drop Rate . . . 65
6.5 Concluding Remarks . . . 73
Chapter 7 Performance Evaluation of Multi-Core, Multi-Threaded SIP Servers 74 7.1 Related Work . . . 75
7.2 Testbed and Experimental Setup . . . 76
7.3 Measurement Methodology and Experiments . . . 76
7.4 Impact of Process Scheduler on Multi-core SPS Performance . . . 77
7.4.1 Baseline Multi-Core Server Mode . . . 78
7.4.2 Enhanced Multi-Core Server Mode . . . 78
7.5 Experimental Results . . . 79
7.5.1 Impact of sched migration cost . . . 79
7.5.2 SPS Performance . . . 80
7.6 Capacity Planning Model . . . 83
7.7 Concluding Remarks . . . 85
Chapter 8 Summary and Future Work . . . 87
8.1 Future Work . . . 89
References. . . 91
Appendix A Kernel, OpenSIPS and SIPp Modification . . . 96
A.1 Kernel Modification . . . 96
A.1.1 Di↵s . . . 97
A.2 OpenSIPS Modification . . . 100
A.3 SIPp Modification . . . 108
LIST OF TABLES
Table 4.1 Measured Mean Values and Confidence Intervals for Krcv, and Poisson
Inter-Arrivals (µS) . . . 30
Table 4.2 Measured Mean Values and Confidence Intervals for Krcv, Deterministic Inter-Arrivals (µs) . . . 31
Table 4.3 Measured Mean Values (in µs) at 1 cps . . . 41
Table 4.4 Waiting Times (in µs): Measured vs. Analytical, Poisson Inter-Arrivals . 42 Table 4.5 Waiting Times (in µs): Measured vs. Analytical, Deterministic Inter-Arrivals . . . 42
Table 5.1 Waiting Time(µs): Measured vs Analytical, Exponential Inter-Arrival Times SPS on 1 core 1-Server, K=200 . . . 54
Table 5.2 Drop probability Analytical vs. Drop Rate Measured, SPS with2-Server, K=200 . . . 56
Table 5.3 Drop probability Analytical vs. Drop Rate Measured, SPS with 4-Server, K=200 . . . 56
Table 5.4 Drop probability Analytical vs. Drop Rate Measured, SPS with 6-Server, K=200 . . . 56
Table 5.5 Drop probability Analytical vs. Drop Rate Measured, SPS with 8-Server, K=200 . . . 57
Table 5.6 Drop probability Analytical vs. Drop Rate Measured, SPS with 16-Server, K=200 . . . 57
Table 6.1 Measured SPS Performance, 1% PDR, Baseline Server Mode . . . 69
Table 6.2 Measured SPS Performance, 1% PDR, Enhanced Server Mode . . . 69
Table 6.3 PDR at 1% And Kernel Time (Krcv) Comparison . . . 70
Table 6.4 Measured SPS Performance, 2% PDR, Baseline Server Mode . . . 71
Table 6.5 Measured SPS Performance, 2% PDR, Enhanced Server Mode . . . 71
Table 6.6 PDR at 2% And Kernel Time (Krcv) Comparison . . . 71
Table 6.7 Measured SPS Performance, 5% PDR, Baseline Server Mode . . . 72
Table 6.8 Measured SPS Performance, 5% Drop-Rate, Enhanced Server Mode . . . 72
Table 6.9 PDR at 5% And Kernel Time (Krcv) Comparison . . . 72
Table 7.1 Measured SPS Performance, Baseline Multi-core Server Mode, SPS on 2-Core . . . 82
Table 7.2 Measured SPS Performance, Enhanced Multi-core Server Mode, SPS on 2-Core . . . 82
Table 7.3 Drop rate And Kernel Time (Krcv) Comparison, SPS on 2-Core . . . 83
Table 7.4 Measured SPS Performance, Baseline Multi-core Server Mode, SPS on 4-Core . . . 83
Table 7.5 Measured SPS Performance, Enhanced Multi-core Server Mode, SPS on 4-Core . . . 84
Table 7.7 Measured SPS Performance, Baseline Multi-core Server Mode, SPS on 6-Core . . . 85 Table 7.8 Measured SPS Performance, Enhanced Multi-core Server Mode, SPS on
LIST OF FIGURES
Figure 2.1 SIP call setup within the same domain . . . 8
Figure 2.2 SIP message exchange for call setup and teardown . . . 10
Figure 3.1 Kernel: An abstraction layer for available resources in a system . . . 14
Figure 3.2 Linux network stack:UDP packet receiving/sending operations . . . 16
Figure 3.3 Time-stamps recorded at the instances shown in the Kernel and SIP layer 22 Figure 4.1 Testbed for performance measurements of OpenSIPS SPS . . . 26
Figure 4.2 Mean value of Ksockq in the stable region, Poisson Arrivals . . . 32
Figure 4.3 Mean value of Ksockq in the stable region, Deterministic Arrivals . . . 32
Figure 4.4 Mean value of Kstack, Poisson Arrivals . . . 33
Figure 4.5 Mean value of Kstack, Deterministic Arrivals . . . 33
Figure 4.6 Mean value forTsip, Poisson Arrivals . . . 35
Figure 4.7 Mean value forTsip, Deterministic Arrivals . . . 35
Figure 4.8 Mean value of Ksnd, Poisson Arrivals . . . 37
Figure 4.9 Mean value of Ksnd, Deterministic Arrivals . . . 37
Figure 4.10 Overall Mean value ofKsockq and Confidence Interval . . . 38
Figure 4.11 Overall Mean value ofTsipand Confidence Interval . . . 38
Figure 4.12 M/G/1 queuing model of the SPS . . . 39
Figure 4.13 Server utilization: CPU% vs.⇢ (as %), exponential inter-arrival times . . 43
Figure 5.1 Krcv value for SPS as a function of the number of server threads . . . 48
Figure 5.2 Tsip value for SPS as a function of the number of server thread . . . 48
Figure 5.3 M/G/c/K queuing model of the SPS . . . 55
Figure 5.4 Drop probability(Model) vs. Drop-Rate(Measured), Point where Drop rate starts exceeding 1%; 2D-map view as Function of Number of Server threads and Call-Arrival rate . . . 55
Figure 6.1 MeanKrcv values vs. load, baseline “server” mode . . . 66
Figure 6.2 MeanTsip values vs. load, baseline “server” mode . . . 66
Figure 6.3 MeanKrcv values vs. load, enhanced “server” mode . . . 67
Figure 6.4 MeanTsip values, enhanced “server” mode . . . 67
Figure 6.5 MeanKrcv values, Comparison, Base vs enhanced Mode . . . 68
Figure 6.6 MeanTsip values, Comparison, Base vs enhanced Mode . . . 68
Figure 7.1 Dual quad-core processor hosting the OpenSIPS server for the experiments 76 Figure 7.2 Impact ofsched migration cost on Krcv (waiting time) . . . 81
Chapter 1
Introduction
The Session Initiation Protocol (SIP) [1] is widely used as a signaling protocol for managing media sessions over IP. The ubiquitous presence of IP over the past decade has spawned a new set of non-traditional service providers, including Vonage, Skype, and Lingo, that o↵er voice over IP (VoIP) services with advanced features (e.g, PC-to-phone calling, enhanced voice-mail, multi-ring capability, etc.) at lower cost to users. Established providers, including both telcos and cable companies, are increasingly providing VoIP service so as to remain competitive and to take advantage of the resulting increased efficiencies. Furthermore, with the advent of smart phones, there has been a proliferation of applications that enable users to make voice and video calls using any available WiFi hot-spot, thus avoiding the more expensive 3G/4G data networks. Most of these providers and their applications use SIP as the underlying signaling protocol for setting up and managing the voice and video calls.
The growing number of customers and devices that make use of SIP is placing an increased demand on the SIP proxy servers (SPS) that make up the core of the SIP network. For service providers to deal e↵ectively with the demand growth, they must develop a good understanding of current usage patterns, forecast and plan upgrade needs, and be able to configure a robust service capability for new users. In [2] the requirements for management of overload in SIP is discussed and poor capacity planning was cited as one of the leading causes of overload in SIP. Ultimately, all these considerations require accurate estimates of the performance capability of the SPS.
Hence, we have the following main objectives for our research:
1. Develop tools and techniques that can be easily adapted to carry out similar experimental studies for other SPS configurations as well as di↵erent protocol suites.
SIP protocol)
3. Develop a guideline for extracting performance gains from existing computing infrastruc-tures without additional capital expendiinfrastruc-tures.
4. Develop a parametrized model that can be used to estimate the performance and the capacity of the SPS over a range of o↵ered loads, and a range of SPS hardware and software configurations.
In this work we investigate the performance of OpenSIPS [3], an open source SIP proxy server, and make several contributions.
1. We have modified the Linux kernel and the OpenSIPS source code to obtain packet-level measurements for each SIP message, from which the service and waiting times within the kernel and the SIP layer can be easily obtained. In particular, the kernel modifications can be used for collecting such measurements for any protocol, while the OpenSIPS modifications may be easily adapted to other application servers.
2. We also enhanced SIPp [4], a SIP traffic generator tool, to generate calls with inter-arrival times that follow any user-specified distribution. The modified versions of the kernel, OpenSIPS, and SIPp are made available in the Appendix and also as media files as part of this thesis.
3. We have collected a large set of experimental data to characterize the performance of the SPS under various call arrival rates and inter-arrival time distributions.
4. Based on these measurements, in the first part, we study a single SPS server thread on a single-core CPU hardware and model the SIP proxy server as an M/G/1 queue. A key component of the model is a parameter that captures the Interrupt overhead, i.e., the impact of Interurpts and the resulting cache misses on socket queue service times. Our measurement and modeling methodology is general, and can be applied to characterize the performance of a wide range of network application protocols.
5. For the second part, we study the performance of multiple SPS server threads on a single-core CPU hardware. We measure the call rate where the SPS server starts experiencing losses greater than 1% and develop a prediction model for the drop probability as a function of call rate and number of server threads. We also introduce a new parameter to capture the overhead of multiple server threads, in addition to the interrupt overhead.
waiting time, and packet drop rate (PDR) to capture the impact on user performance. We identify the key scheduler parameters of the Linux scheduler and provide concrete guide-lines for tuning these parameters that we identify as ’enhanced server mode’ to achieve significant performance improvement.
7. For the final phase of our research, we investigated the impact of the Linux scheduler’s load-balancing algorithm on the performance of multi-threaded SIP proxy server run-ning on a multi-core processor system. We conducted extensive experiments and develop practical guidelines for tuning the scheduler to a ’enhanced multi-core server mode’ that results in significant gains in performance, thus addressing one of the most crucial needs in today’s data center: to extract performance gains from the existing computing infrastruc-tures without additional capital expenses. We further develop a capacity planning model that provides a good first-order approximation of the total capacity of the SPS system in terms of the call arrival rate that may be supported without a↵ecting user experience in terms of dropped call.
1.1
Thesis Organization
The remainder of this thesis is organized as follows.
In Chapter 2, we present an introduction to the SIP architecture and its main components: the SIP user agent (UA), the SIP proxy server (SPS), the SIP Registrar server and the SIP Re-direct server. We provide an example of the SIP call setup and tear-down processes, and explain the message flow for a typical call. We also discuss related research.
In Chapter 3, we provide the details of the kernel modifications that we made as part of the research, starting with an overview of the kernel and the packet processing within Linux kernel. We then provide a description of service time and waiting time components and then describe measurement methodology for obtaining these components.We end this chapter with a discussion of work that studied the impact of increased packet arrivals.
In Chapter 4, we present the experimental testbed that we used for obtaining the mea-surements. We present the details of the SPS server and the SIPp tool that is used in the experiments. We then present a large set of data collected and from which we develop a queu-ing model for the SPS proxy server.
In Chapter 6, we investigate the impact of the Linux Completely Fair Scheduler (CFS) on the performance of SPS, as a function of the number of threads and the call arrival rate. We characterize the impact of the scheduler on the performance of a multi-threaded SPS, in terms of waiting time and packet drop rate. Further, we identified key scheduler parameters of CFS scheduler and developed concrete guidelines on tuning these parameters to achieve significant performance improvement.
We present the impact of the Linux scheduler’s load-balancing algorithm on the performance of multi-threaded SIP proxy server running on a multi-core processor system in Chapter 7. We conducted extensive experiments, developed practical guidelines for tuning the scheduler to an ’enhanced multi-core server mode’ and were able to obtain significant performance gains in the SPS. We further develop a capacity planning model that provides a good first-order approximation of the total capacity of the SPS system in terms of the call arrival rate that may be supported without a↵ecting user experience in terms of dropped call.
Chapter 2
SIP Architecture
SIP is an application layer signaling protocol that can establish, modify, and terminate mul-timedia sessions such as Internet telephony calls [1, 5]. SIP is independent of the transport layer and can work over any transport protocol including UDP, TCP, stream control transmis-sion protocol (SCTP), and transmistransmis-sion layer security (TLS). SIP is based on an HTTP-like
request/response transaction model. Each transaction consists of a request that invokes a par-ticular method, or function, on the server and at least one response for the request. The most common SIP requests are as follows:
• INVITE: Used by a client to initiate or update a media session.
• ACK: Indicates the client has received a final response for an INVITE and is ready for media exchange.
• BYE: This message is used to terminate a session.
• CANCEL:Cancels any pending requests. For instance, if an INVITEhas been sent but the user has not received a final response,CANCELis sent to terminate the pending INVITE. • REGISTER: This message is used by the client to indicate its contact address, so that it
can receive calls.
The response to a SIP request can be of one of the following types:
• 1xx: Provisional – request received, continuing to process the request; e.g., 100 Trying, 180 Ringing.
• 3xx: Redirection – further action needs to be taken in order to complete the request; e.g., 301 Moved Permanently,302 Moved Temporarily.
• 4xx: Client Error – the request contains bad syntax or cannot be fulfilled at this server; e.g.,403 Forbidden,404 Not Found.
• 5xx: Server Error – the server failed to fulfill an apparently valid request; e.g., 500 Internal Server Error,503 Service Unavailable.
• 6xx: Global Failure – the request cannot be fulfilled at any server; e.g., 600 Busy Everywhere,604 Does Not Exist Anywhere.
2.1
Main Components
The SIP infrastructure consists of four key components: the SIP user agent (UA), the SIP proxy server (SPS), the SIP Registrar server, and the SIP Re-direct server. We now briefly describe the main functions of these components.
• SIP User Agent (UA). A SIP UA is an end-point device such as a VoIP phone, a cell phone, a PC, etc. The UA initiating a SIP request becomes the user agent client (UAC) for this particular session, while the end-point device which responds to the request is referred to as the user agent server (UAS) of the SIP session. A UAC is capable of generating a request based on some external stimulus (e.g., a user clicking a button) and processing a response. A UAS is capable of receiving a request and generating a response based on user input (or some other external stimulus).
• SIP Proxy Server (SPS). The main function of an SPS is to route SIP messages between the UAC and UAS. A SIP request from the UAC may traverse through several proxies on its way to a UAS, with each proxy making routing decisions and possibly modifying the request before forwarding it to the next. A response is forwarded through the same set of proxies traversed by the corresponding request, but in the reverse order. When a SIP request arrives, the SPS may respond on its own as well.
TCP as the transport protocol, an SPS has to operate in stateful mode, as the UA relies on the proxy to perform retransmissions for any UDP hops in the signaling path.
• SIP Registrar Server. Before a SIP UA can receive a call, it needs to make its reach-ability information available so that an SPS can forward SIP requests to the UA. A SIP UA makes itself discoverable by registering with (i.e., submitting a REGISTER message to) a special UAS known as the SIP Registrar server. The Registrar acts as the front end to the location service for a given domain. The SPS queries the Registrar to deter-mine how to forward a request for that domain. Note that the Registrar and SPS are
logical roles; typically, both functionalies are implemented in the same physical device. The REGISTERmessage contains the address-of-record (AOR) whose registration is to be created or modified, and the corresponding contact binding to a device.
• SIP Re-direct Server. This is a special class of UAS that generates a response of type
3xx (e.g., 302 Moved Temporarily) to a request it receives. The server populates the
3xx response with a list of alternative locations and provides the time during which the new contact data is valid. The Re-direct server allows the SPS to direct SIP requests to external domains.
As we can see, the SPS is the key component of the SIP infrastructure: it handles all SIP messages generated by the UAC and UAS during setup, modification or termination of media session; hence, in case of overload, the SPS may become a performance bottleneck that limits the ability of users to establish SIP sessions. Consequently, we only focus on the SPS in this thesis.
2.2
Call Setup and Teardown
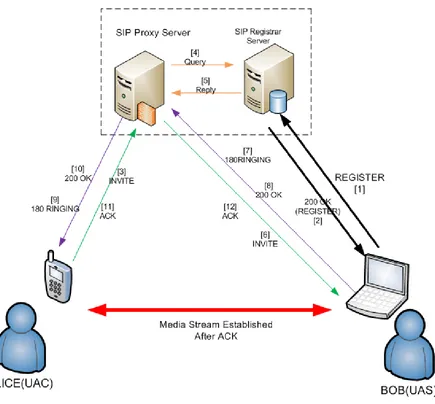
Recall that SIP is mainly used to signal the establishment and termination of multimedia sessions between user agents. Once a call has been established, no SIP messages are exchanged until either party decides to modify or terminate the session. Therefore, understanding the flow of messages during call setup and teardown is crucial in evaluating the performance of the SPS. Figure 2.1 illustrates the basic call setup process and the resulting media session between two users within the same domain. In the figure, Alice and Bob are two users in the domain XYZ.com with phone numbers 1111 and 2222, respectively.
Figure 2.1: SIP call setup within the same domain
• theTo: field contains the valuesip:[email protected], which corresponds to Bob’s address-of-record (AOR), and
• theContact: field is set to the valuesip:bob@<IP Address of Bob’s laptop>, binding the AOR to the current IP address of the device where Bob may be reached.
Upon successful registration, the Registrar responds with a200 OKmessage.
SPS queries the Registrar to obtain the corresponding contact address, and the latter replies with the contact address that Bob provided in its earlier REGISTER message. The SPS then forwards the INVITE message to this contact address. Once Bob (the UAS) answers the call, the SPS forwards the 200 OK response message from Bob back to Alice. Alice (the UAC) acknowledges Bob’s acceptance of the call with an ACK message. Once Bob receives this last message, the media session between the two parties is established.
To terminate the session, either the UAC or the UAS sends a BYE request, and the other party responds with a 200 OKmessage.
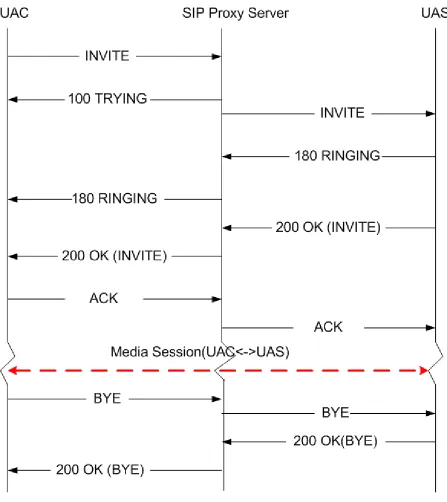
Figure 2.2 shows the exchange of SIP messages between the UAC and UAS through an SPS, for both the call setup and teardown operations. This is the message flow that we use in our experimental data collection and in modeling the SPS performance.
2.3
SIP Protocol Family
SIP is one part of the IETF protocol suite that makes up the complete multimedia architecture. For the sake of completeness, we briefly discuss two other protocols that are commonly used with SIP, namely, the Real-time Transport Protocol (RTP, defined in RFC 1889) and the Session Description Protocol (SDP, defined in RFC 2327).
SDP is used with SIP for describing the multimedia session. When setting up a voice or video session, SDP information is included in the INVITE request by the UAC and the 200 OK response from the UAS. The SDP media session information typically includes: an IP address and port number, the media type (e.g., audio, video, interactive whiteboard, etc.), and the media encoding scheme (e.g., G711 audio, H264 video, etc.). Once the SIP session is established, the UAC and UAS use the SDP information to encode the media, and use RTP for transporting real-time voice and/or video data.
SIP must be used in conjunction with SDP and RTP in order to provide complete services to the users. However, the basic functionality and operation of SIP, as well as the performance of the SPS, does not depend on any of these protocols.
2.4
Related Work
Figure 2.2: SIP message exchange for call setup and teardown
determined by the processing capacity and load of the SPS. There have been several attempts in the literature to characterize the queuing behavior of the SPS.
the UAC perspective, was developed in [7]. In this study, the mean response time consists of the processing and queuing delays at the SPS and UAS. Specifically, the mean response time is defined as the di↵erence between the instant anINVITErequest from the UAC arrives at the SPS until the instant the corresponding final response is forwarded by the SPS to the same UAC , excluding the call duration and the propagation delays between the SPS and the UAC and UAS. The SPS and UAS are modeled as a queuing network with six M/M/1 queues, each queue corresponding to the processing of one message type at either the SPS or UAS, including failure messages not shown in Figure 2.2.
Based on the observation that the processing of messages of a specific type does not follow an exponential distribution but, rather, it is close to a constant, the queuing network of [7] was analyzed in [8] under the assumption that each of the six queues are of theM/D/1 type.
While these studies provide some insight into the mean response time, the six-node queuing network is not an accurate model of the way the SPS and UAS operate in practice. In [9], the SPS is modeled as a single M/M/c queue, and the analytical results are compared to experimental data collected from an SPS with three threads. This study was further extended in [10]. Specifically, the experiments were modified to incorporate a call holding time for each call, and the CPU and memory utilization and queue size were measured to investigate the scalability of the SPS model.
An experimental evaluation of the OpenSER [11] proxy server under various configurations was carried out in [12] using the SIPp tool [4] (we also utilize the SIPp tool and discuss it in the next chapter). It was observed that, depending on the configuration (authentication enabled/disabled, UDP or TCP, stateful or stateless), the measured throughput may vary from hundreds to thousands of operations per second, and that more complex configurations result in a lower throughput, as expected.
The impact of UDP versus TCP transport on the performance of OpenSER was investigated in [13]. The main conclusion of this study was that the lower performance observed when using TCP is mainly due to the design of the OpenSER server (which is better suited to handle a connectionless protocol), while the overhead of TCP compared to UDP is not a significant factor a↵ecting the performance.
The objective of the work in [14] was to improve the performance of a cluster of SIP proxy servers. A number of load balancing algorithms were developed that exploit the properties of SIP, namely, the session-oriented nature of the protocol which mandates that all SIP messages of a given session be handled by the same SPS. The proposed algorithms have the load-balancing server employ session-aware policies to assign requests so as to improve throughput and response times.
stateless manner by the SPS was proposed in [15]. It was shown via IP multimedia system (IMS) simulation that this hybrid approach that combines the performance advantage of state-less functionality with the higher reliability of a stateful server may lead to better scalability properties for the SPS.
In [16] the authors studed multi-core scalability of the OpenSER SIP server, not only on a Linux on Intel platform, but also using Solaris system (developed by Sun Microsystems). They additionally consider TCP as a transport protocol. They encountered scalability bottlenecks in both the Linux and Solaris operating systems, such as those caused by a single lock protecting access to a socket, and proposed using multiple sockets (and port numbers) in response to avoid the problem. They also noticed a problem involving contention in the shared memory segment used by OpenSER. Their response is to hash a shared state by call ID and use multiple shared memory segments to partition the global state and have a lock per segment, reducing the contention. They improved scalability by up to a factor of four, depending on the scenario. In [17] the authors evaluated the performance and scalability of an open-source SIP proxy on three di↵erent multi-core platforms: AMD Santa Rosa, Intel Harpertown, and IBM POWER6. Two performance and scalability bottlenecks were identified using whole-system profiling: One was the OpenSER use of hash table for user location lookup. By increasing the width of hash table the performance was improved by a factor of four. The workload used in the study was user based and required Database lookup, storing the data in memory improved performance. The scalability was reduced when using eight cores.
Chapter 3
Linux Kernel Modifications and
Measurement Methodology
The kernel forms the core part of an operating system and provides an abstraction layer between the applications and the hardware present in the system. In this chapter, we first provide an overview of the kernel function, then we present the steps a packet takes as it moves from the device layer through the Linux kernel to the application layer and back to the device layer; Note that these steps are common for any application layer service. We describe the kernel modifications we have implemented and the measurement methodology that we used for collecting the data. We also discuss the impact of interrupts and cache misses on system performance as a function of load, and survey related research.
In our research, we carry out a large set of experiments with the objective of obtaining a precise measurement of the time a packet spends within the SIP Proxy Server (SPS) System. The total time is defined as the length of time from the arrival instant (i.e., the time it is received by the device layer) to the departure instant (i.e., the time it is transmitted by the device layer after it has undergone processing at the application layer (SIP in this instance)). Therefore, to measure the total time the packet spent in the system, it is necessary to first understand the processing that a packet undergoes in the kernel.
3.1
Kernel Overview
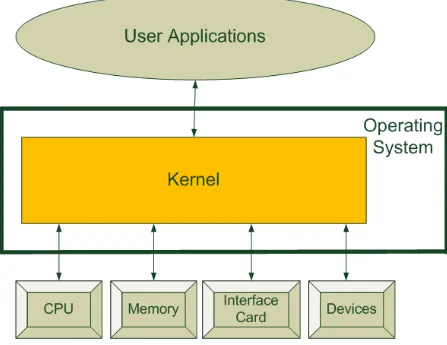
The kernel provides an abstraction layer for the hardware present in the system. The main function of the kernel is to perform resource management of the available resources (including CPU, memory and devices). Kernel allows other user processes to utilise these resources. Some of the functions that a kernel can perform are:
Figure 3.1: Kernel: An abstraction layer for available resources in a system
To run any process, the kernel has to setup address space for the process and load the code for the process into memory and allocate the process, CPU time, so that the process can execute. All modern systems use multi-tasking, i.e, the kernel gives each process a slice of CPU time before switching to another process so as to give an illusion of running multiple processes simultaneously.
2. Memory Management.
The kernel is responsible for managing all the memory in the system that is currently in use by various processes. The kernel needs to ensure that each process uses only its own memory space and does not interfere with memory dedicated to other processes.
When a hardware devices triggers an interrupt, it is handled by the kernel. The kernel will typically handles interrupts by suspending the currently executing process, saving its context, and then running the code to service the interrupt. Once the interrupt is serviced, the kernel will restore the interrupted process’s context and allow it to continue execution. System calls made by a process also result in interrupts and the control coming back to kernel. The kernel will handle the request and return the results and control back to the process.
3.1.1 Kernel Design
There are two main kernel design approaches: monolithic kernel and the other is the micro Kernel. Each type is briefly described here.
In monolithic kernel all the OS services reside in the same memory space and use the same shared memory. All the services run along with the main kernel thread. This allows all the services easier access to data from other services with less overhead. The implementation is also simpler. However, monolithic kernel has some drawbacks. First, a lack of protection between services can result in the crash of the entire system, when a bug is encountered in one service. Second, as the size of kernel becomes larger, the lack of modularization makes maintenance of the kernel difficult. Examples of monolithic kernel implementations include Linux, BSD (and its flavors), AIX, HP-UX, Windows 9x series, etc.
The approach taken in micro-kernel design is to provide the most fundamental and primitives functions including process scheduling, inter-process communication and low-level address space management. All other services like network protocol stack, device drivers, file systems etc. run in user space. Micro kernel design addresses the drawbacks of monolithic kernel, by providing address space protection between services and making it easier to maintain the kernel due to its smaller size. However, the benefits come at the expense of performance due to the large number of context switches and additional overhead in sharing data between services. Examples of micro kernel implementations are: QNX, Symbian, L4Linx, etc.
All the experiments that were conducted as part of this thesis, used the Linux kernel, which is a monolithic kernel. For the remainder of this thesis, any reference to the Linux kernel or Operating System in the context of our experiments should be considered as referring to version 2.6 of the Linux kernel, unless stated otherwise.
3.2
Packet Processing within the Linux Kernel
3.2.1 Linux Kernel Network Stack – Packet Receiving
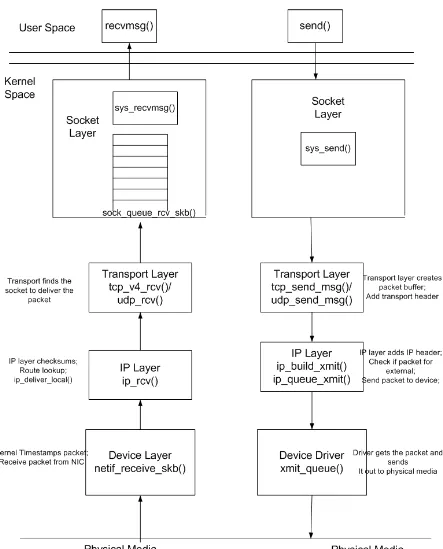
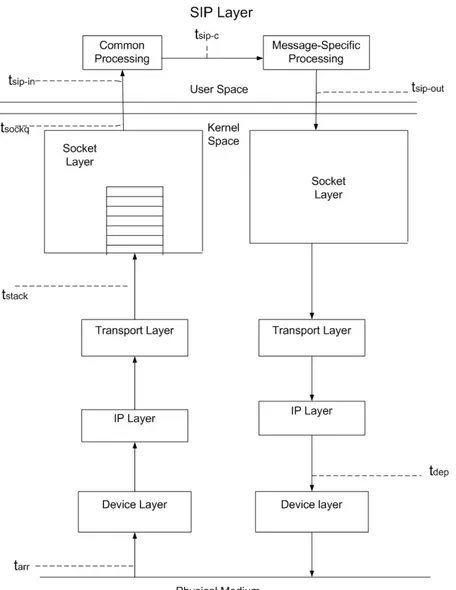
As soon as a packet is received at the Network Interface Card (NIC) it is transferred to a ring bu↵er that is in kernel space. The packet then undergoes the following operations within the Linux kernel stack before it is handed to the application layer [19, 20, 21, 22, 23]:
1. Kernel Device Layer. The kernel device driver interface receives the packet via in-terrupt from the NIC. The netif receive skb() is the main receive data processing function of the kernel. This function is called from softirq (an interruptible kernel event) context and with interrupts enabled. In this function, the kernel time-stamps the packet, checks the payload type and calls any registered handler for that type. For IP traffic the registered handler is ip rcv().
2. IP Layer. ip rcv() handles the packet from the netif receive skb(). The IP layer com-putes the check-sum and carries out a number of other checks, it performs route look-up, and delivers the packet to the transport layer.
3. Transport Layer. The transport layer receives the packet, performs certain checks, and finds the socket to which it must be delivered. It then passes the packet to the kernel socket.
4. Socket Layer. The socket queue rcv skb() call inserts the packet at the tail of the socket’s receive queue; once the packet reaches the head of the queue, it is made available to the application layer socket.
3.2.2 Application Layer Packet Processing
The application layer process waits for packets to arrive on the socket. Once a packet is received from the socket, application specific processing is performed on the packet. If the application needs to forward the packet to a di↵erent network node, the socket function to send the packet to the transport layer is called.
3.2.3 Linux Kernel Network Stack – Packet Sending
Once a packet completes processing at the application layer, it is passed on to the kernel for forwarding and undergoes the following operations [19, 20, 21, 22]: (refer also to Figure 3.2):
2. Transport Layer. The transport layer creates the packet bu↵er and adds the transport header.
3. IP Layer. The IP layer receives the packet and adds the IP header in the ip build -xmit() call. Since the packet is destined for external delivery, the IP layer calls ip -queue xmit()to pass the packet to the device driver.
4. Device Layer. The device driver receives the packet and inserts it in its transmit queue; when the device driver is scheduled to send the packet, it transmits the packet on the physical medium.
3.3
Packet Service and Waiting Time Components
Based on the previous discussion, three main components are identified that make up the total time a packet spends within the System for an application-layer protocol:
1. Krcv: This component represents the time spent within the kernel from the instant the packet is received at the kernel device layer until the instant it is handed o↵ to the Application layer. Note that this component consists of four distinct sub-components:
(a) Kstack: The time it takes for the kernel network stack to process the packet, i.e., to perform various checks and look up the forwarding table. This part involves network and transport layer processing time, hence this component is not part of the service time of the packet for application layer but part of the time the packet spends in the system.
(b) Ksockqw : The time the packet spends waiting at the socket queue before it can be delivered to the application layer.
(c) Ks
sockq: The time it takes the kernel to process the packet while the packet is in the queue. This includes the time to wake the receiving user level process to indicate the availability of data and handling the dequeue request from the user process. This component is part of the service time for the packet within application layer.
(d) Kcopy: The time needed to copy the data from the kernel space to user space.
Clearly,Krcv=Kstack+Ksockqw +Ksockqs +Kcopy.
3. Ksnd: This component represents the time it takes the packet to traverse the kernel on the sending side, until it is transmitted to the physical medium. The application layer passes one packet at a time to the kernel and then is blocked till the kernel has processed the packet and sent it to the device layer. Hence, Ksnd is considered to be part of the packet service time within the application layer.
3.4
Impact of Interrupts and Cache Misses
As the packet arrival rate increases, there is an impact on the Linux kernel because of increased interrupts, context-switching and the resulting cache misses. We now present a literature survey of some of the research that investigated the impact of these factors.
In [24] the author describes the condition of ”receive livelock” which results when the interrupt rate is high enough to cause the system to spend all of its time responding to interrupts. In this case the system does not have any time to perform any other task, and as a result the throughput drops to zero. Under such conditions the system is not deadlocked, but it makes no progress on any of its tasks. The author suggests some techniques to overcome this problem including: using interrupts only to initiate polling, using round-robin polling to fairly allocate resource among di↵erent event sources and temporarily disable interrupts and dropping packets early rather than later to avoid wasted work.
The performance of TCP/IP network stack in Linux kernel 2.4 and 2.5 was studied in [25]. It was observed that the Linux kernel (version 2.4 and 2.5) TCP/IP stack was not efficient in handling high bandwidth network traffic of a gigabit network interface. The Linux TCP/IP stack needed to mimic the interrupt mitigation techniques that network interfaces adopt. The techniques that would accomplish this e↵ect in the TCP/IP stack was explored.
To address the issue raised in [24] and studied in [25] and to handle the increased traffic introduced by Gigabit networks, a modification to the device driver packet processing framework was done for Linux called New API (NAPI) [26]. NAPI works through interrupt mitigation, NAPI allows drivers to run with (some) interrupts disabled during times of high traffic with a corresponding decrease in system load. Another technique used is packet throttling, where the system is overwhelmed, it was found to be better to dispose these packets before much e↵ort goes into processing them. NAPI-compliant drivers can often cause packets to be dropped in the network adaptor itself even before the kernel sees them. NAPI is present in version 2.6 of the Linux kernel.
tandem queuing network comprised of two M/G/1/B queues in series.
In [28] a performance study of memory reference behavior in network protocol processing was carried out. Some of the statistics derived were cache miss rates and percentage of time spent waiting for memory. The interesting finding for the cold cache case i.e. no instruction or data referenced, is cache resident, was that latencies were roughly six times longer for UDP and four times longer for TCP without check-summing.
Context switching introduces high overheads directly and indirectly. Direct context switch overheads include saving and restoring processor registers, flushing the processor pipeline, and executing the OS scheduler. Indirect context switch overheads include the perturbation of the cache and transaction look-ahead bu↵ers (TLB) states. When a process/thread is switched out, another process/thread runs and brings its own working set to the cache. When the switched-out process/thread resumes execution, it has to refill the cache and TLB to restore the state lost due to the context switch. Prior research has shown that indirect context switch overheads, mainly the cache perturbation e↵ect, are significantly larger than direct overheads. In [29], the goal was to understand how cache parameters and application behavior influence the number of context switch misses from which the application su↵ers. The main findings were that context switch misses can contribute to a significant increase in the total (Level 2) L2 cache misses, and they tend to increase along with the cache size up until the cache size is large enough to hold the entire combined working sets. Re-ordered misses tend to contribute to an increasing fraction of context switch misses as the cache size increases. The maximum number of reordered misses occurs when cache perturbation displaces roughly a half of the total cache blocks.
In [30], the relationship between cache misses and software performance was investigated. It was pointed out that one of the missing pieces in the existing models is the relationship between cache misses and timing penalties. Potential causes for the weak relationship between cache misses and timing penalties included (a)competition for hardware prefetch, (b)competition for request handling capacity of the shared cache, and (c)competition for request handling capacity of the memory bus was investigated. It was shown that workloads di↵er significantly in their sensitivity to cache misses.Besides cache misses, workloads can also be sensitive to other aspects of cache sharing. This is seen especially when the ability of the cache to handle multiple requests, or the ability of the cache to initiate prefetch requests, is stressed.
3.5
Measurement Methodology
of the steps a packet takes as it moves from the device driver through the Linux kernel to the SIP layer and back to the device driver. Here we describe the modification we introduced to the kernel and the methodology we used to measure all the components of the packet service and waiting times.
3.5.1 Measuring the Time Components: Kernel and OpenSIPS Modifica-tions
In order to capture all the time components, we modified the OpenSIPS and the Linux kernel source code to obtain and log certain information about each packet as it moves through the system. Each log entry contains a time-stamp along with the source IP address, call id, command sequence, and method type [1] of the packet, i.e., all the information necessary to uniquely identify the message type and related call. Time-stamps are recorded with microsecond precision. As we explain shortly, multiple log entries are recorded for each packet, e.g., when a packet crosses the kernel-user boundary. At the end of the experiment, the log file is parsed and the times-tamps associated with a given packet are processed to determine the time components. Time-stamps are recorded at the various instances as shown in Figure 3.3.
The Krcv Component
We log three time values for each packet in the kernel and a fourth one as soon as it enters the SIP layer:
• tarr: the arrival time of the packet to the SPS, i.e., the time it was received at the kernel device layer. We obtain this value by making a system call with theSIOCGSTAMP flag on the socket that returns the time-stamp attached to the packet by the kernel at the time it arrived.
• tstack: A new field was added to the kernel packet structure to record the time of com-pletion of processing by the kernel network stack for that packet. The time-stamp was recorded just before the packet is added to the socket queue i.e just before (Figure 3.3). socket queue receive skb() , the time-stamp is then stored in this new field. To ob-tain this value in the user space, a new ioctl command SIOCGSTAMPUDP was defined on the same lines as SIOCGSTAMP.
• tsip in: this is the current time, i.e., the time that the packet enters the SIP layer for processing.
Given these time values, we may calculate Krcv and its various components as:
Kstack = tstack tarr,
Ksockq=Ksockqs +Ksockqw = tsockq tstack,
Kcopy = tsip in tsockq,
Krcv = tsip in tarr. (3.1)
The Tsip Component
The Tsip component is the time that the packet undergoes processing at the SIP layer. Tsip corresponds to theTappcomponent of Section 3.2, when the Application layer protocol is SIP.
For each packet, we log two additional time values within the SIP layer:
• tsip c: this is the instant at which the packet processing part that is common to all packet types is complete.
• tsip out: this is the instant at which the SIP layer has completed the processing of the packet and is ready to pass the packet back to the kernel (i.e., just before themsg send() call that send the packet to the transport layer returns).
From these values, the SIP service time and its sub-components can be calculated as:
Tsip1 = tsip c tsip in,
Tsip2 = tsip out tsip c,
Tsip = Tsip1 +Tsip2 . (3.2)
The Ksnd Component
• Tdep: the instant at which the packet departs the kernel layer and control is transferred back to SIP layer. Although the time-stamp is taken at the SIP layer, logically, it corre-sponds to the time shown in Figure 3.3.
Using this value and theTsip outvalue, theKsnd value is calculated as:
Ksnd = Tdep Tsip out (3.3)
Chapter 4
Evaluation of SIP Proxy Server
Performance: Packet-Level
Measurements and Queuing Model
In this chapter, we present the findings of our investigation of the performance of OpenSIPS [3], an open source SIP proxy server. Our work makes several contributions.
• As described in Chapter 3, we modified both the Linux kernel and the OpenSIPS server source code to obtain packet-level measurements for each SIP message, from which the service and waiting times within the kernel and the SIP layer can be easily obtained. In particular, the kernel modifications can be used for collecting such measurements forany
protocol, while the OpenSIPS modifications may be easily adapted to other application servers.
• We enhanced SIPp [4] a SIP traffic generator tool, to generate calls with inter-arrival times that follow any user-specified distribution. The modified versions of the kernel, OpenSIPS, and SIPpare attached as Appendix.
• We have collected a large set of experimental data to characterize the performance of the SPS under various call arrival rates and inter-arrival time distributions.
• Based on these measurements, we model the SIP proxy server as an M/G/1 queue. A key component of the model is a parameter that captures the interrupt overhead, i.e., the impact of interrupts on socket queue service times.
4.1
Experimental Setup
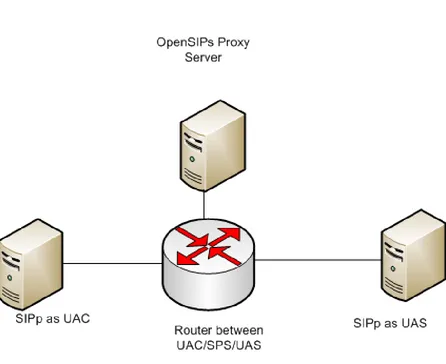
Figure 4.1: Testbed for performance measurements of OpenSIPS SPS
Figure 4.1 shows the network testbed that we used to generate SIP calls and collect mea-surement data so as to characterize the performance of the SPS as a function of traffic load. The hardware setup consists of:
• SIPp UAC. This is an HP workstation with dual IntelR XeonR CPU 3050 @2.13GHz processors, running Redhat Linux 4.1.2-44 (Linux kernel version 2.6.18) OS. The SIPp[4] tool was run on this machine configured as a UAC, as we describe shortly.
• SIPp UAS. This is an HP workstation with quad IntelR XeonR CPU E5540 @2.53GHz processors, running Redhat Linux 4.1.2-44 (Linux kernel version 2.6.18) OS. The SIPp
tool was run on this machine configured as a UAS.
• Router. Each of the three workstations above (SPS, UAC, and UAS) is attached to a di↵erent port of a Cisco 7206 VXR series router through 1 GigE interfaces. The router sim-ply forwards SIP messages between the three workstations, and due to its high switching capacity, it does not introduce any material delay for any of the traffic loads we generated.
4.1.1 OpenSIPS as SPS
We installed the Debian 5.0.6 Linux Distribution and the OpenSIPS server (specifically, the opensips-1.6.2-notls version of the source code) on the workstation acting as the SPS, following the instructions in [31]. All the experiments were carried out by configuring the server in stateful mode such that the state of the transaction is maintained until a final response is received.
We configured UDP as the transport layer protocol, and we modified the default configu-ration file (i.e., opensips.cfg) to set the number of child processes to one, so as to have a single SIP layer process handling all incoming messages. The configuration was also modified to disable authentication and loose routing for SIP packets.
We start the OpenSIPS SPS using the command
opensips -f /etc/opensips/opensips.cfg -m 2048
where the “-m” option increases the shared memory to 2048 MB when OpenSIPS runs.
4.1.2 SIPp as UAC
SIPpis a free open source test tool and traffic generator for the SIP protocol. It includes a few basic user agent scenarios (including UAC and UAS). SIPpcan be used to establishe and release multiple calls with theINVITEandBYEmethods, respectively. It may also import custom XML scenario files describing call flows of various levels of complexity.
deterministic fashion, making it impossible to test the performance of the SPS under various distributions of call inter-arrival times.
To address this limitation, we enhanced the source code of the SIPptool to generate arrivals based on a user specified input file. Specifically, we added a new option “iat file <filename>” to the latest stable release (version 3.1) of the tool available from the source repository [4] at the time of this writing. The user-specified file is expected to contain a single number per line, representing the inter-arrival time between consecutive calls. When invoked with this new option, the modified version of the tool processes this input file one line at a time, generating one call and waiting for the specified amount of time before proceeding to the next line. As a sanity check, we tested the modified version of the tool on a input file having deterministic inter-arrival times (i.e., the same number in each line), and verified that its functionality was not a↵ected (i.e., the results were identical to those produced by the original, unmodified tool invoked with the corresponding call arrival rate).
We implemented another enhancement to overcome the 1 ms limitation in the granularity of call inter-arrival times imposed by the original SIPptool. To this end, we reduced the polling period of the tool to 200µs. This new feature allows the input file specified with the new “iat -file” option to contain inter-arrival times expressed at this finer granularity, making it possible to generate values that accurately represent general time distributions.
For the experiments, we start the modified SIPp tool to act as the UAC using the following command:
./sipp -sf <uac.xml> <SPS IP addr>:5060
-s<username> -m <#calls> -iat f ile <filename>
The command specifies the IP address of the SPS workstation and the standard SIP port (i.e., 5060) to send the generated traffic, and includes four options:
• -sf: Run the specified XML file as the scenario, acting as a UAC to originate SIP calls. The uac.xml file we used was modified slightly from the one embedded in the sipp executable. Specifically, we disabled the retransmission of SIP messages so as to avoid processing the same call again.
• -s: Set the username part of the request URI (required so that the SPS can forward the call).
• -m: Specify the total number of calls to generate.
4.1.3 SIPp as UAS
The latest available stable release of the SIPptool available at the time of this writing (version 3.1) has a software bug that prevents the processing of call rates above 300 calls per second (cps). Therefore, for the UAS, we use the most recent unstable release dated 2009-07-09 for which this error was not observed.
We start the SIPp tool to act as the UAS using the command
./sipp -sf <uas.xml>-rsa <SPS IP address>
with the two options:
• -sf: Run the specified XML file as the scenario. Theuas.xml we used was modified from the built-in UAS scenario to (1) remove the pause after the BYEmessage is sent and (2) disable the retransmission of SIP messages (as with the UAC).
• -rsa: Provide the remote sending address where the message needs to be sent.
4.2
Experiments and Performance Measurements
We conducted a large set of experiments to measure the componentsKrcv,Kstack,Ksockq,Ksnd and Tsip, that we described in Chapter 3.5, of the time each SIP packet spends at the SPS. For each experiment, the UAC initiates 1M (million) calls to the UAS. Each call is accepted by the UAS, resulting in the message exchange shown in Figure 2.2. Therefore, for each call, six di↵erent messages are generated by either the UAC or the UAS and are forwarded to the other party via the SPS. In other words, for each experiment, the SPS may process up to 6M SIP messages, i.e., up to 1M messages of each type seen in Figure 2.2. Each experiment is characterized by two parameters:
• Call arrival rate. We varied the call arrival rate from 100 cps to 1200 cps. At a rate of 1200 cps, the SPS crashes frequently as it cannot handle the message volume, indicating that the server is severely overloaded.
Table 4.1: Measured Mean Values and Confidence Intervals forKrcv, and Poisson Inter-Arrivals (µS)
Message Type Call Arrival Rate
100cps 200cps 400cps 600cps 700cps 800cps 900cps 1000cps 1200cps INVITE 24.5 38.74 82.35 201.4 340.3 672.61 9747.0 29092.5 40207.7 180 Ringing 33.0 53.46 114.7 266.55 428.22 788.19 6228.9 23851.6 29868.36 200 OK
(INVITE)
36.2 64.62 131.15 262.99 398.8 717.72 13183 34085.47 44259.25
ACK 21.7 38.96 100.45 240.15 382.28 712.72 6567.6 24315.56 32157.11 BYE 54.1 92.08 162.02 284.06 411.21 725.27 12545 33088.71 38225.25 200 OK (BYE) 29.5 55.43 134.13 294.85 444.74 775.41 6431.23 23810.67 31375.82 Overall Mean 33.17 57.2 120.80 258.33 400.93 731.99 9116.5 28065.01 36262.29 Conf. Int.
(Half-Width)
0.304 .649 1.71 3.48 5.595 19.39 3332.16 3164.98 6129.90
# Messages to SIP layer
5,999,931 5,999,940 5,999,943 5,999,931 5,999,943 5,999,940 5,823,173 5,359,200 3,457,644
For each packet processed by the SPS, we log the seven time values tarr, tstack, tsockq,
tsip in, tsip c, tsip out and tdep. We then process the log files to obtain the mean values for quantitiesKrcv,Kstack,Ksockq Tsip, andKsnd; we record both the overall mean (i.e., across all packets) and the mean per packet type. We also use the method of batch means to estimate 95% confidence intervals around the overall mean.
The call holding time in all experiments was set to 250 ms. Referring to Figure 2.2, the call holding time is defined as the interval between the instant the UAC acknowledges the 200 OK message until it closes the session by sending a BYE. Note that the SPS is not involved after a session has been established, as no SIP messages are exchanged during the call until the time the session is closed with a BYE. A short call holding time (1) ensures that the experiments do not take an extraordinarily long time, and (2) provides a worst-case scenario in that the SPS is observed under higher than normal packet arrival rates. This is because, with longer holding times the same number of response messages would arrive at the SPS but over a longer time period.
Table 4.2: Measured Mean Values and Confidence Intervals for Krcv, Deterministic Inter-Arrivals (µs)
Message Type Call Arrival Rate
100cps 200cps 400cps 600cps 700cps 800cps 900cps 1000cps 1200cps INVITE 13.4 98.1 141.5 256.4 337.3 466.1 751.8 25500.9 27021 180 Ringing 14.3 19.22 46.6 133.7 212.9 342.98 623.42 24139 25335 200 OK
(INVITE)
17.0 19.05 71.4 176.27 209.9 363.99 590.85 25965 28293
ACK 13.4 19.04 62.3 197.29 187.13 434.52 604.44 24358 25997 BYE 24.8 31.07 86.1 159.48 211.16 293.54 548.35 26198 28542 200 OK (BYE) 14.3 21.2 59.97 210.2 262.17 418.4 656.77 24656.9 25662 Overall Mean 16.2 34.6 78.0 188.9 236.76 386.6 629.27 25137 26813 Conf. Int.
(Half-Width)
0.294 0.48 1.59 5.28 6.38 8.17 24.7 628.13 639
# Messages to SIP layer
5,999,940 5,999,940 5,999,939 5,999,940 5,999,940 5,999,940 5,999,940 4,984,808 4,046,503
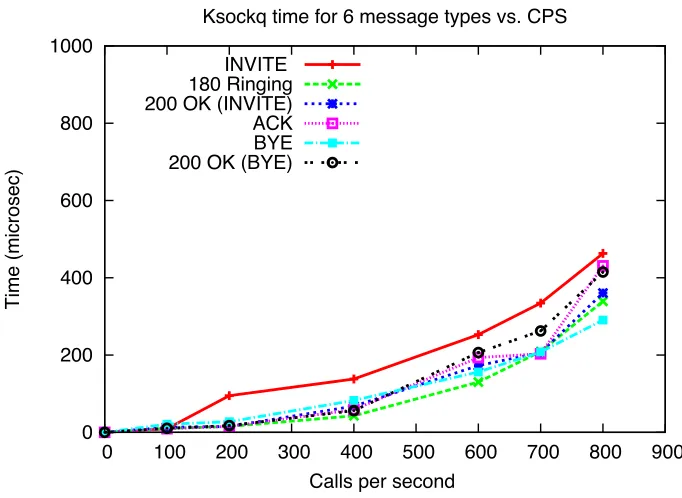
Figures 4.2 and 4.3 present the Ksockq values we have obtained for various messages and exponential and deterministic distribution inter-arrivals in the stable region (for call rate up-to 800cps). From the figures 4.2 and 4.3 we can observe that as the arrival rate increases, there is a corresponding increase in the Ksockq. As described in Chapter 3, Ksockq comprises of the time the packet spends waiting at the socket queue before it can be delivered to the application layer and the time it takes the kernel to process the packet while the packet is in the queue.
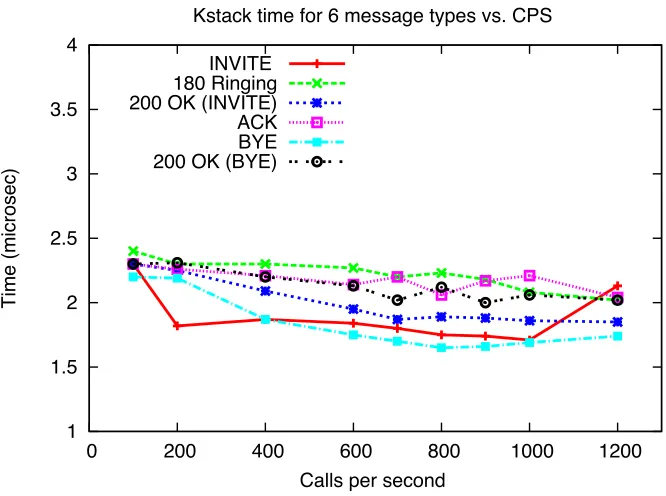
Figures 4.4 and 4.5 present the Kstack values we have obtained. Kstack is the time taken by kernel network stack to process the packet, from the point the packet is received from the device, till the point the packet is placed in the socket queue. From these figures we can observe that kernel stack processing time Kstack is mostly constant, with the average value of 2 µs, independent of message type and call arrival rate.
The values of Kcopy, obtained from the these data as (Krcv Kstack Ksockq), are also constant at around 2µs.
We observe that all mean values of Krcv and Ksockq increase rapidly with the call arrival rate up to 1000 cps, but level o↵ beyond that rate. The contributing factor to the increase in these values are:
• Queuing delay. As the call arrival rate increases, packets arriving at the SPS are bu↵ered at the socket queue and experience increasing waiting timesKsockqw before being delivered to the SIP layer.
0 200 400 600 800 1000
0 100 200 300 400 500 600 700 800 900
Time (microsec)
Calls per second
Ksockq time for 6 message types vs. CPS INVITE
180 Ringing 200 OK (INVITE) ACK BYE 200 OK (BYE)
Figure 4.2: Mean value of Ksockq in the stable region, Poisson Arrivals
0 200 400 600 800 1000
0 100 200 300 400 500 600 700 800 900
Time (microsec)
Calls per second
Ksockq time for 6 message types vs. CPS INVITE
180 Ringing 200 OK (INVITE) ACK BYE 200 OK (BYE)
1 1.5 2 2.5 3 3.5 4
0 200 400 600 800 1000 1200
Time (microsec)
Calls per second
Kstack time for 6 message types vs. CPS
INVITE 180 Ringing 200 OK (INVITE) ACK BYE 200 OK (BYE)
Figure 4.4: Mean value ofKstack, Poisson Arrivals
1 1.5 2 2.5 3 3.5 4
0 200 400 600 800 1000 1200
Time (microsec)
Calls per second
Kstack time for 6 message types vs. CPS INVITE
180 Ringing 200 OK (INVITE) ACK BYE 200 OK (BYE)
of cache misses due to these interrupts. A cache miss causes the number of CPU cycles consumed by the network stack receiving process to increase, as the memory access cycles of main memory are several times that of L2 caches.
We also observe that, up to a rate of 800 cps for exponentially distributed inter-arrivals, the number of packets dropped at the kernel is extremely small (about 0.001% of the 6M packets generated) and does not vary much with the arrival rate, for deterministic inter-arrival this is valid till 900 cps.
However, at 900 cps for exponential distribution and at 1000 cps for deterministic distri-bution, packet losses increase substantially, and at 1200 cps the loss rate is about 42%. The leveling o↵of the measured Krcvvalues at 1200 cps is due to the fact that the dropped packets are not observed at the SIP layer where statistics are logged, hence they are not taken into account in the average values shown in the tables.
Finally, while the trends seen in the data in the tables are similar for both distribution, there are some di↵erences. Specifically, with the exception of the INVITE message, the mean values (including the overall mean) under deterministic inter-arrivals are lower than under exponential inter-arrival times in the stable region (i.e., up to 900 cps). On the other hand, INVITEmessage experience higher times in the kernel for arrival rates between 200 and 800 cps under deterministic inter-arrivals. We believe that this relative behavior is due to the fact that, with exponential inter-arrival times, the system experiences bursts of call (i.e., INVITE
message) arrivals, that, in turn, lead to higher waiting times overall. With deterministic arrivals, calls are spaced apart evenly, hence most messages experience lower delays in the stable region. However, due to the fact that call holding times were fixed to 250 ms, for medium (deterministic) arrival rates, new INVITEmessages may consistently arrive at the SPS while the previous call’s tear down messages are being processed, leading to higher waiting times for the former.
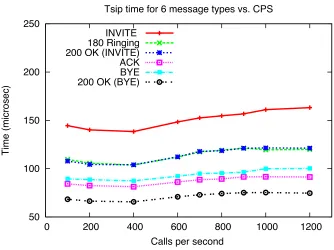
4.2.2 Experimental Results: Measurement Data for Tsip
50 100 150 200 250
0 200 400 600 800 1000 1200
Time (microsec)
Calls per second
Tsip time for 6 message types vs. CPS INVITE
180 Ringing 200 OK (INVITE) ACK BYE 200 OK (BYE)
Figure 4.6: Mean value forTsip, Poisson Arrivals
50 100 150 200 250
0 200 400 600 800 1000 1200
Time (microsec)
Calls per second
Tsip time for 6 message types vs. CPS INVITE
180 Ringing 200 OK (INVITE) ACK BYE 200 OK (BYE)
Another important observation is that mean SIP service times for all message types increase almost linearly with the call rate. Recall that an SPS operating in stateful mode needs to perform table look-ups for each incoming message, so as to match an existing transaction or create a new one. As the call rate increases, the number of transactions in the system also increases, resulting in larger tables at the SIP layer and, hence, longer look-up and overall service times. Part of the service time increase may also be attributed to the higher logging rate at higher call rates; this overhead cannot be avoided, but we believe that it is not a significant factor.
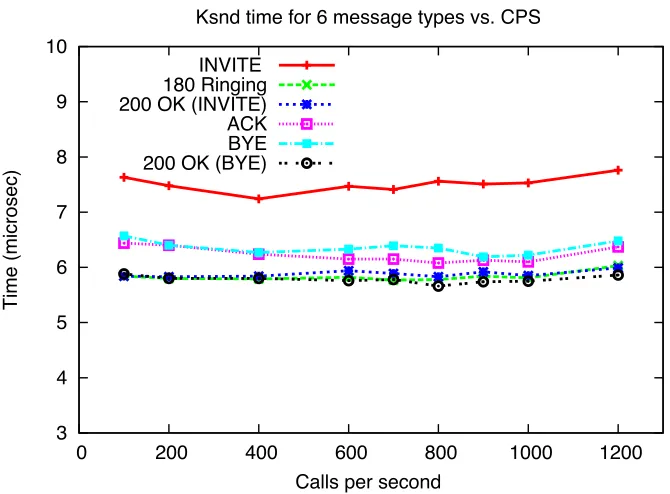
4.2.3 Experimental Results: Measurement Data for Ksnd
Figures 4.8 and 4.9 present values of the kernel service timeKsnd incurred for sending a packet received from the SIP layer down to the device driver for exponential and deterministic inter-arrivals respectively. We observe that this service time varies only slightly for each message type. However, across various call arrival rates, the value remains fairly constant for a given message type.
4.2.4 Experimental Results: Overall mean for Ksockq and Tsip
Figure 4.10 shows the overall average and the confidence interval over all the message types for
Ksockq for both exponential and deterministic inter-arrivals. In the earlier figures forKsockq we showed the data in the stable region. This figure shows the point where the waiting time vastly increases as the call rate continues to increase and the SPS reaches a point, where the system is not stable (call rates above 900cps).
Figure 4.11 presents the overall mean and confidence interval over Tsip over all six message types, for both exponential and deterministic inter-arrivals. An important observation is that mean SIP service times for both inter-arrival types increase almost linearly with the call rate. Also, the service times for both types are almost equal for various call rates.
4.3
M/G/1
Queuing Model for the SPS
3 4 5 6 7 8 9 10
0 200 400 600 800 1000 1200
Time (microsec)
Calls per second
Ksnd time for 6 message types vs. CPS
INVITE 180 Ringing 200 OK (INVITE) ACK BYE 200 OK (BYE)
Figure 4.8: Mean value of Ksnd, Poisson Arrivals
3 4 5 6 7 8 9 10
0 200 400 600 800 1000 1200
Time (microsec)
Calls per second
Ksnd time for 6 message types vs. CPS
INVITE 180 Ringing 200 OK (INVITE) ACK BYE 200 OK (BYE)
0 10000 20000 30000 40000 50000
0 200 400 600 800 1000 1200
Time (microsec)
Calls per second
Overall Mean Ksockq time vs. CPS
Poisson Arrivals Deterministic Arrivals
Figure 4.10: Overall Mean value of Ksockq and Confidence Interval
60 80 100 120 140 160 180
0 200 400 600 800 1000 1200
Time (microsec)
Calls per second Mean Tsip time vs. CPS
Poisson Arrivals Deterministic Arrivals