Experimental Analysis of Water Distribution
Network and its Hydraulic Simulation by
EPANET
Suchit Kolpe1, Deepali Vaidya2
P.G. Student, Department of Civil Engineering, Sinhgad College of Engineering College, Pune, Maharashtra, India1 Associate Professor, Department of Civil Engineering, Sinhgad College of Engineering College, Pune,
Maharashtra, India2
ABSTRACT: Water distribution network is a system of engineered hydraulic components which supplies water from the source to the required area. The purpose of distribution system is to deliver water to consumer with appropriate quality, quantity and pressure. A pipe network is treated as analyzed when all the unknown parameters are determined with the help of the known parameters and the available interrelating equations. Analysis of complex water distribution network becomes simple due to hydraulic simulation. Due to hydraulic simulation of water distribution network we can check the feasibility of the network without implementing it. This project is an attempt to analyse the physical model of double loop water distribution network experimentally and by hydraulic simulation. Hardy Cross method is used to analyse the network manually and hydraulic simulation is done using EPANET. Physical model of double loop network was tested for varying source head and it was simulated for the same conditions as the physical model was tested and the results were compared.
KEYWORDS:EPANET; Hardy Cross Method; Hydraulic simulation; Double loop network.
I. INTRODUCTION
Literature reviewed is related to water distribution network analysis by Hardy cross method using excel and simulation of water distribution network using EPANET
.
The major objective of this paper was to give an alternative to time consuming calculations of solving an water distribution network by Hardy Cross Method by using spreadsheet software(1)
In this paper, a new method categorized as a modification to the Q–h equations was pro- posed for the analysis of pipe networks. The method is inspired by the Kani method which is used for analysis of structural frames. The new method can be considered as an iterative procedure which does not require a large system of nonlinear equations to be solved simultaneously.(2) The present system of supply adopted in Chirala municipality is an intermittent supply and the network adopted is a dead end system. This system of supply of water in Chirala municipality may or may not be reliable to the upcoming years. Hence the research is all about the analysis of the existing network and concludes about the reliability on the network for the future.(3) Excel spreadsheet reduces the cumbersome calculations involved in analytical methods like Hardy Cross method. Different modifications in Q-H equations can be proposed which would reduce the non linearity in the equations EPANET is a reliable software and it is freely available and can be effectively used for simulation of water distribution network A lot of research is going on the effect of different leakage patterns on pressure in WDN. So there is scope for further research.IV.METHODOLOGY
Experimentation was done on double loop network consisting of one source three outlets. The arrangement was done similar to as shown in the schematic diagram. The experimental observations were further used for manual analysis Form the experimental data the network was analyzed by Hardy Cross method and flow rate through each pipe was found. Hydraulic simulation was done using EPANET by following steps given in manual. Simulated results were compared with the Hardy Cross method results.
V.NETWORKSETUPFOREXPERIMENT
Fig 1: Schematic diagram of double loop network The following figure shows the experimental setup for the double loop network
Fig 2: experimental setup for double loop network
VI. RESULTS
This chapter deals with the results from analysis of double loop network by Hardy Cross Method and its simulation in EPANET for varying source head.
The results from experimental analysis (Hardy Cross Method) and hydraulic simulation are compared in table below. Table No 1: comparison of discharges
Table no 2: Comparison of discharges
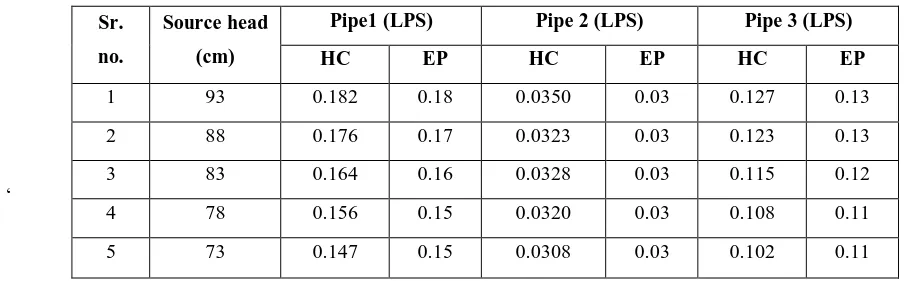
The following graph no 1 shows the comparison of discharge values calculated by Hardy Cross method and that from EPANET results.
Graph no 1: comparison of discharges
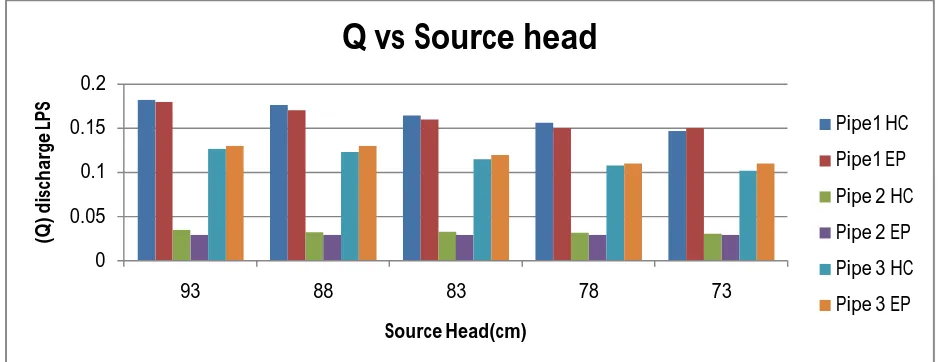
Graph no 2 shows the comparison of discharges for remaining pipes.
0 0.05 0.1 0.15 0.2
93 88 83 78 73
(Q
)
d
is
ch
ar
ge
L
P
S
Source Head(cm)
Q vs Source head
Pipe1 HC
Pipe1 EP
Pipe 2 HC
Pipe 2 EP
Pipe 3 HC
Pipe 3 EP
Sr
no
Source head
(cm)
Pipe 5 (LPS) Pipe 6 (LPS) Pipe 7 (LPS)
HC EP HC EP HC EP
Graph no 2: comparison of discharges
The discharge through each pipe decreases as the source head decreases.. The flow through pipe 1is maximum in each case. Discharge through pipe 2 is minimum
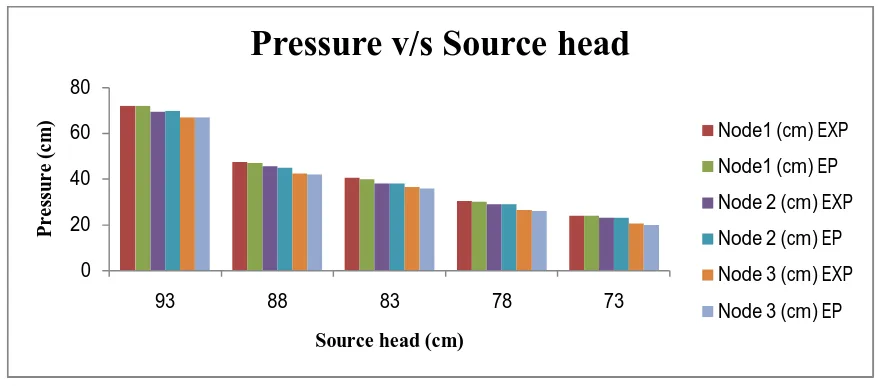
The following tables show the comparison of pressure at each node observed experimentally and that from EPANET results
Table no 3: Comparison of pressure
Sr no Source head
(cm)
Node1 (cm) Node 2 (cm) Node 3 (cm)
EXP EP EXP EP EXP EP
1 93 72 72 69.5 70 67 67 2 88 47.5 47 45.5 45 42.5 42 3 83 40.5 40 38 38 36.5 36 4 78 30.5 30 29 29 26.5 26 5 73 24 24 23 23 20.5 20
0 0.02 0.04 0.06 0.08 0.1 0.12 0.14 0.16 0.18
93 88 83 78 73
(Q
)
d
is
ch
ar
ge
L
P
S
Source Head(cm)
Q vs Source head
Pipe 4 HC
Pipe 4 EP
Pipe 5 HC
Pipe 5 EP
Pipe 6 HC
Pipe 6 EP
Pipe 7 HC
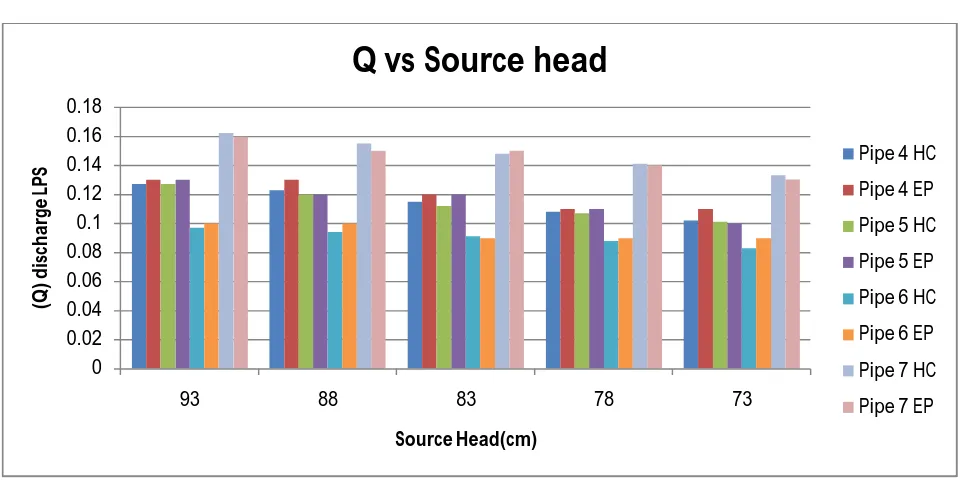
Graph no 3 and 4 show the comparison pf pressures at each node observed experimentally and that from EPANET results.
Graph no 3: comparison of node pressure
The following graph shows the comparison of pressure at various nodes observed experimentally and that from the EPANET results.
0 20 40 60 80
93 88 83 78 73
P
r
e
ss
u
r
e
(c
m
)
Source head (cm)
Pressure v/s Source head
Node1 (cm) EXP
Node1 (cm) EP
Node 2 (cm) EXP
Node 2 (cm) EP
Node 3 (cm) EXP
Node 3 (cm) EP
Sr no Source head
(cm)
Node 4 (cm) Node 5 (cm) Node 6 (cm)
EXP EP EXP EP EXP EP
Graph no 4: comparison of pressure
The pressure at each node goes on decreasing as the source head decreases. As observed from the graph there is abrupt drop in pressure after the source head changes from 93cm to 88cm
VII. CONCLUSIONS
Results from experimental analysis by Hardy Cross method are similar for five cases of different source head.
The discharge through pipes decreases by 19 % as the source head decreases by 22%.
The pressure at each node decreses by 67 % as the source head decreases by 22%
VIII. FUTURE SCOPE
Variation of pressure at demand nodes can be studied for various discharges for constant source head.
Thus a relation can be established between pressure and discharge.
Analysing the network on small scale and applying it on larger network i.e. practical network would be beneficial.
ACKNOWLEDGMENT
First and foremost, I would like to thank my Project guide, Mrs D. R. Vaidya for her guidance and support. I will forever remain grateful for the constant support and guidance extended by my guide. Through our many discussions, he helped me to form and solidify ideas. The invaluable discussions I had with him, the penetrating questions he has put to
0 20 40 60 80
93 88 83 78 73
P
r
e
ss
u
r
e
(c
m
)
Source head (cm)
Pressure v/s Source head
Node 4 (cm) EXP
Node 4 (cm) EP
Node 5 (cm) EXP
Node 5 (cm) EP
Node 6 (cm) EXP
(2004).Volume 130 , 733-745. (2004).
4. Dr. G. Venkata, Ramana, Ch. V. S. S. Sudheer, B. Rajasekhar, “Network Analysis of Water Distribution System in rural areas using EPANET”, Elsevier (2015) Volume 119, 496-505. (2015)
5. G. Anisha, A. Kumar, J. Ashok Kumar, P. Suvarna Raju, “Analysis and Design of Water Distribution Network Using EPANET for Chirala Municipality in Prakasam District of Andhra Pradesh”, IJEAS (2016), Volume 3, 2394-3010. (2016)
6. Maryam Abareshi, Seyed Mahmood Hosseini, Ahmad Aftabi, “A simple iterative method for water distribution network analysis”, Elsevier (2017),Volume 52, 274-287. (2017)
7. Pramod R. Bhave, “Analysis of flow in water distribution networks.” 8. EPANET Manual.
9. Compilation of Water supply and treatment-containing complete text of Central Public Health and Environmental Engineering Organization manual on Water supply and treatment, Akalnk Publications
10. M. Günthera, D. Steffelbauera, M. Neumayerb, D. Fuchs-Hanuscha, “Experimental Setup to Examine Leakage Outflow in a Scaled Water Distribution Network.” 16th Conferenceon Water Distribution System Analysis, WDSA 2014- Procedia Engineering 89 ( 2014 )311 – 317 11. D. Salaa, P. Kołakowskia, “Detection of leaks in a small-scale water distribution network based on pressure data - experimental verification.”
12th International Conference onComputing and Control for the Water Industry, CCWI2013, Procedia Engineering 70(2014) 1460 – 1469 12. D. J. Vicente, L. Garrote, R. Sanchez, D. Santillan, “Pressure management in Water Distribution Systems: Current status, Proposals and future