ISSN (Print) : 2347 - 6710
I
nternationalJ
ournal ofI
nnovativeR
esearch inS
cience,E
ngineering andT
echnologyVolume 3, Special Issue 3, March 2014
2014 International Conference on Innovations in Engineering and Technology (ICIET’14)
On 21st & 22nd March Organized by
K.L.N. College of Engineering, Madurai, Tamil Nadu, India
Optimal Sizing and Placement of Distributed
Generation in Radial Distribution Feeder Using
Analytical Approach
M.Jegadeesan
1,V.Keerthana *
2professor, Department of Electrical and Electronics Engg, K.L.N College of Engineering, Pottapalayam, TamilNadu, India.
Student ,Department of Electrical and Electronics Engg, K.L.N College of Engineering, Pottapalayam, TamilNadu, India.
ABSTRACT— A Radial Distribution network is important in power system area because of its simple design and reduced cost. Impact of Distributed generation in radial distribution feeder is increased because of its application of green technology and it also meet out some of the power system issues. Allocation of Distributed Generation at non-optimal places leads to increased power loss and reduced bus voltage profile. To overcome these power system issues Distributed Generation should be optimally placed and sized at Radial Distribution Feeder. Optimal sizing of Distributed Generation can be calculated using analytical expression and an efficient approach is used to determine the optimum location for Distributed Generation Placement. By proper sizing and allocation of Distributed Generation in Radial Distribution Feeder minimizes the power loss and improves the voltage profile. To demonstrate the performance of the proposed approach various radial distribution systems was tested and validated with different sizes and the results were discussed.
KEYWORDS—Radial Distribution System, Distributed Generation, Loss Reduction, voltage profile, analytical expression, optimal location and sizing.
I. INTRODUCTION
Distributed Generation is an emerging technology in this new era and it provides clean electric power. Distributed Generation should be located at or near an electrical load Centre. Installation of Distributed Generation at optimal places provides the clean electric power to the customer [1]. Dispersed Generation is connected directly to the radial distribution network or it connected directly to the customer side of the meter. Different issues have been mentioned to define the Distributed generation more importantly .Some of the issues of DG is Distributed Generation Rating, then
other are Technology, sizing, sitting, mode of operation, Distributed Generation penetration [2].Distributed Generation is a small generating unit located in the effective point of the electric power system near to the load center. DG Technology comprises of Wind energy, Solar Energy, micro-turbine, fuel cell and gas turbine [3].
Optimal DG allocation by single DG placement at the corresponding bus voltage profile at various buses is evaluated and the total power loss is also calculated using Newton-Raphson method [4]. Distribution Network analysis using power flow study plays an important role in the power system area. Distribution network is mostly characterized by their high R/X ratio and radial topology. Backward/forward sweep method is used as an initial power flow for radial distribution system with the consideration of Distributed Generation [5]. Optimal placement and sizing of DG using NR method of load flow study at the proper bus location minimizes both the losses and the costs simultaneously which helps in maximizing the potential benefits [6].
Many optimization tools like Genetic algorithm, Particle Swarm Optimization, Artificial Bee Colony algorithm and Differential Evaluation are still used in the power system optimization problem to solve Different DG unit’s problem. By the optimal allocation and sizing of DG units at radial Distribution network using Genetic Algorithm Electrical losses were minimized, system reliability levels and voltage profile values were improved [3].Optimal sizing and location of Distributed Generation is determined using PSO algorithm. By proper placement of DG at relevant bus location the total cost of system, the economic cost and real power losses are minimized then
the corresponding bus voltages are improved [7].
Approach improves the voltage profile [8].Proper Placement and
sizing of Distributed Generation at radial distribution feeder is calculated using Differential Evolution Algorithm and it has a significant impact on reduction of active power loss and improvement of voltage profile [9].
In this paper a new emerging approach called analytical approach is used to calculate optimal DG unit’s size and proper location. So that the real power losses, reactive power losses were minimized and the corresponding voltage profile values were improved. The proposed approach has been tested on IEEE 15bus and 34 bus radial distribution systems. Result obtain from this approach clearly explains the optimal location and sizing of DG thereby minimizes the power losses of the system. The remainder of this paper is structured as follows Section II presents Problem Formulation, Section III explains about Proposed Methodology, Section IV describes about Simulation Results and Discussions, and finally Section V explains about Conclusion.
II. PROBLEM FORMULATION
The main objective of the proposed approach is to minimize the total system power loss by Optimal Sizing and sitting of Distributed Generation in radial distribution system. The objective function is mathematically formulated as follows [10]
Minimize S n (P Q )
1 i loss loss loss
(1)
Total Active Power loss in a Radial distribution system is given by
P min( (I ) *R ) i 2 n 1 i i loss
(2)
Total Reactive Power loss in a distribution system is also given by
Q min( (I ) *X ) i 2 n 1 i i loss
(3)
Where, n is the number of lines at bus i, i
I is the line current at bus i in ohms,
R
iis the line resistance in ohmsand Xiis line reactance at bus i in ohms respectively.
The Total System Power Loss is also formulated as exact loss formula [10] which includes real and reactive
power losses respectively.
The Exact Real power loss is given by
)] Q P P (Q b ) Q Q P (P [a
P i j i j ij i j i j
n 1 i n 1 j ij
loss
(4) Where, ) δ sin(δ * V V R b ) δ cos(δ * V V R a j i j i ij ij j i j i ij ij
The Exact Reactive power loss is given by
)] Q P P (Q d ) Q Q P (P [c
Q i j i j ij i j i j
n 1 i n 1 j ij
loss
(5) Where, ) δ sin(δ * V V X d ) δ cos(δ * V V X c j i j i ij ij j i j i ij ij
The Total impedance between the bus i and bus j is given by
Z
ij
R
ij
jX
ij (6)Where,
n is the number of lines
ij ij ij
ij
,
b
,
c
and
d
a
are function of loss coefficientbetween bus i and j.
i
P
is real power flow at bus in KWi
Q
is reactive power flow at bus i in KVARj
P
is real power flow at bus j in KWj
Q
is reactive power flow at bus j in KVARij
R
is Resistance of the line connecting bus i and j inOhms
ij
X
is Reactance of the line connecting bus i and j inOhms
j i
and
V
V
are bus voltage magnitude at bus i and j in PUj i
and
δ
δ
are bus voltage angle at bus i and j2.1. Operational Constraints
Another significant part of the objective function is to satisfy the operational constraints. The operational constraints are classified into two types they are
(i) Equality Constraints (ii) Inequality Constraints (i) Equality Constraints
Real and Reactive power balance constraints are related to the non-linear power flow equations. The power balance constraints is formulated as follows
Pi PDGiPDi (7)
Qi QDGiQDi (8)
Where,
i
P
is real power flow at bus i in KWi
Approach
DGi
P
is real power generation from DG placed at bus i in KWDGi
Q
is reactive power generation from DG placed at bus i in KVARDi
P
is real power demand at bus i in KWDi
Q
is reactive power demand at bus i in KVAR(ii) Inequality Constraints
Inequality Constraints lies between acceptable limits to satisfy the objective function.
Bus Voltage limits
Bus Voltage magnitude is to be kept within acceptable operating limits then the bus voltage limit is given by
V
im in
V
i
V
im ax (9)Where,
V
im inand
V
im axare lower and upper bound busvoltage limits in PU
DG Capacities
The Capacity of each DG unit should be differ around its nominal value. So that each DG unit must be maintained with in an acceptable limit. The capacity of DG is given as follows
P
DGim in
P
DGi
P
DGim ax (10)
Q
DGim in
Q
DGi
Q
DGim ax (11)Where,
m ax DGi m in
DGi
and
P
P
are minimum and maximum realpower generation from DG Capacity in KW.
m ax DGi m in
DGi
and
Q
Q
are minimum and maximumreactive power generations from DG Capacity in KVAR.
III. PROPOSED METHODOLOGY
In this section a various radial distribution system is used to locate the DG in an optimal place with the proper sizing. The Proposed Approach needs power flow to be run for two times, one for the initial base case and another at the final stage with the DG to obtain the optimal solution.
3.1. Optimal DG Sizing and Location
Distributed Generation Sizing and location at optimal places in radial distribution feeder gathers a great importance in power system area. The installation of DG at non-optimal places leads to higher losses and reduced voltage profile. For that reason, the development of new method called analytical approach is capable of indicating
the DG unit allocation and sizing at optimal places which improves the power system operation characteristics [6]. The Proposed Methodology aims to optimize the better location and sizing of DG unit to reduce the power losses and improves the voltage profile.
Certain types of DG’S like Photo Voltaic (PV), Fuel Cell (FC), and Micro Turbine (MT) will generate only real power to identify the optimal DG size at bus i respectively. The Possible condition for minimum loss is given by [9]
Pi PDGiPDi (12)
i
P
is also written as[(a )P b Q ]
] [a
1
P j ij j
n
1 j j i
ij ij
i
(13)
The above equation is rewritten as
[(a )P b Q ]]
] [a
1 [ P
P j ij j
n
1 j ji
ij ij
Di
DGi
(14)
Equation (14) describes the optimal sizing of DG for each bus so as to minimize the total active power loss after DG placement.
For DG’s like Synchronous Condenser it provides only reactive power to improve the voltage profile and power losses. To identify the optimal DG allocation, differentiate the loss equation on both sides with respect to
Q
i.The optimal DG size for every bus in Radial Distribution system is given by [9]
]] P d )Q [(c ]
[c 1 [ Q
Q j ij i
n
1
j ji
ij ij
Di
DGi
(15)
The DG unit at non-optimal places leads to higher losses. Thus the power loss is a function of loss coefficients. When DG unit is installed in the system then the loss coefficient value will changes as it depends on the state variable voltage and angle. Another load flow calculation is required for updating the values of loss coefficients. Finally the optimum size DG for each bus is calculated from base case load flows.
The next process is to identify the optimum DG location using proposed approach so that the approximate power losses are reduced and bus voltage profile is improved.
3.2 Computational Procedure for Proposed Approach
[1] Start the Process.
[2] Run the Base Case without DG using NR load flow using MATLAB software and calculate the bus voltage magnitude, Angle, Real and Reactive Power Loss Respectively.
[3] After Load flow Identify the optimum sizing for each bus using equation (14) and (15).
Approach the corresponding location with the optimum
sizing obtain from the above step.
[5] Check for Constraint Violation after DG placement.
[6] Locate the bus at which the loss is minimum after DG placement and this is the optimum location for DG.
[7] Stop the Process.
IV. SIMULATION RESULTS AND DISCUSSIONS
The Proposed Methodology is tested on two different radial distribution test system such as 15 buses and 34 buses with different sizes are simulated in MATLAB environment to calculate the optimum DG sizes for various buses and approximate total power loss with DG at various location.
4.1 Optimum Size allocation
Based on the proposed approach optimum sizes of DG’s are determined using equation (14) and (15) at various nodes for two radial distribution systems such as 15 buses and 34 buses respectively. In 15 bus radial distribution system optimum sizes of DG ranging from 44.1 to 479.0924 KW and 44.9910 to 487.1403 KVAR then the ranges of other DG sizes for 34 bus system varies from 13.5 to 319.1544 KW and 7.5 to 197.5521 KVAR. After connecting DG’s one by one it is important to note that the total power loss is lowest at the corresponding buses. Based on this result of DG sizing the optimal location of DG is determined where the total real and reactive power loss is minimum at the respective buses.Figure.1 shows the optimum real and reactive power sizes of DG at 15 bus radial distribution system.
Figure 1.Optimum Real and Reactive power sizes of DG at 15 bus radial distribution system
Figure.2 shows the optimum real and reactive power sizes of DG at 34 bus radial distribution system.
Figure 2.Optimum Real and Reactive power sizes of DG at 34 bus Radial Distribution System
4.2 Selection of optimum location
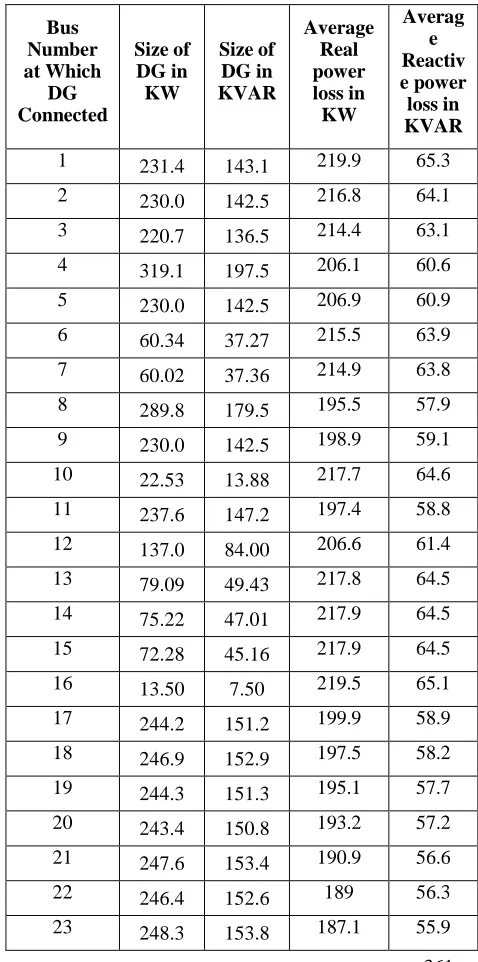
With the help of optimum DG sizes obtained at various nodes it is best enough to find out the optimum location that would leads to calculate the least total power losses. In 34 bus radial distribution system bus 25 is located as optimal placement of DG. After DG placement total real and reactive power loss is reduced and average real power loss is reduced from 219.9 KW to 186.4 KW and average reactive power loss is reduced to the range of 65.3 KVAR to 56 KVAR. From the result, it is noted that bus 2 is selected as optimum location for 15 bus radial distribution system after DG placement and sizing where the total real and reactive power loss is minimum at the corresponding buses and the average real power loss is reduced from 59.7 KW to 36.3 KW and average reactive power loss is reduced from 55.3 KVAR to 32.6 KVAR.
Table.1: Result of Average Real and Reactive power loss after connecting DG at 34 bus radial Distribution system.
Bus Number at Which
DG Connected
Size of DG in KW
Size of DG in KVAR
Average Real power loss in KW
Averag e Reactiv e power
loss in KVAR
1 231.4 143.1 219.9 65.3
2 230.0 142.5 216.8 64.1
3 220.7 136.5 214.4 63.1
4 319.1 197.5 206.1 60.6
5 230.0 142.5 206.9 60.9
6 60.34 37.27 215.5 63.9
7 60.02 37.36 214.9 63.8
8 289.8 179.5 195.5 57.9
9 230.0 142.5 198.9 59.1
10 22.53 13.88 217.7 64.6
11 237.6 147.2 197.4 58.8
12 137.0 84.00 206.6 61.4
13 79.09 49.43 217.8 64.5
14 75.22 47.01 217.9 64.5
15 72.28 45.16 217.9 64.5
16 13.50 7.50 219.5 65.1
17 244.2 151.2 199.9 58.9
18 246.9 152.9 197.5 58.2
19 244.3 151.3 195.1 57.7
20 243.4 150.8 193.2 57.2
21 247.6 153.4 190.9 56.6
22 246.4 152.6 189 56.3
Approach
24 241.3 149.5 186.5 55.9
25 236.7 146.6 186.4 56
26 233.1 144.4 186.7 56.1
27 137.0 85.00 199.8 59.7
28 77.42 49.55 213.4 63.3
29 77.34 49.50 213.4 63.3
30 75.00 48.00 213.5 63.3
31 59.23 35.85 214.1 63.6
32 58.61 35.47 214.1 63.6
33 58.04 35.13 214.1 63.6
34 57.00 34.50 214.2 63.7
Table.2: Result of Average Real and Reactive power loss after connecting DG at 15 bus radial Distribution system.
Bus Number at which
DG Connected
Size of DG in KW
Size of DG in KVAR
Average Real Power Loss in
KW
Average Reactive Power Loss in KVAR
1 45.92 46.33 59.7 55.3
2 479.0 487.1 36.3 32.6
3 217.3 221.5 41.7 37.8
4 256.4 261.6 36.8 33.0
5 44.10 44.99 55.0 50.8
6 161.5 164.8 46.3 43.5
7 140.0 142.8 47.5 44.6
8 70.00 71.41 53.3 49.7
9 80.79 82.41 54.5 50.4
10 44.10 44.99 56.7 52.5
11 151.2 154.3 44.8 41.3
12 75.01 76.52 51.3 47.6
13 44.10 44.99 54.5 50.6
14 70.00 71.41 52.3 48.2
15 140.0 142.8 45.6 41.7
4.3 Optimum Bus voltage profile
The Voltage at various buses should be maintained within the acceptable limits to meet out the power system demand. But the Bus voltage may reach the permissible limit when DG is not connected to the distribution system or the bus voltage may lack due to some disturbances. For this reason Distributed Generation should be placed and sized at the relevant bus location in radial Distribution system so that the bus voltage profile gets improved.
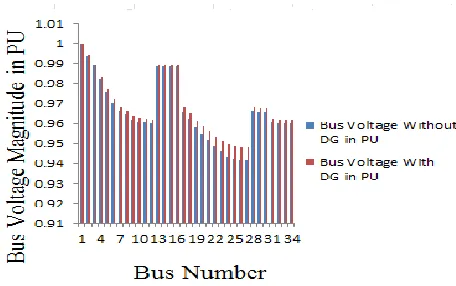
Figure 3 shows the Result of Bus Voltage Profile at various nodes for 15 bus radial distribution system with and without DG.
Figure 3.Bus Voltage Profile with and without DG for 15 bus system
Figure 4 shows the result of bus voltage profile at various nodes for 34 bus radial distribution system with and without connecting DG.
Figure 4. Bus Voltage Profile with and without DG for 15 bus system
4.4. Summary of Simulation Results
Approach
Table 3: Total Real power loss with and without DG
Test System
Optimal Location
Optimum DG Size (KW)
Total Real Power Loss (MW)
Without DG
With DG
15 2 479.06 89.53 54.49
34 25 236.73 747.5 633.8
Table 4: Total Reactive power loss with and without DG
Test System
Optimal location
Optimum DG size (KVAR)
Total Reactive power Loss
(MVAR)
Without DG
With DG
15 2 487.1 83.00 48.83
34 25 146.6 221.98 190.2
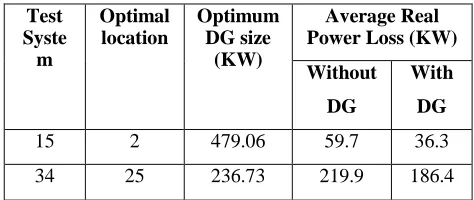
Table 5: Average Real power loss with and without DG
Test Syste m
Optimal location
Optimum DG size
(KW)
Average Real Power Loss (KW)
Without
DG
With
DG
15 2 479.06 59.7 36.3
34 25 236.73 219.9 186.4
Table 6: Average Reactive power loss with and without DG
Test System
Optimal location
Optimum DG size (KVAR)
Average Reactive power
Loss (KVAR)
Without
DG
With
DG
15 2 487.14 55.3 32.6
34 25 146.67 65.3 56.0
Table 7: Average Voltage with and without DG
Test System
Average Voltage without DG
(PU)
Average Voltage with DG
(PU)
15 0.9581 0.9688
34 0.9657 0.9682
Table 8: Bus Voltage Profile with and without DG
Test System
Bus Voltage Profile without
DG
(PU)
Bus Voltage Profile with
DG
(PU)
15 0.9445
at 13 bus
1.0000 at 1 bus
0.9602 at 13 bus
1.0000 at 1 bus
34 0.9416
at 27 bus
1.0000 at 1 bus
0.9672 at 27 bus
1.0000 at 1 bus
V. CONCLUSION
In this paper a new emerging method called analytical approach is used to identify the optimal placement and optimum sizing of Distributed Generation in 15 buses and 34 buses Radial Distribution Feeder. Allocation of DG at non-optimal places leads to some of the power system issues such as high power loss, reduced voltage profile etc. But by proper sitting and sizing of DG at optimal places real and reactive power loss is reduced and bus voltage gets improved in the corresponding buses respectively. Due to some constraints it is not possible to select the best location in practical application. To avoid this problem this analysis considers a general loss coefficient factor so that the losses arising from different places were varies greatly and clearly identifies the optimal locationfor DG placement.
ACKNOWLEDGEMENT
The authors are grateful to the Principal and management of K.L.N College of Engineering, Madurai for providing all facilities for the research work.
REFERENCES
[1] W.El-Khattam, M.M.A.Salama, ―Distributed Generation Technologies, definitions and benefits‖, Electric Power Systems Research, Vol.No.71, pp.119-128, 2004.
[2] Thomas Ackermann, Goran Andersson, Lennart Soder,―Distributed Generation: a definition‖, Electric Power Systems Research, Vol.No.57, pp.195–204, 2001.
[3] Carmen L.T. Borges, Djalma M. Falcao, ―Optimal Distributed Generation allocation for reliability, losses and voltage improvement‖, Electrical power and Energy systems, Vol.No.28, pp.413-420, 2006.
[4] Mohd Ilyas, Syed Mohammad Tanweer,Asadur Rahm, ―Optimal Placement of Distributed Generation on Radial Distribution system for loss minimization and improvement of voltage profile‖, International journal of Modern Engineering Research,Vol.3.issue.4,pp.2296-2312,2013.
[5] Ahmad Memaripour, ―Power Flow in Distribution System with consideration of Distributed Generation‖, International Journal of Academic Research in Applied science, pp.60-67, 2012.
Approach
system‖, Electrical Power and Energy Systems, Vol.No. 32, pp. 849–856, 2010.
[7] O.Amanifar,M.E.Hamedani Golshan, ―Optimal Distributed Generation placement and sizing for loss and THD reduction and voltage profile improvement in distribution systems using particle swarm optimization and sensitivity analysis‖, International Journal on Technical and Physical problems of Engineering (IJTPE) , Issue.7,vol 3,No.2,pp 47-53,2011.
[8] Fahad S.Abu-Mouti, M.E.El-Harway, ―Optimal Distributed Generation Allocation and sizing in Distribution systems via Artificial Bee Colony Algorithm‖, IEEE Transaction on Power delivery, Vol.26, No.4, pp.2090-2101, 2011.
[9] M.Abbagana, G.A.Bakare, and I.Mustapha ―Optimal placement and sizing of a Distributed Generator in a power distribution system using Differential Evolution‖, International Technology, Education and Environment Conference, pp.536-549, 2008. [10] Faruk Ugranli, Engin Karatepe, ―Multiple Distributed Generation
planning under load uncertainty and different penetration levels‖, Electric power and energy systems, Vol.No.46, pp.132-144, 2013. [11] Naresh Acharya, Pukar Mahat,N.Mithulanathan, ―An Analytical